GetCoattail's Timing board sorts stocks by confluence: how many of our timing techniques are flashing a buy signal at the same time. The intuition is the one behind most signal-stacking tools — one indicator can be noise; several agreeing should mean something. Before letting that sort order stand in for quality, we tested it as we test everything here: rules fixed in advance, our own production code, a benchmark we could lose to.
The short answer: in five years of daily data, the stocks our board ranked highest did not demonstrate an edge. Across 17 non-overlapping 60-trading-day periods, the top 50 beat SPY by +0.61% on average — and the average stock beat it by +0.78%. The gap between the board's picks and the field, −0.17 points per period, comes with a 95% confidence interval from −1.98 to +1.63 points. The interval includes zero, and most values inside it are small: the board survives as a screening device, not as a ranking of expected returns.
Why this question
Confluence is a seductive idea because each technique on the board is defensible: moving-average alignment, breakouts, momentum oscillators, volume confirmation. Counting agreements feels like counting evidence.
The catch is that the witnesses are not independent. Four of the 15 auto-judged techniques are trend tools, and seven more are breakout and entry patterns that tend to fire after a stock has already moved. A stock with seven signals lit is often not seven independent endorsements; it is frequently a stock that has just run hard, described seven ways. That could mark genuine momentum, a crowd arriving late, or nothing at all. We wrote down all three hypotheses before computing anything, because a study that can only publish one answer is not a test.
The test
The rules were fixed in a written plan before returns were computed. Its primary metric — the only one this article draws conclusions from — is, for each non-overlapping 60-trading-day period, the equal-weighted average return (minus SPY's) of the 50 highest-ranked stocks, less the same average for the whole eligible universe. Everything else below is description or a robustness check.
Signals are judged by the site's own code, not a reimplementation: the study extracts the same rule functions the live Timing board runs and applies them to daily bars. Of the 23 timing techniques GetCoattail lists, 15 are mechanical enough to judge automatically — the study's denominator; the other eight, interpretive or intraday methods such as candle patterns and Wyckoff, produce no machine signal. A technique counts as "on" if its rule fired within the last three trading days, using only data available that day. Stocks are ranked by families represented, then count, then freshest signal — the board's own ordering (methodology box).
The universe is GetCoattail's registry: 1,631 stocks with daily bars from September 27, 2021 to October 2, 2026. Sixteen listings with fewer than 200 bars were excluded, leaving 1,615 eligible stocks, each entering only after 200 of its own bars exist (the warmup rule). Entry is the next trading day's close — signals are computed from closing data, so same-day entry would spend information before it exists — and exit is 60 trading days later. Returns use dividend-adjusted closes for the stock and SPY alike. Scoring every trading day as a start gives 1,647,112 stock-days over 1,061 start dates, of which 1,548,971 completed a 60-day measurement; those completions fall on 1,000 start dates — the ones on which a full 60-day window could still be measured to the end (the final 61 start dates have no completions, being too close to the end of the data). The rest are counted, with reasons, under Objections and limits. The pipeline was validated against the live board first.
The headline result
| Measure | Result (17 periods) |
|---|---|
| Top 50, average excess vs SPY per period | +0.61% |
| Whole universe, average excess vs SPY per period | +0.78% |
| Spread (top 50 − universe) | −0.17 pts |
| 95% confidence interval of the spread | −1.98 to +1.63 pts |
| Periods with a negative spread | 11 of 17 |
Primary metric, pre-registered: non-overlapping 60-trading-day periods, starts from July 13, 2022 to May 11, 2026; equal-weighted; entry at the next trading day's close.
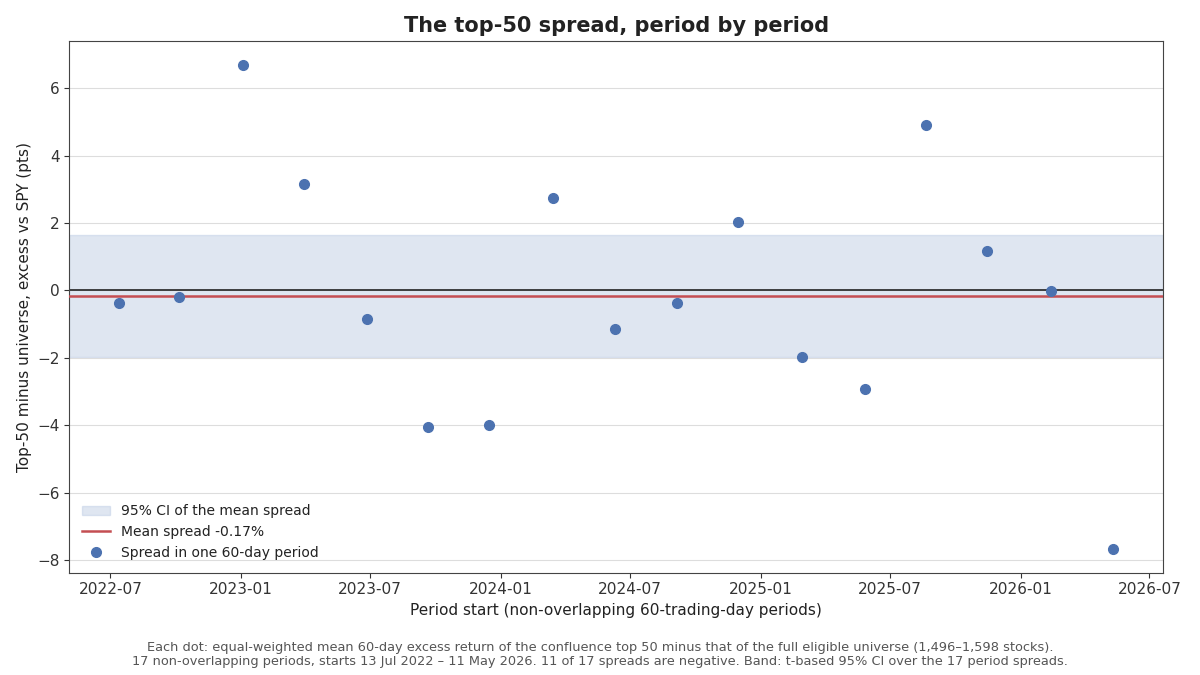
Read the result at the strength the evidence allows. The top 50 did not beat the average stock — and this sample cannot distinguish the true spread from zero, or from a small effect in either direction. The period-by-period record is mostly a coin flip weighted slightly negative: spreads ran from +6.69 pts (period starting January 3, 2023) to −7.66 pts (period starting May 11, 2026), with 11 of 17 below zero. What the data does rule out is a large premium: the interval's top end is +1.63 pts per period, and a big, reliable reward for agreement should have shown some sign across roughly 1,500 stocks (the period universes run 1,496 to 1,598).
What the buckets show
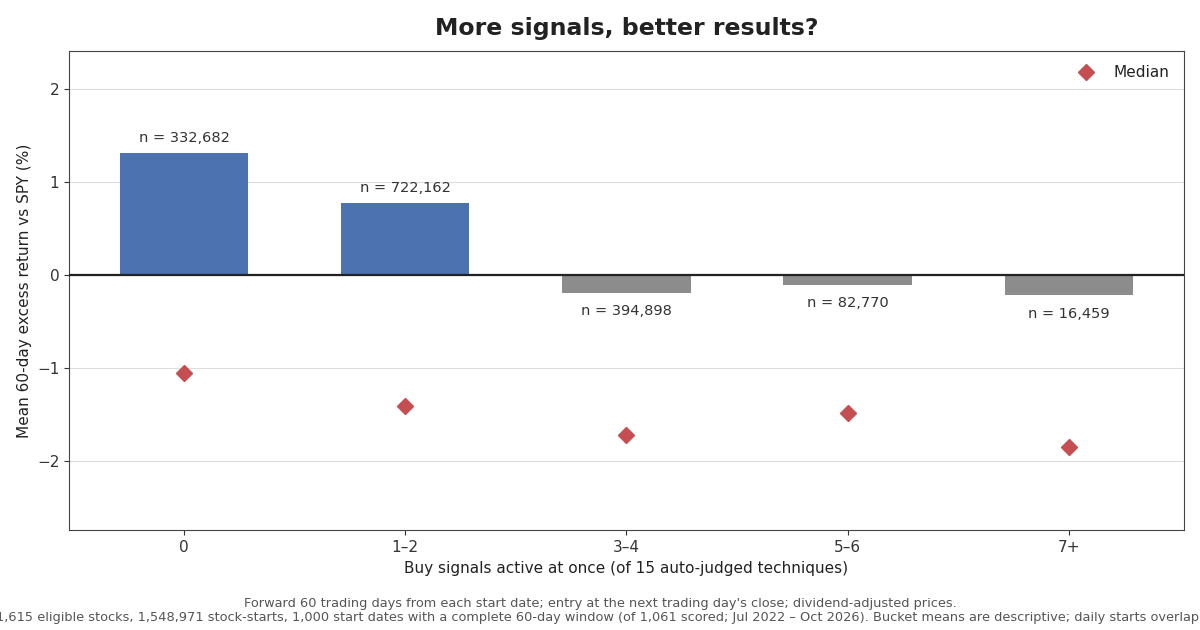
The full daily sample — every start date, not just the 17 period starts — shows the same shape:
| Signals on | n | Mean return | Median return | Mean excess vs SPY | Median excess vs SPY | Beat SPY |
|---|---|---|---|---|---|---|
| 0 | 332,682 | +6.26% | +3.92% | +1.31% | −1.06% | 47.1% |
| 1–2 | 722,162 | +5.39% | +3.11% | +0.78% | −1.41% | 45.9% |
| 3–4 | 394,898 | +3.83% | +2.17% | −0.19% | −1.72% | 44.1% |
| 5–6 | 82,770 | +3.84% | +2.36% | −0.11% | −1.48% | 44.2% |
| 7+ | 16,459 | +3.66% | +2.13% | −0.22% | −1.85% | 43.5% |
Two patterns stand out, both labelled description, not findings. First, the average excess return steps down as the count rises: +1.31% with no signals on, +0.78% with one or two, then slightly negative from three upward, reaching −0.22% at seven or more. The share beating SPY falls alongside, 47.1% to 43.5%; high-overlap states are rare (7+ ≈ 1% of observations). Second, the averages flatter every group: the median stock trailed SPY in all five buckets, including the zero-signal bucket (−1.06%). A minority of large winners pulls each mean above its median (chart 3), so "the average stock with no signals beat SPY by 1.31%" and "the typical stock trailed it" are both true.
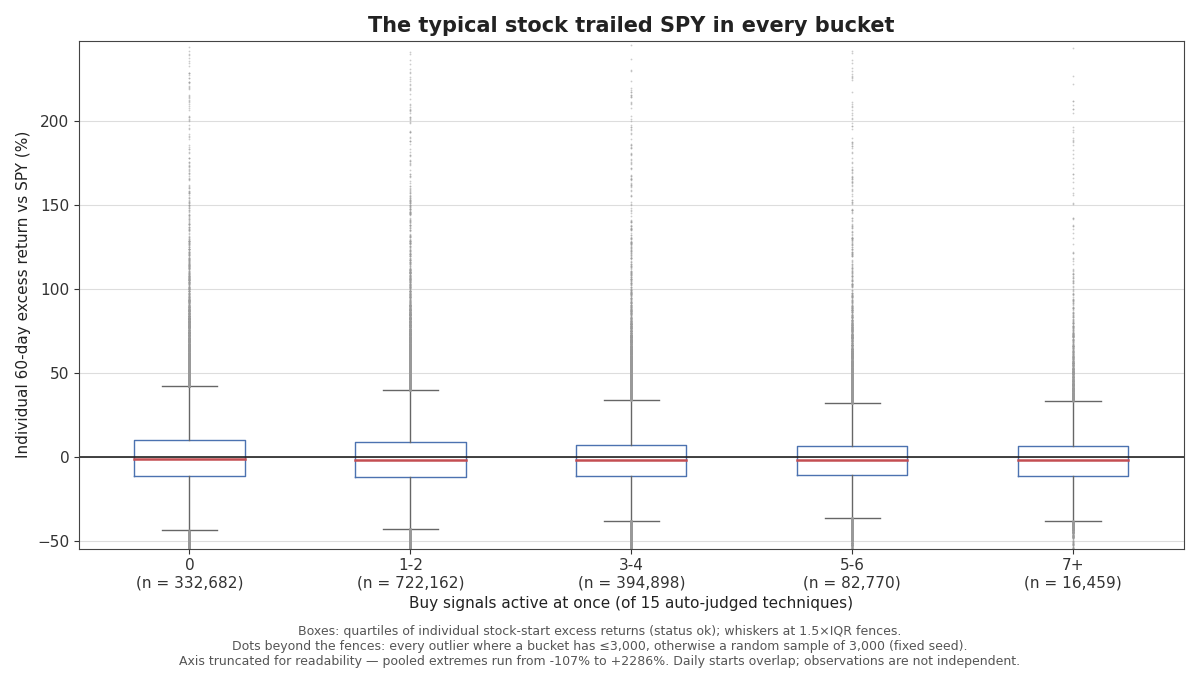
A caution: daily starts overlap, so these 1.5 million observations share market days and are nowhere near independent; we do not test the bucket slope. The inferential claim is the period metric above — the buckets show the raw shape it summarizes, and a slope pointing the "wrong" way belongs next to a null headline, not in a drawer.
Does the result survive?
We re-ran the primary metric seven ways, all specified in advance. A 20-day hold gives −0.39 pts (52 periods; 95% CI −1.16 to +0.38); a 120-day hold gives +2.54 pts, but on only eight periods (CI −2.00 to +7.09). Ranking by family count alone gives +0.66 pts (CI −1.29 to +2.61). Top 20 only: +0.39 pts (CI −2.63 to +3.42). Top 100: −0.62 pts (CI −2.03 to +0.78). Entering at the signal day's close — the shortcut our displayed backtests use — gives −0.23 pts (CI −2.07 to +1.62), so the null is not an entry artifact. Weekly overlapping starts, Newey-West errors: −0.54 pts (CI −1.40 to +0.31).
Every one of the seven intervals includes zero. The checks agree on the only statement any of them can support — no variation found a positive spread distinguishable from chance — while disagreeing about the sign of the point estimate, which is what underpowered variations do. A reader who prefers the 120-day or top-20 variant: this dataset cannot confirm those either.
Objections and limits
The universe is today's universe. The 1,631 stocks are names listed in GetCoattail's registry in October 2026, applied backwards. A stock delisted during the five years is missing entirely — not one sample stock's price series ends before the final date, so the dataset contains zero delisted names. Delisted stocks tend to have poor subsequent returns, so their absence inflates both groups' average returns. The spread between the groups is less exposed than the levels, but not immune, and this dataset cannot measure the distortion. This is the study's largest known bias, and it points in the flattering direction.
Seventeen periods is a small sample, and one market. The periods span the 2022 bear market through 2026 — several regimes in one sample — and the wide interval is the honest consequence. A regime split chosen after seeing the results would be post-hoc, so we report none.
The count is not 15 independent votes. Trend and breakout techniques dominate the 15, so a high count partly restates "this stock has already risen." The bucket pattern is consistent with the overheating story — signals clustering after a run — but consistent is all it is; the mechanism is untested.
Two measurement choices to know. Signals are judged on the unadjusted (split-adjusted only) prices the site's charts display, while returns use dividend-adjusted closes; around an ex-dividend date the two conventions can judge the same day differently. Forward returns count each stock's own trading days, so after a long halt, "60 trading days" can span far more calendar time than SPY's window.
Missing data, counted. Of 1,647,112 eligible stock-days, 96,526 (5.9%) sit too close to the end of the data to complete a 60-day window, and 1,615 (0.1%) had no next-day price; 324,077 earlier stock-days fell to the 200-bar warmup, and the 16 stocks that never reached 200 bars appear nowhere. Costs, slippage and taxes are excluded throughout.
How to read the board now
The board's plumbing does not change: it remains a fast way to see which stocks have several textbook setups active at once — genuinely useful as a first pass. What changes is the claim attached to the sort order. Treat a stock's position on the board as a reading list, not a ranking of prospects. Open the stock page, look at which families are firing — trend alone, or trend plus oscillator plus volume — and whether the signals are fresh or three days old. Then look at what the board cannot see: the filings, the valuation, the reason the price moved. The count tells you where to start reading. In five years of our own data, it did not tell you what would win.
Methodology and data
- Data: daily bars (Yahoo Finance) for 1,631 registry stocks and SPY, September 27, 2021 – October 2, 2026; median series length 1,260 bars. Signal judgments use unadjusted (split-adjusted only) closes; returns use dividend-adjusted closes.
- Signal: of the 23 timing techniques GetCoattail lists, the 15 with mechanical rules: trend (moving average, MACD, ADX, Ichimoku), breakout/entry (Darvas box, Turtle, Livermore, VCP, cup pattern, gap, pullback), oscillator (RSI, stochastic, Bollinger Bands), volume. "On" means the rule fired within the last three trading days, evaluated with data through that day only.
- Sample: 1,615 eligible stocks after the 200-bar warmup (16 excluded); 1,647,112 stock-days scored; 1,548,971 completed 60-day measurements across 1,000 start dates (of 1,061 scored start dates; the final 61 sit too close to the end of the data for a 60-day window to complete). Primary metric: 17 non-overlapping 60-trading-day periods, starts July 13, 2022 – May 11, 2026; ranking by families represented (of 4), then technique count (of 15), then freshest signal; confidence interval: a t-interval over the 17 period spreads. Robustness variants: 20- and 120-day holds, family-only ranking, same-day entry, top 20 / top 100, weekly overlapping starts with Newey-West errors.
- Verification: replaying October 2, 2026 matched the site's signal counts for 1,630 of 1,631 stocks (one mismatch, 0.06%, from price decimal precision at an ADX threshold); an independent reimplementation reproduced hand-checked signals 12 of 12.
- Costs: trading costs, slippage and taxes are not reflected. Returns are equal-weighted.
- Data files: the tables behind this article are published with it — Table D, bucket summary (CSV); Table E, the 17 periods behind the primary metric (CSV); Table G, robustness checks (CSV). The start-level panel behind them (1,548,971 measured stock-starts) is not attached: at this size it exceeds what this site can serve as a single file.
Past patterns are not a promise of future results. For education only. Not investment advice.
Revision history
- v1 — October 5, 2026: initial publication. The question, hypotheses, primary metric, bucket boundaries and robustness checks were fixed in a written plan before any returns were computed; the computation followed it unchanged. Data through October 2, 2026. Future corrections will be appended here with date and reason, not edited in silently.