We re-parsed five years of the most-watched disclosures in America, trade by trade, and scored what a copycat could actually have earned.
Nancy Pelosi's filings may be the most watched in American politics. Tracker accounts amplify every one, and an ETF launched in 2023 — the Unusual Whales Subversive Democratic Trading ETF — trades under the ticker NANC, a nod to the former Speaker, and tracks Democratic lawmakers' disclosed trades. The legend says: whatever she buys, buy.
So we did to the Pelosi record what we do to every record on this site. We rebuilt it from the source documents — all 34 Periodic Transaction Reports filed from January 2021 to August 2026 — and this time we read the part of the form most trackers skip: the asset description. That one change dissolves the legend's foundation. The famous stock-picking record is not a stock record. Over the last five years, the Pelosi filings contain seven outright stock purchases that a member of the public could have copied — and only two of them can be scored at all. The rest of the machine is call options: 28 purchases in the same window, 27 of them struck in the money, every one bought with at least nine months left to run.
Why the distinction matters
A stock buy and a call buy with the same ticker are different bets. A call's value depends on the strike, the expiry and the premium paid — and congressional disclosures publish none of the prices. They give an amount range for the whole transaction, not an option premium. Any tracker that lists "Pelosi bought Nvidia" without separating shares from calls is blending two different instruments into one fake track record — including, we found, our own earlier work: standard form-parsing reads the ticker and drops the description, so December 2021 Salesforce call purchases sit in our congressional signal file scored as if they were stock buys. This study exists to fix that, in public, starting with the most famous name in the data.
One more framing fact from the documents themselves: across all 114 de-duplicated transactions in the 34 filings, the owner code is SP — spouse — 114 times out of 114. The trades are Paul Pelosi's; the filings are the disclosure obligation that comes with them.
The test
Population. Every transaction in the 34 PTRs, re-parsed with a purpose-built parser that preserves the asset text, the House asset-type code ([ST] stock, [OP] options) and the free-text description. 124 rows extracted; 10 removed as duplicates (nine were amended-filing re-reports of the same trades; one was a same-day, same-amount charitable gift the de-duplication key cannot tell apart from its twin — both gifts remain in the published raw file). The result is classified trade by trade: outright stock, call options, option exercises, and everything else (private real-estate funds, a mutual fund, merger/spinoff receipts).
Window and entry. Same rules as our congressional tests: filings dated October 1, 2021 to September 30, 2026; entry at the close on the first trading day after the filing date — the first price a copycat could actually get; returns on dividend- and split-adjusted closes; every result expressed as excess over the S&P 500 (SPY) over the same window. Trading costs are not modelled, and amounts are disclosed only as ranges, so no position sizing is possible.
Stocks. Outright buys are scored at 30, 60 and 90 trading days; 60 is the headline.
Options. A disclosure cannot tell you what a call option earned — the premium is never published. So we refuse to fake it. For each call purchase we measure two honest things instead: (a) what the underlying stock did from copyable entry to the earlier of expiry or 60 trading days, versus the S&P 500 — a test of the underlying picks, explicitly not an option return; and (b) the structure of the bets themselves — strike versus the stock's price on the trade date (split-adjusted on both sides), and time to expiry.
Result 1: the stock record is two trades
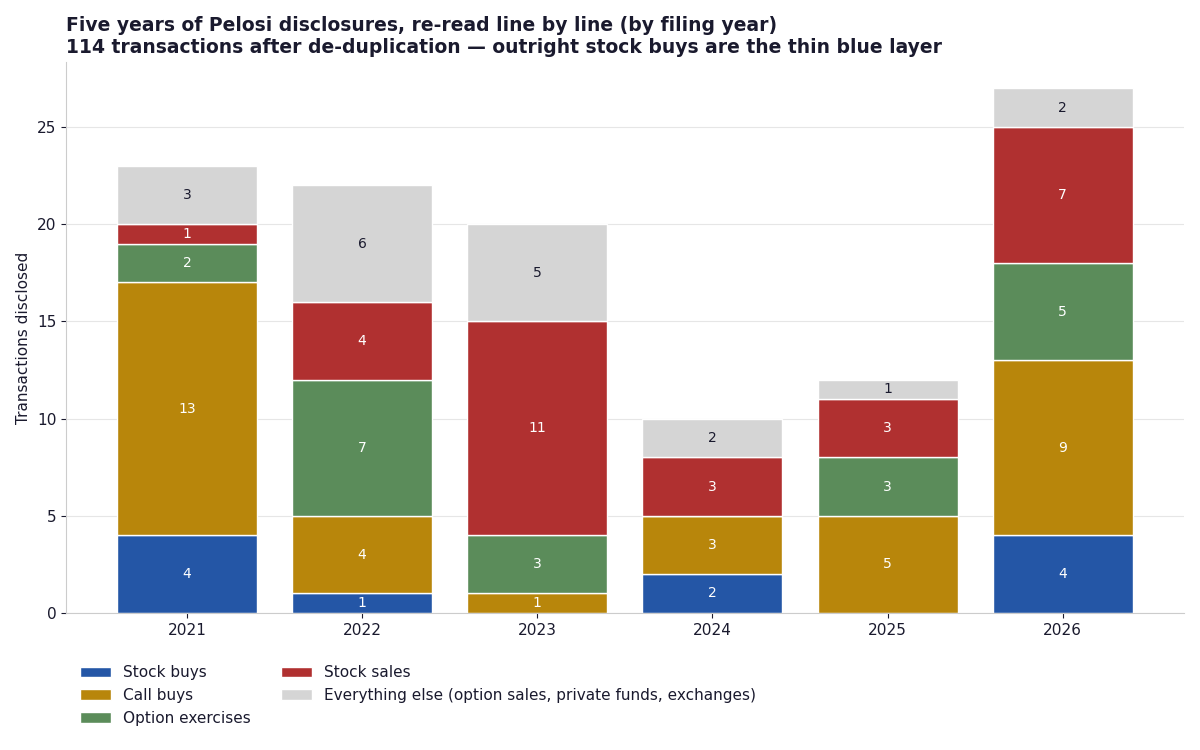
Seven outright stock purchases were filed in five years. Two cannot be scored because the asset — AllianceBernstein units, bought twice — has no price history in our 1,634-ticker price set. Three more (Bloom Energy twice, Intel once) were filed on August 21, 2026, too recently for a 60-day window to have elapsed by the end of our price data on October 2, 2026. That leaves two scorable trades. Both are Nvidia, both from 2024:
| Filed | Trade | Stock, next 60 trading days | S&P 500 | Excess |
|---|---|---|---|---|
| Jul 2, 2024 | Bought NVDA shares Jun 26, 2024 | −5.4% | +3.9% | −9.3 pts |
| Jul 30, 2024 | Bought NVDA shares Jul 26, 2024 | +20.0% | +5.5% | +14.5 pts |
The average of the two is +2.61 points with a 95% confidence interval of −20.7 to +26.0 points — a number that contains no information, and we present it only to show why. The House as a whole, scored under identical rules, averaged −0.07 points across 6,044 buys in our dataset. A Welch test of "Pelosi versus the House" returns a difference of +2.67 points with a confidence interval 47 points wide. There is no stock-picking record here to rank, in either direction: not because the trades were bad, but because there are effectively no trades. Anyone showing you a five-year "Pelosi stock win rate" is showing you options, exercises, or arithmetic performed on two observations.
Result 2: the call book — disciplined structure, ordinary picks
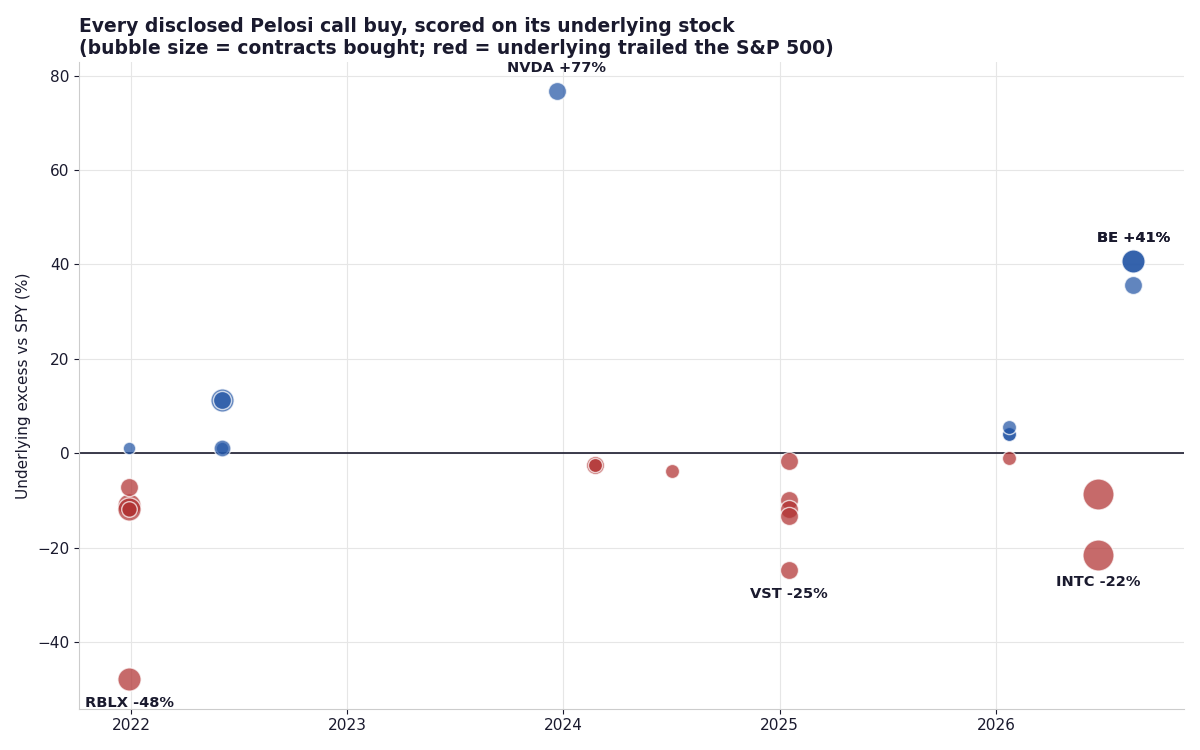
The actual record is 28 call purchases (and zero put purchases) filed in the window, 1,710 contracts in total, every one disclosing its strike and expiry. Structurally, the book is remarkably consistent:
- 27 of 28 were in the money on the trade date, one was at the money, none were out of the money (strikes compared with split-adjusted prices; six of the tickers split after purchase, and we adjusted for each split rather than misclassify them).
- Time to expiry ran 269 to 396 days, median 367. Sixteen of 28 (57%) had more than a year to run. These are LEAPS-style positions — leveraged stock exposure, not lottery tickets.
What did the underlying stocks do after a copycat could have entered? Headline measure — entry after filing, exit at the earlier of expiry or 60 trading days (in practice no call came within months of expiry, so 25 trades ran the full 60 days and three July 2026 trades were cut at the end of our price data):
| Call buys, underlying only | n | Mean | Median | Beat SPY | Avg win | Avg loss | 95% CI of mean |
|---|---|---|---|---|---|---|---|
| To expiry or 60 trading days | 28 | +1.53% | −2.03% | 42.9% | +19.48% | −11.92% | [−7.21, +10.28] |
| Fixed 60 trading days | 25 | −2.96% | −2.41% | 36.0% | +12.97% | −11.92% | [−11.09, +5.17] |
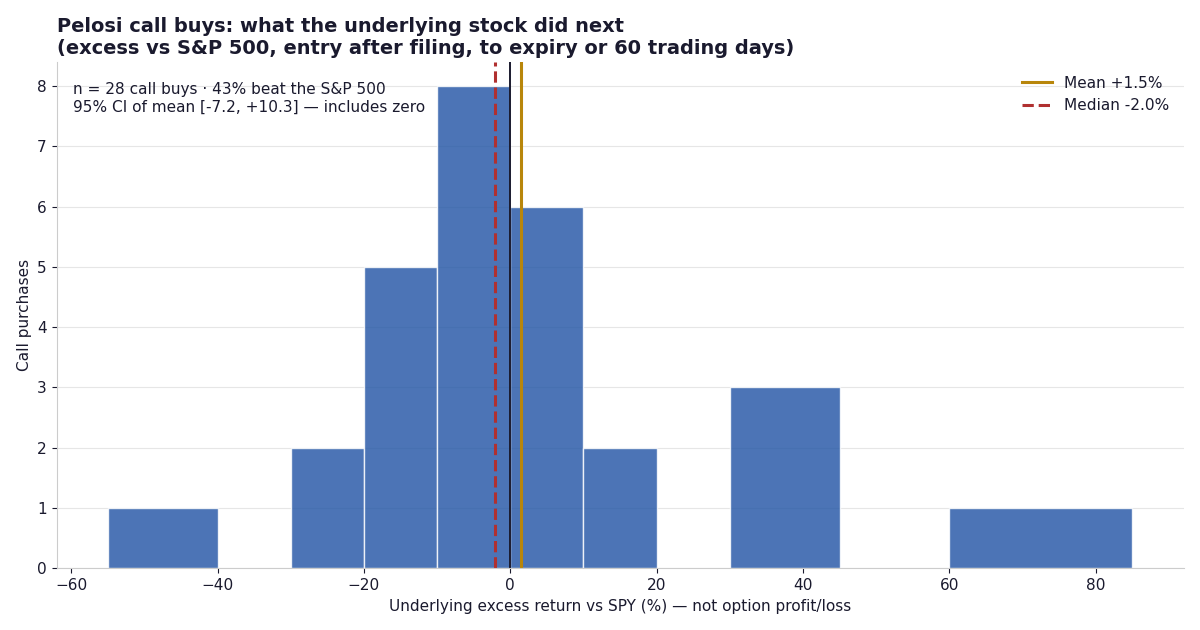
By the standard we apply to our own screens — a result needs a confidence interval that excludes zero — the underlying picks show no evidence of an edge after disclosure. The mean is carried by the right tail: the best underlying was Nvidia, bought in November 2023, whose stock rose 87.3% in the 60 days after the filing became public (+76.7 points of excess). The worst was Roblox, bought in December 2021, down 51.9% (−47.9 points). Year by year the average swings from −14.7 points (2021, n=6) to +11.1 (2026, n=9), with 2023's +76.7 resting on a single trade. And the filings themselves record the other side of the distribution: Disney calls that expired worthless for a disclosed loss of $132,824, and Roblox calls that expired worthless for $303,001.
Two warnings belong inside this result, not in a footnote. First, underlying returns are not option returns: a deep-in-the-money call amplifies the stock's move in percentage terms and can lose money on time decay even when the stock rises — but the premium paid is never disclosed, so nobody can compute the option P&L from these forms, and any source claiming a precise "Pelosi options return" is inventing the missing input. Second, the copycat's entry is up to 45 days after the trade. Whatever edge the original purchases had, this test measures only what was left of it once the filing went public.
Result 3: the "buys" that are endings
The third category explains most of the remaining headlines. The filings contain 20 option exercises (18 in the window) — 2,205 contracts exercised into 220,500 shares. An exercise is reported as a purchase, and trackers routinely headline it as fresh buying. It is the opposite: the end of a trade opened about a year earlier. In December 2024, 500 Nvidia calls bought in November 2023 were exercised into 50,000 shares (the purchase filing shows a $120 strike; after Nvidia's 10-for-1 split the exercise filing restates it as $12). In June 2025, 200 Broadcom calls bought in June 2024 at an $800 strike ($80 after the split) became 20,000 shares. The pattern — buy deep-in-the-money calls a year out, exercise them into shares — is a coherent, patient strategy. It is also one a disclosure-follower cannot replicate: by the time the purchase filing appears, the option position is weeks old and its price is unknowable from the form.
For completeness, the sales tell no dramatic story either. Of 28 stock sales filed in the window, five were charitable contributions or similar non-market transfers; the remaining 23, scored forward 60 days, preceded an average excess of +1.25 points (CI −4.76 to +7.25) — the sold stocks, if anything, slightly outperformed after the sales, with a confidence interval that includes zero. (One purely descriptive curiosity we are explicitly not drawing conclusions from: an average built on two trades would rank near the top of House members on our earlier table. A ranking built on two trades is not a ranking.)
How to read a Pelosi filing
- 1. Separate the [OP] rows from the [ST] rows before believing any number. The asset-type code is printed on the form; if a tracker's "win rate" mixes them, it is measuring a blend that never existed.
- 2. Treat "exercise" headlines as closings, not signals. Find the original call purchase — usually about a year earlier — before deciding anything happened today.
- 3. Read the strike against the stock price. A call struck far below the market with a year to run is leveraged stock exposure; the same ticker with a near-term, out-of-the-money strike would be a different bet entirely. The Pelosi book, on the evidence of 28 consecutive purchases, is the former.
- 4. Check the signal file before the headline. The file published with this article classifies all 114 transactions — stock, calls, exercises — so anyone can rebuild the two records separately.
Methodology and data
Sources: U.S. House Clerk Periodic Transaction Reports (34 filings, filed Jan 21, 2021 – Aug 21, 2026; index files 2021FD–2026FD), re-parsed in full including asset descriptions; adjusted daily price bars for 1,634 tickers to Oct 2, 2026; split events from Yahoo Finance chart data (used only to restate disclosed strikes on a split-adjusted basis). Window: filings Oct 1, 2021 – Sep 30, 2026. Entry: first trading day after the filing date, adjusted close. De-duplication: ticker, type, trade date, amount range and asset class (10 rows removed; see the data report). Exclusions, counted in the published signal file: 2 stock buys with no price history (AllianceBernstein units), 3 stock buys too recent to score, 1 share purchase with no ticker printed on the form (Roblox, Mar 2021, outside the window in any case). Option premiums are never disclosed, so option profit/loss is not computed anywhere in this study; underlying-stock figures are labelled as such wherever they appear. Trading costs and taxes are not reflected. Related reading: "The 56% Win Rate That Still Didn't Beat the S&P 500" applies the same entry rule and the same standard of proof.
- Data files: all 114 de-duplicated transactions with classifications, scores and exclusion reasons (CSV).
Past patterns are not a promise of future results. For education only — not investment advice.
Revision history
- v1.0 — October 6, 2026: first publication.