We added five years of U.S. Senate trade disclosures to GetCoattail — then tested them before trusting them. Copied after filing, Senate buys beat the S&P 500 on average over the next 60 trading days. House buys did not. And the typical Senate buy was a coin flip.
This month we added U.S. Senate disclosures to GetCoattail, five years of Periodic Transaction Reports from the Senate eFD system. Before we let that data anywhere near our screens, we ran it through the same test we apply to everything on this site: if you had copied the trades after they became public, would you have beaten the S&P 500?
Congress is a natural experiment with two chambers. Senators and House members file under the same law, on the same forms, with the same 45-day lag. So we tested both chambers side by side, with one rule set, and pre-registered the method before looking at the results.
The test
Population. Every purchase reported on a Periodic Transaction Report filed between October 1, 2021 and September 30, 2026. That is 9,839 House purchases parsed from House Clerk filings and 1,903 Senate purchases from Senate eFD filings, after removing duplicate rows created by amended filings. Senate filings are electronic and were read in full; 476 House filings were scanned images that could not be machine-read and are excluded.
Entry. The close on the first trading day after the filing date — the first price at which a member of the public could actually have copied the trade. Not the trade date: by the time a disclosure exists, the trade is up to 45 days old.
Scoring. Each purchase is held for 30, 60 and 90 trading days. The headline measure is 60 days. Returns use dividend- and split-adjusted closes, and every trade is scored as excess return versus the S&P 500 (SPY) over the same window. Purchases whose ticker has no price history in our 1,634-ticker price set are excluded and counted — 492 Senate and 2,165 House purchases. The price set is built from currently tracked tickers, which tilts both chambers' results upward in the same way; the comparison between chambers is the point of this test, and it applies one rule to both.
No cherry-picking. Amounts are disclosed only as ranges, so positions cannot be sized; every purchase counts once. Trading costs are not modelled. The full signal file — all 10,008 extracted purchases with their scores — is published with this article.
Result 1: the chambers split
Copied after disclosure and held for 60 trading days, Senate purchases beat the S&P 500 by +1.46% on average (817 purchases; 95% confidence interval +0.33% to +2.59%). House purchases did not: −0.07% on average (6,044 purchases; CI −0.51% to +0.37%). The difference between the chambers, +1.53 percentage points, also has a confidence interval that excludes zero (+0.32 to +2.74).
| 60 trading days after filing | Buys scored | Mean excess | Median | Beat SPY | 95% CI of mean |
|---|---|---|---|---|---|
| U.S. Senate | 817 | +1.46% | −0.03% | 49.7% | [+0.33, +2.59] |
| U.S. House | 6,044 | −0.07% | −1.52% | 45.6% | [−0.51, +0.37] |
Primary metric, pre-registered: purchases on PTRs filed 2021-10-01 to 2026-09-30; entry at the first trading day's close after the filing date; adjusted closes; excess versus SPY over the same window.
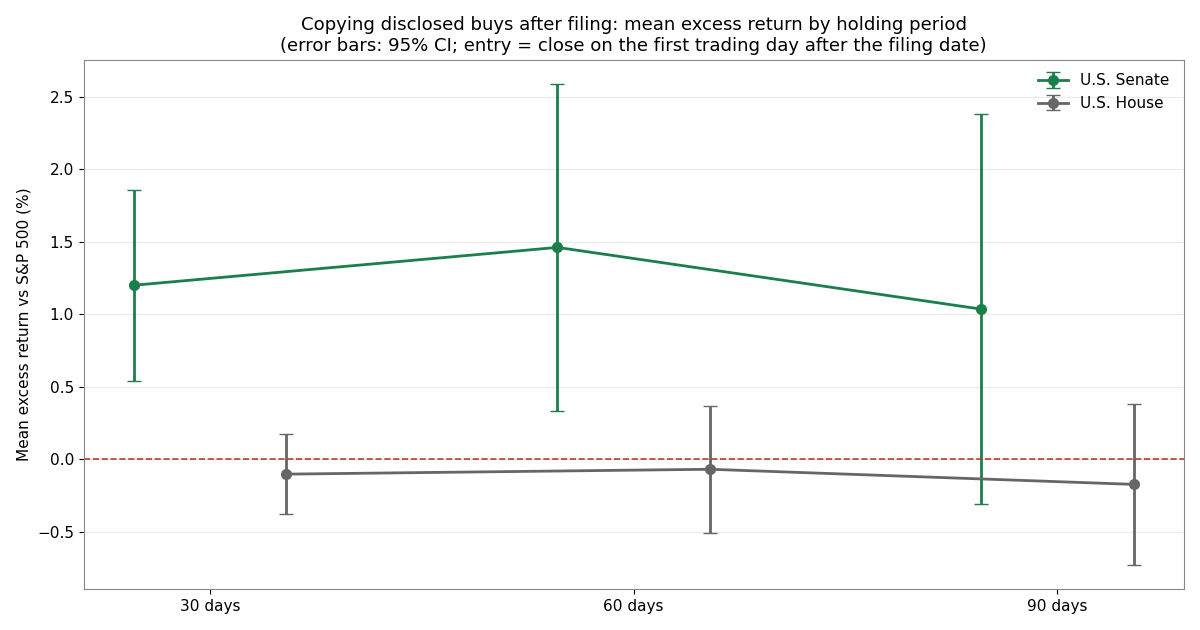
The pattern is the same at 30 days (Senate +1.20%, House −0.10%) and fades into noise at 90 days (Senate +1.04%, CI crossing zero; House −0.17%). Entering on the filing day itself instead of the day after changes nothing material (Senate +1.55%, House −0.02%).
By the standards we apply to our own screens — an average whose confidence interval excludes zero is a result, anything else is a lead — the pooled Senate number clears the bar, and the House number does not clear anything.
Result 2: the average is not the typical trade
Here is what the average hides. The median Senate purchase lost to the index by 0.03% over 60 days, and only 49.7% of Senate purchases beat the S&P 500 at all. The House median was worse (−1.52%, 45.6% beat the index), but in both chambers the typical copied trade was a coin flip or worse.
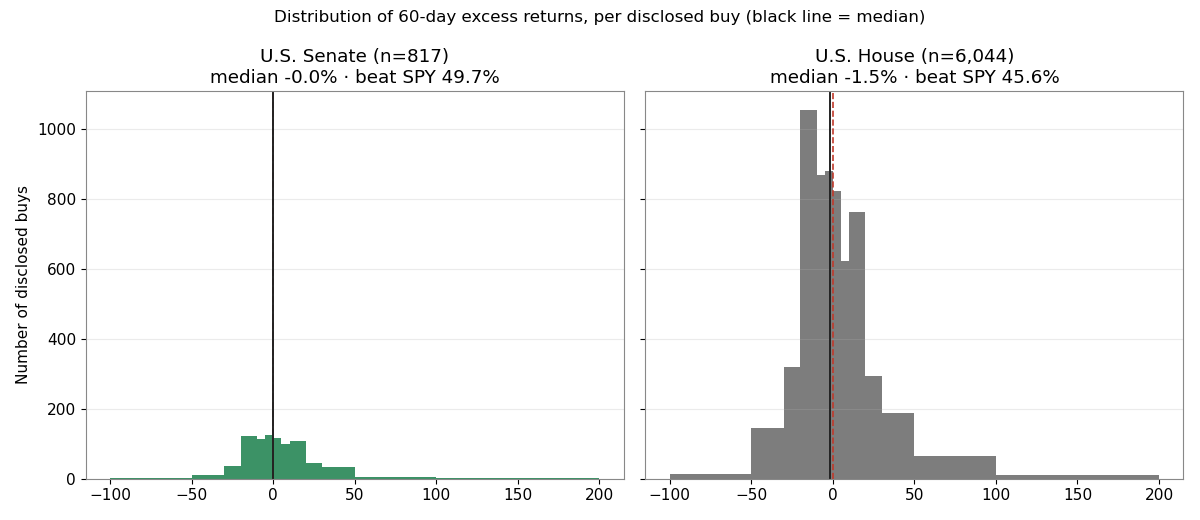
The Senate's positive average is produced by a right tail: a minority of purchases that ran far ahead of the market. The single largest is real, and we verified it against the raw price series rather than trusting our own pipeline — a purchase of Micron disclosed in April 2026 that gained 173% over the following 60 trading days while the S&P 500 gained 13.5%, during the memory-chip rally. It is in the data because it happened, not because it is typical. Averages built on distributions like this describe the tail, not the trade you are likely to copy.
Result 3: "the Senate" is a small cast
The Senate sample rests on few shoulders. Only 20 senators account for the scored purchases, and two of them — Tommy Tuberville (245 purchases) and Markwayne Mullin (223) — supply 57% of the signals. The House sample, by contrast, spans 111 members.
Two checks follow from that. First, removing both top senators does not kill the result: the remaining 349 purchases average +2.54% (CI +0.67 to +4.41), with 51.6% beating the index. The edge is not one person's account. Second, and less comfortable: if each senator counts once — average each member's purchases first, then average the members — the Senate estimate becomes +2.57% with a confidence interval of −0.97% to +6.12%. With 20 members, the member-level test cannot separate the Senate's edge from zero. Both statements are true at once, and we report both: the pooled trades cleared the bar; the per-member evidence is thinner.
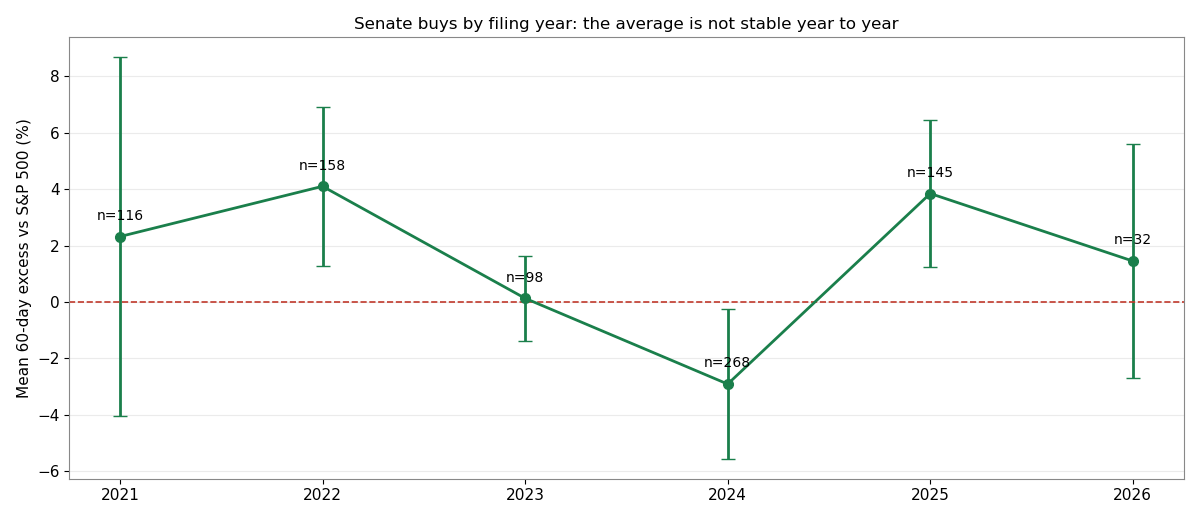
Two more facts about whose trades these are. In the Senate sample, 65% of scored purchases sit in joint accounts and 27% in a spouse's name; only 5% are in the senator's own name. And the year-by-year path is unstable: Senate purchases filed in 2022 averaged +4.10% excess, those filed in 2024 averaged −2.91%. A signal that changes sign by year is not a strategy; it is a sample.
Why might the chambers differ at all? We did not test explanations, only outcomes, so treat these as hypotheses, not findings. Senators serve six-year terms and face re-election less often, which could support longer holding horizons. The Senate is a smaller body with a different mix of wealth and professional money management — most of these trades run through joint and spouse accounts, which often means an adviser is placing them. And a 20-member effective sample means a few disciplined accounts can move the chamber's average in a way that 111 House members dilute. Any of these could explain the gap; none is established by this test, and the honest summary is that the gap exists in the data while its cause is unproven.
What we can and cannot claim
We can claim this: over the last five years, in this dataset, under one pre-registered rule set, disclosed Senate purchases copied after filing beat the S&P 500 over the next 60 trading days on average, and disclosed House purchases did not. The gap between the chambers is unlikely to be pure chance under the pooled test.
We cannot claim that copying Senate trades is a reliable way to make money. The typical trade did not beat the index; the average is tail-driven; the member-level test is inconclusive; the result flips sign in individual years; and costs, taxes and the impossibility of knowing position sizes from range-only disclosures all sit outside the measurement. Our price universe also excludes tickers that left the tracked set, which flatters both chambers equally.
This is the same verdict shape as our earlier tests, and it is why we run them in public. Averages are easy to headline. Distributions are harder to sell — and they are the part that decides what happens to your money.
Senate disclosures are now part of GetCoattail's politician screens, on the same footing as the House. What would change our reading is time: as more senators file and the member count grows, the per-member test that is inconclusive today becomes answerable. We will re-run this exact test on the accumulated record rather than moving the goalposts — same entry rule, same horizons, same benchmark.
Methodology and data
- Sources: U.S. House Clerk Periodic Transaction Reports and U.S. Senate eFD Periodic Transaction Reports, filed 2021-10-01 to 2026-09-30; adjusted daily price bars to 2026-10-02.
- Duplicates: amended filings re-state earlier trades; rows are de-duplicated on member, ticker, type, trade date and amount range (551 House and 278 Senate duplicate purchase rows removed).
- Exclusions, counted: 476 House filings were scanned images that could not be machine-read. 1,271 Senate purchase rows carried no ticker (bonds, funds and other non-stock assets). Of the extracted purchases, 492 Senate and 2,165 House rows had no price history in the 1,634-ticker price set and were not scored; further rows lack a full forward window near the sample end (status per row in the signal file).
- Data files: every extracted purchase with its 30/60/90-day scores and exclusion status (CSV, 10,008 rows).
- Not modelled: trading costs, taxes, and position sizing (impossible from range-only disclosures). Past performance does not predict future results.
Revision history
- v1.0 — October 8, 2026: first publication.