We scored 7,692 short-interest collapses (FINRA 2021–2026). Over the next 60 trading days they trailed the S&P 500 by 6.57 points on average — the print marked the middle of the fall, not the bottom.
Every heavily shorted stock eventually prints the same hopeful chart: short interest, which had climbed for months, suddenly falls off a cliff. The reading is reflexive — the shorts are done. Selling pressure is exhausted, the borrow is coming back, the bottom must be in. If the shorts are leaving, who is left to sell?
It is a clean story, and GameStop made it famous. At the January 15, 2021 settlement, 61.78 million GameStop shares were sold short — 88.58% of every share the company had outstanding. By the April 15, 2021 settlement, that figure had collapsed 82.01%, to 15.89% of shares outstanding. Anyone who bought that collapse print, at the first close after the data was public, earned a 60-trading-day excess return of −0.93 percentage points against the S&P 500. Roughly the index. The next two GameStop collapse signals scored +29.03 and −30.84 points. A coin flip would have been less dramatic and about as informative.
One stock proves nothing either way. So we scored every such print in the modern FINRA record.
How we tested it
FINRA publishes short interest twice a month. Our file covers 137 settlement dates from January 15, 2021 to September 15, 2026 — 2,780,352 rows across every listed issue. The rules were written down before any returns were computed:
- A stock first had to be genuinely shorted: at some settlement within the trailing 12 settlements (about six months), shares sold short reached at least 5% of shares outstanding, using the SEC's point-in-time shares-outstanding history — never today's share count applied to the past.
- The event: by the current settlement, shares short had fallen at least 30% from that peak.
- The control group: stocks on the same settlement date whose peak also cleared 5% but whose short interest had not fallen 30% — still heavily shorted, no collapse.
- Entry: no look-ahead. FINRA publishes seven business days after settlement; we entered later still, at the first close at least 14 calendar days after the settlement date. Returns run 60 trading days (30 and 90 alongside), adjusted prices, measured against SPY over identical windows.
- A ticker could not re-enter either group for six settlements after a signal, so one long unwind counts once, not six times.
That produced 25,739 judgeable ticker-settlements: 7,692 collapse events across 2,425 tickers, and 18,047 controls. 93.2% of events could be scored; the rest are classified, not quietly dropped.
The scoreboard
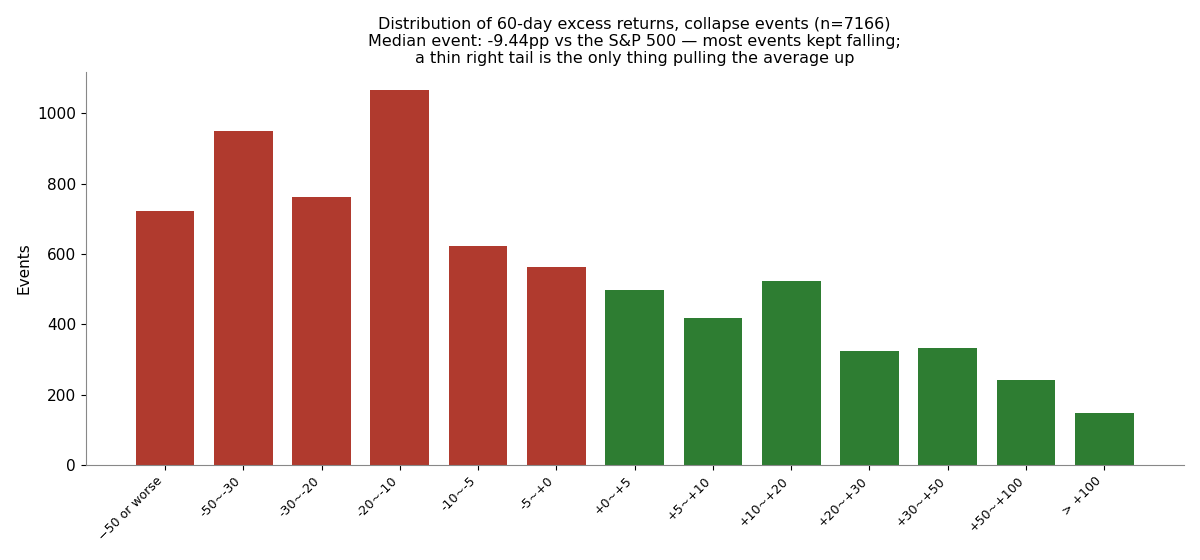
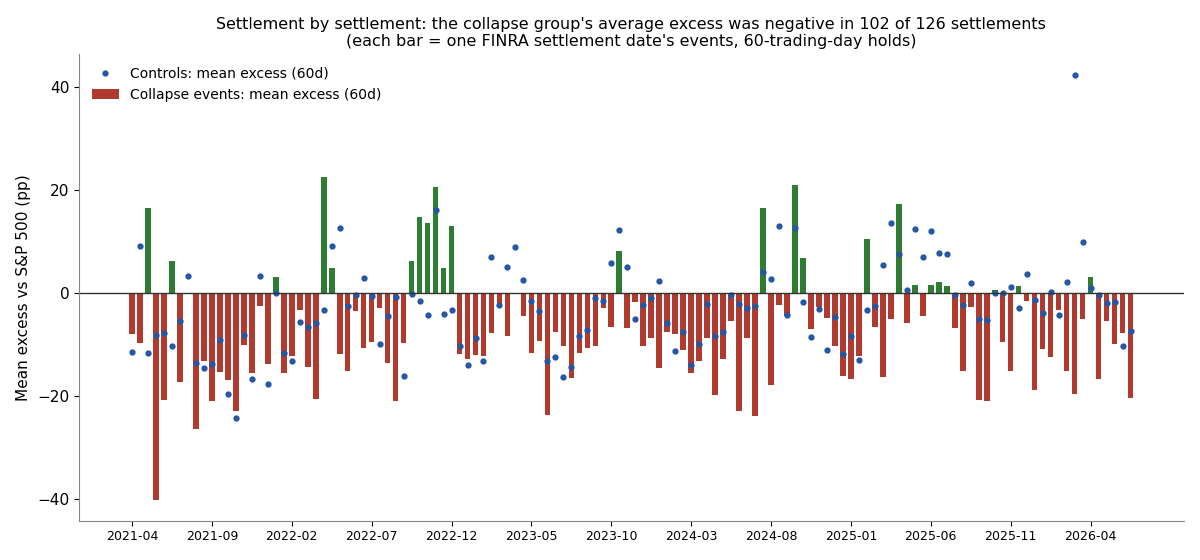
Over the next 60 trading days, the average collapse event returned −3.18% while the S&P 500 returned +3.39% — an average excess of −6.57 percentage points. The median event did worse: −9.44 points against the index. Only 39.8% of events rose at all; only 34.6% beat SPY. Averaged settlement by settlement — the unit we use for inference, because events cluster in time — the excess was −7.58 points (95% CI −9.45 to −5.70, p < 0.001), and that settlement-level average was negative in 102 of 126 settlements.
| Group | Horizon | Measured n | Win rate | Beat SPY | Mean return | SPY | Mean excess | Median excess | Settlement-level 95% CI | Positive settlements |
|---|---|---|---|---|---|---|---|---|---|---|
| Collapse events | 30 days | 7,374 | 42.5% | 38.0% | −0.18% | +1.89% | −2.07%p | −4.78%p | [−4.63, −0.97] | 38/128 |
| Collapse events | 60 days | 7,166 | 39.8% | 34.6% | −3.18% | +3.39% | −6.57%p | −9.44%p | [−9.45, −5.70] | 24/126 |
| Collapse events | 90 days | 6,925 | 39.2% | 32.6% | −3.98% | +4.93% | −8.91%p | −12.58%p | [−11.59, −6.81] | 20/123 |
| Controls — shorts stayed | 30 days | 17,311 | 48.4% | 42.9% | +1.81% | +2.08% | −0.27%p | −2.64%p | [−2.37, +0.01] | 55/128 |
| Controls — shorts stayed | 60 days | 16,607 | 46.3% | 39.9% | +1.91% | +3.64% | −1.73%p | −5.69%p | [−4.21, −1.08] | 39/126 |
| Controls — shorts stayed | 90 days | 15,976 | 46.2% | 38.7% | +2.61% | +5.35% | −2.74%p | −7.93%p | [−5.84, −2.36] | 42/123 |
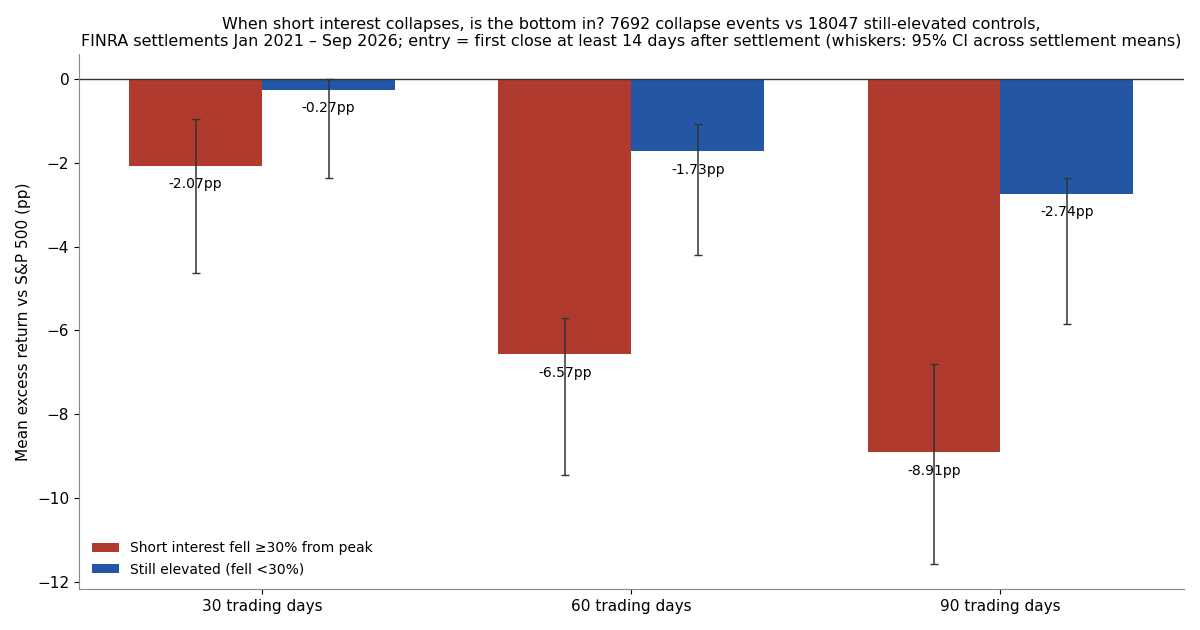
The controls matter, because heavily shorted stocks are usually in trouble for a reason. They lagged too — but by −1.73 points on average. The paired gap between the two groups, settlement by settlement, was −4.93 points (95% CI −6.91 to −2.95, p < 0.001). The collapse was not merely "no signal." The stocks whose shorts left did significantly worse than the stocks whose shorts stayed.
And the damage compounded. At 30 days the event excess was −2.07 points; at 90 days, −8.91 points (settlement level −9.20, CI −11.59 to −6.81). The distribution explains why: the 10th percentile of events lost 50.1 points to the index, the 25th percentile lost 28.1, and the 75th percentile gained just 6.8. The right tail is real — 146 events beat the index by more than 100 points, led by INHD (settlement April 15, 2026; short interest down 53.16% from a 27.90% peak), which returned +1,545.42%. But a tail is not a typical case. The typical case is NRG (April 30, 2025; down 35.68% from a 5.53% peak): −0.90% raw while the index rose 8.55%.
The pattern is also dose-dependent. Loosen the definition to a 20% decline and events averaged −5.11 points; tighten it to 40% and they averaged −8.44 points. The bigger the exodus, the worse the following quarter.
One in ten collapses is partly a mirage
There is a mechanical trap in share counts, and we checked it after the fact, labeled as such. A reverse split shrinks shares short overnight without a single share being covered. 733 events — 9.5% — carried a FINRA stock-split flag sometime between their peak and their signal, and those events averaged a catastrophic −24.06 points. Reverse splits push names into the event group: only 72 controls had a split flag in the same position.
So remove every split-flagged record from both groups and rerun it. The events still averaged −4.86 points; the paired gap was still −3.22 points (95% CI −5.20 to −1.25, p = 0.0016). The artifact inflates the headline. It does not create it.
It survives the obvious objections
The result is not a meme-era leftover. Events averaged −5.82 points in 2021–2023 and −7.14 points in 2024–2026 — even though controls recovered over the same span, from −4.23 points to +0.08. It is not an artifact of our cautious entry date: entering on FINRA's official publication schedule instead gives −6.44 points. It is not a missing-data illusion: with 93.2% of events scored, assigning every price-missing event the bound can reach a −100% return moves the average only to −7.46 points, and assigning them 0% moves it to −6.55.
Why would a collapsing short interest mark continuing decline rather than a bottom? We can offer interpretations, labeled as interpretations, not findings. A falling share count is consistent with shorts banking profits into a decline — covering steadily as a deteriorating company sinks, which is the opposite of capitulation. It is consistent with borrow recalls forcing covers regardless of view. And the 5%-of-shares-outstanding peak requirement selects for companies already in distress, where each successive piece of news can be worse than the last. What the data rules out is the folk reading: across 7,692 instances, the exodus of the shorts was not the all-clear.
What this test cannot see
Shares-outstanding history could be recovered for 4,902 tickers from SEC filings. Most unjudgeable ticker-settlements belong to names with no such history — delisted companies prominent among them — so every number here describes the measurable universe, and a famous graveyard case like Bed Bath & Beyond cannot even be judged by our rules. Short interest is a share count: we cannot separate voluntary covering from recalls, and FINRA's twice-monthly snapshots can miss squeezes that begin and end between settlements. Entry at the close after publication ignores borrow fees, which for these names can be material, and slippage, which for the smallest of them would be worse.
The bottom line
The collapse print is real information. It tells you a crowded short trade has unwound — that a fall has already happened. What it did not do, in five and a half years of biweekly data, is mark the end of the fall. Stocks whose short interest fell 30% or more from a genuinely crowded peak went on to trail the S&P 500 by 6.57 points over the next 60 trading days, did worse than peers whose shorts stayed put, and did worst of all when the collapse was largest. The shorts leaving was not the bottom signal. On this evidence, it was closer to a progress report on the decline.
Methodology and data
Data: FINRA short interest (settlements Jan 2021–Sep 2026), SEC shares-outstanding history, Yahoo Finance adjusted prices. All 25,739 signals with their scores are published with this article as a CSV (signals_short_covering.csv). This is a data study, not investment advice.
Revision history
- v1.0 — October 10, 2026: first publication.
- v1.1 — October 10, 2026: pre-publication corrections from independent verification (two figures corrected; see the package verification log).