Across 16,130 Form 4 events (2021–2026), insider clusters averaged −1.02 points of excess vs the S&P 500 over 60 days; isolated single buys averaged +0.36. The gap's interval includes zero.
One insider buying is a data point. Three insiders buying the same stock within a few weeks of each other feels like a story — the people who know the company best, reaching for their own wallets at the same time. That feeling has a price tag attached in the financial press, where "insider cluster buying" is routinely sold as one of the strongest signals in the filings. So we took the full Form 4 record — two corpora covering filings from January 2021 through October 2026, 134,746 insider-days of open-market purchases — and asked whether the story survives scoring.
The test
What counts as a cluster. An insider-day is one insider buying on one day at one issuer (multiple purchase rows that day count once). A cluster event fires the moment a third distinct insider at the same issuer has bought within a rolling 90-calendar-day window. The comparison group is the isolated single: an insider-day with no other insider buying at that issuer within 90 days on either side, counted once per insider per 90-day episode. Only open-market purchases (transaction code P, non-derivative) count; grants, exercises and gifts do not.
When you could act. A cluster is only knowable when the third buyer's Form 4 is filed. Entry is therefore the close on the first trading day after that filing date — never the trade date itself. The headline hold is 60 trading days (30 and 90 reported alongside), returns use dividend- and split-adjusted closes, and every event is scored as excess return versus the S&P 500 over the same window. Amendments (Form 4/A) replace the filings they amend in the 2021–2024 corpus; in the 2025–2026 corpus, where amendment links are not parsed, amendments are excluded and originals only are used. That rule touched 4.03% of purchase rows in the first corpus and 2.19% in the second. Events whose third (or single) buy traded between April 1, 2021 and June 30, 2026 qualify: 6,301 clusters and 9,829 isolated singles. We could measure 4,568 clusters (72.5%) and 7,552 singles (76.8%) at 60 days; the rest are classified in the methodology box below.
Result: the cluster added nothing — the point estimate is negative
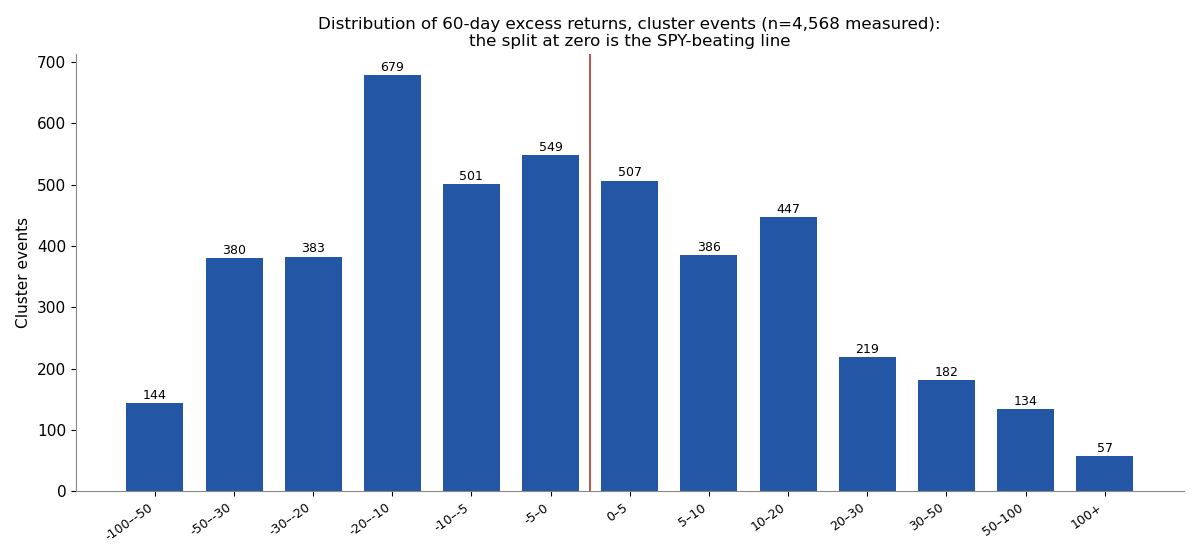
Cluster events averaged +2.61% over 60 days and won 51.1% of the time. That sounds fine until the benchmark is put next to it: SPY averaged +3.63% over the same windows. Mean excess: −1.02 points (95% CI −2.04 to +0.01, event-level t, p = 0.052). The median cluster trailed the index by 3.07 points, and only 42.3% of clusters beat SPY at all.
| Group | Horizon | Measured n | Win rate | Beat SPY | Mean excess | Median excess | 95% CI of mean excess | p |
|---|---|---|---|---|---|---|---|---|
| Cluster (3+ insiders) | 30 days | 4,571 | 50.6% | 44.9% | +0.08%p | −1.48%p | [−0.72, +0.89] | 0.841 |
| Cluster (3+ insiders) | 60 days | 4,568 | 51.1% | 42.3% | −1.02%p | −3.07%p | [−2.04, +0.01] | 0.052 |
| Cluster (3+ insiders) | 90 days | 4,489 | 50.8% | 40.1% | −1.90%p | −4.65%p | [−3.28, −0.53] | 0.007 |
| Isolated single buy | 30 days | 7,556 | 51.5% | 45.3% | +0.03%p | −1.13%p | [−0.76, +0.82] | 0.946 |
| Isolated single buy | 60 days | 7,552 | 52.6% | 43.0% | +0.36%p | −2.52%p | [−1.41, +2.12] | 0.692 |
| Isolated single buy | 90 days | 7,369 | 52.0% | 41.1% | +0.08%p | −4.02%p | [−1.95, +2.10] | 0.942 |
Cluster minus single (Welch): +0.06 points at 30 days, −1.37 at 60 days (95% CI −3.41 to +0.67, p = 0.187), −1.98 at 90 days — every interval includes zero.
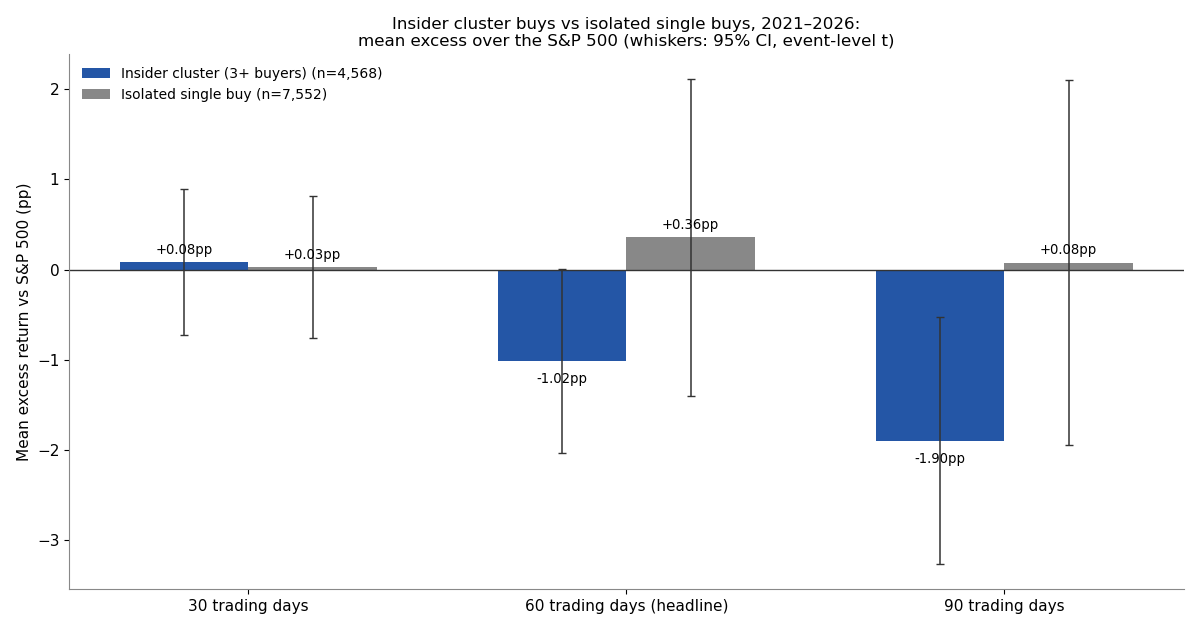
The lone buyers did no better in absolute terms — and that is the comparison that matters. Isolated singles averaged +4.04%, an excess of +0.36 points (CI −1.41 to +2.12, p = 0.69), with a median excess of −2.52 points and a 43.0% SPY-beating rate. The difference between the two groups is −1.37 points (Welch 95% CI −3.41 to +0.67, p = 0.19). That interval includes zero, so by our own rules the honest sentence is narrow: in 16,130 scored events, there is no evidence that a cluster beat a lone buyer. The direction of the point estimate — clusters behind — is the opposite of the story being sold.
Both groups share the same shape, and it is worth seeing. The average winner gained about +22% in both groups (clusters +22.4%, singles +23.9%); the average loser lost −18.0% in both. The best cluster in the sample, Cabaletta Bio (third buy October 18, 2022), returned +726.9% against SPY's +8.4%. The worst, Avalo Therapeutics (June 2023), lost −97.2%. The typical cluster — the median event — was a First Trust fund (FTHY, March 2022) drifting −6.7% in a −3.6% tape. Averages in this data are written by tails like Cabaletta; the typical event in either group slightly trailed the market.
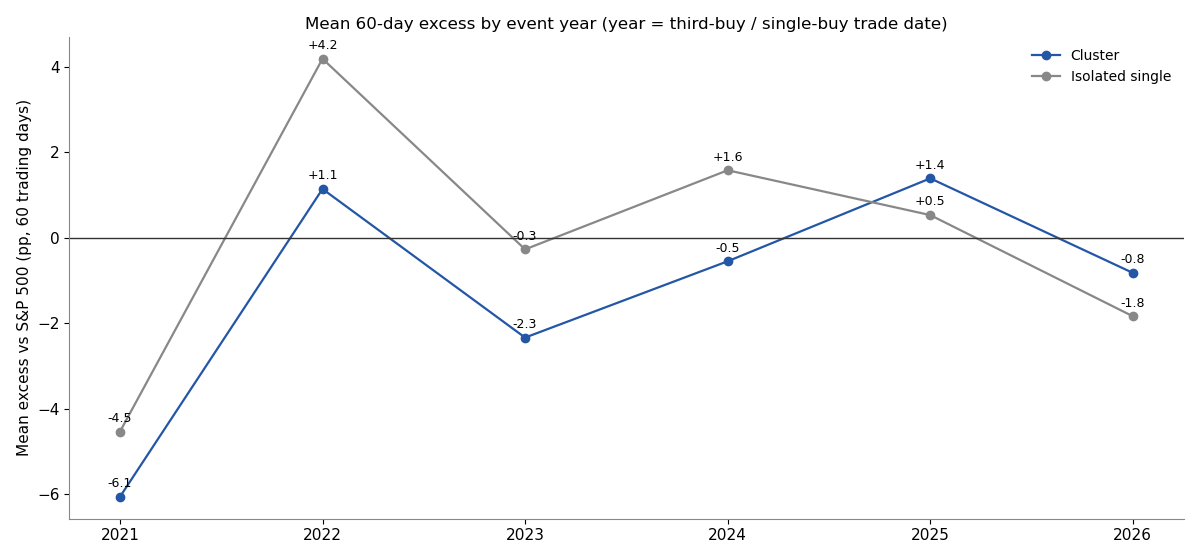
By year, clusters finished ahead of the singles in only two of six years — 2025 (+1.39 points of excess versus +0.53) and 2026 (−0.82 versus −1.84, a year both groups trailed). The worst cluster year was the first: −6.07 points of excess in 2021 (measured n = 621), when singles also trailed (−4.54). Whatever clusters were signalling in the post-COVID tape, it was not defence.
Does the result survive its own checks?
Three checks, pre-registered. (1) A stricter cluster. Raising the threshold to four distinct insiders produces 3,984 events (2,856 measured) with a mean excess of −1.67 points (CI −2.94 to −0.40, p = 0.010 against SPY) and a gap to the singles of −2.03 points (CI −4.20 to +0.15, p = 0.067). More agreement among insiders did not help. (2) Horizons. At 30 days the cluster-minus-single gap is +0.06 points (p = 0.92); at 90 days it is −1.98 points (CI −4.43 to +0.47, p = 0.11). Clusters on their own trailed SPY significantly at 90 days (−1.90 points, CI −3.28 to −0.53, p = 0.007, same event-level t method). No horizon shows a cluster advantage. (3) Size. Splitting cluster events by the reported 13F value of their issuer in the event quarter (a market-cap proxy, not market cap itself) gives −0.33 points in the smallest covered third (n = 702), −0.39 in the middle (n = 459) and +0.03 in the largest (n = 285); dropping the largest third leaves −0.35 points among covered names. Most cluster events — 4,605 of 6,301 (73.1%) — sit at issuers no 13F filer reported that quarter, and that uncovered bucket averaged −1.30 points (n = 2,912 measured). There is no size corner where the cluster premium is hiding. One caveat on this check: the 13F values for 2021Q3–2022Q3 in our merged record failed an integrity audit, so the size split for events in those quarters is indicative only.
What this test cannot see
Start with the missing quarter of the sample. Of 6,301 cluster events, 1,733 could not be measured — 1,572 because no price series survives at all, 156 because there is no price on or before the entry date, and 5 because the holding window runs past the price record. The missing names are disproportionately delisted, merged-away and over-the-counter issuers: exactly the bad endings. That flatters both groups' measured returns, and it flatters clusters slightly more, because clusters were measured at a lower rate (72.5% versus 76.8%). The bias therefore works against the null result above, not for it — the true cluster average is unlikely to be better than the one we printed. Second, this is a test of open-market purchases only, in U.S. Form 4 filings, entered at the next close after disclosure with no trading costs or taxes modelled; in the small, thin names where most clusters occur, real entry prices would be worse than the close we assumed. Third, an insider-day built from several filings uses the earliest filing date among them, and a cluster is dated by its third buyer — a cluster whose third buyer filed late is entered late, by construction. Finally, the 2025–2026 corpus cannot link amendments to originals, so a small number of corrected trades there are scored as originally filed (amendments were 2.19% of its purchase rows).
How to read a cluster headline now
When a screen or a newsletter tells you three insiders just bought, the filing itself is still worth opening — who bought, how much, and whether the buys are open-market purchases or scheduled plan trades are facts. What this test removes is the shortcut from "several insiders bought" to "the stock tends to beat the market next." Across 2021–2026 it did not: clusters matched the index at best, trailed a lone buyer on the point estimate, and trailed by more the stricter the cluster definition became. On GetCoattail's pages, treat a cluster the way we treat a crowd in 13F data — as a census of who showed up, not as a forecast. The full signal file, every cluster and single with its score wherever a price history survives, is published with this piece. Judge by the track record.
Methodology and data
Sources: SEC Form 4 filings, two corpora (2021–2024 acquisition CSV, 745,918 filings; 2025–2026 full parse, 316,796 filings), joined on accession number. Signal: non-derivative open-market purchases (code P), grouped into insider-days; cluster = third distinct insider within a rolling 90-day window at one issuer, confirmed on that buyer's filing date, with a 90-day suppression after each event; control = insider-day with no other insider within ±90 days, one per insider per episode. Entry = close on the first SPY trading day after the confirmation filing; headline hold 60 trading days; dividend/split-adjusted closes; SPY benchmark and trading calendar. Full signal file: signals_insider_clusters.csv (16,130 events, scored wherever a price history survives). Trading costs and taxes are not reflected. Past patterns are not a promise of future results. For education only. Not investment advice.
Revision history
- v1.0 — October 10, 2026: first publication. Data as of 2026-10-10.