We ranked every 13F stock by how many filers held it — 45,178 stock-quarters, 2016–2021. The most crowded decile trailed the S&P 500 slightly. The neglected tail averaged ahead, where 23% can't be measured at all.
Our earlier tests asked what happened to the stocks that 81 tracked funds piled into. The obvious objection: 81 funds is a curated club. What about everybody? Form 13F covers every institution above $100M — 5,651 distinct filers reported holdings for 2016Q3, and 7,547 for 2021Q2. Apple was held by 2,244 of them in 2016Q3; by 2021Q2, Microsoft was held by 3,859. So we took the merged market-wide 13F record and asked the population version of the question: if you had bought whatever the crowd already owned — or whatever the crowd was rushing into — once the filings were public, would you have beaten the S&P 500?
The test
Groups. Each quarter from 2016Q3 to 2021Q2, we took every ticker in the market-wide 13F aggregation — 1,946 tickers in the first quarter, 2,704 in the last — and cut three deciles by filer count. Crowd: the 10% of tickers held by the most filers (at least 644 filers in 2016Q3; at least 887 by 2021Q2). Surge: the 10% whose filer count grew most that quarter (at least +22 filers, rising to +39). Neglected: the 10% held by the fewest filers (57 or fewer in 2016Q3; 61 or fewer by the end). Each group holds 4,524 stock-quarters. As a control, we also computed the median stock in the same universe each quarter.
Entry and scoring. A 13F is public at most 45 days after quarter-end. Entry is the close on the first trading day after that deadline, the headline hold is 60 trading days (30 and 90 reported alongside), returns use dividend- and split-adjusted closes, and every pick is scored as excess return versus the S&P 500 over the same window. Costs and taxes are not modelled — a caveat that matters most for the neglected group, as we will see. In total we scored 45,178 stock-quarters; 37,145 (82.2%) could be measured. The measurement rate itself is a result: 95.6% for the crowd, 87.7% for the surge, and only 76.8% for the neglected — the names we could not price are overwhelmingly tickers whose price series no longer exists.
Result 1: the crowd was a census, not a signal
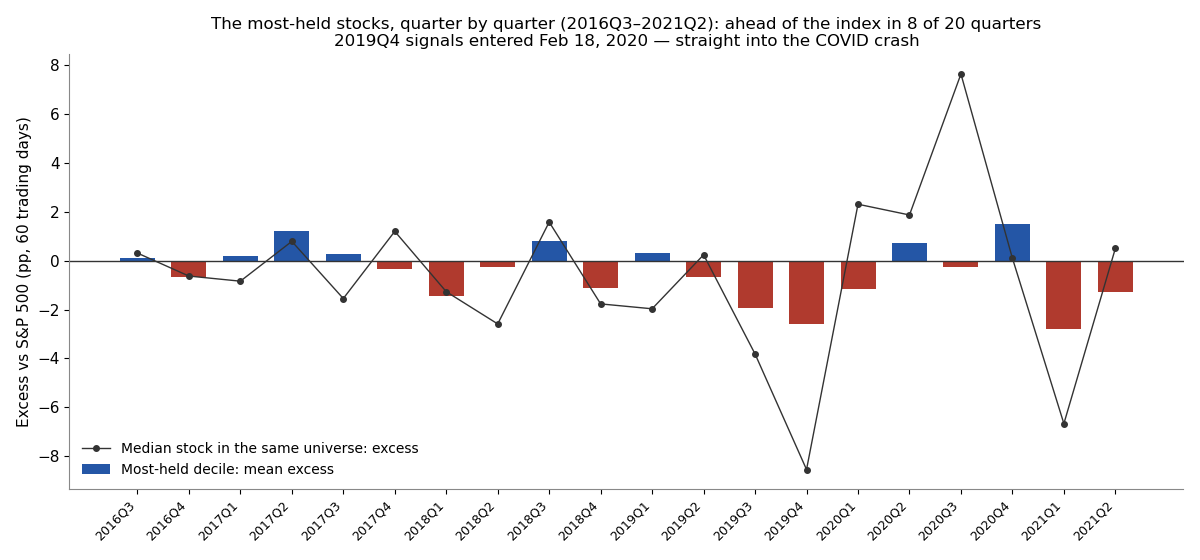
The most-held decile returned +3.52% on average over 60 days and won 65.2% of the time — and still trailed, because SPY averaged +4.03% over the same windows. Mean excess: −0.51 points (95% CI across quarterly means −1.03 to +0.08, p = 0.09). The median crowded pick trailed the index by 0.65 points, only 46.4% of picks beat it, and the group's quarterly average was positive in just 8 of 20 quarters. This is not a mega-cap artifact: removing each quarter's five largest reported positions and re-running the selection changes the answer to −0.56 points. Nor were crowded stocks worse than ordinary ones — against the median stock in the same quarter, the difference is +0.18 points with an interval from −1.15 to +1.51. The crowd simply was the market, minus a little.
| Group (60 trading days) | Picks measured | Win rate | Beat SPY | Mean return | SPY | Mean excess | Median excess | 95% CI of mean excess | Positive quarters |
|---|---|---|---|---|---|---|---|---|---|
| Crowd — most-held decile | 4,324 | 65.2% | 46.4% | +3.52% | +4.03% | −0.51%p | −0.65%p | [−1.03, +0.08] | 8/20 |
| Surge — fastest filer-count growth | 3,968 | 62.1% | 48.1% | +4.80% | +3.88% | +0.92%p | −0.37%p | [−1.54, +3.42] | 12/20 |
| Neglected — fewest filers | 3,476 | 59.7% | 46.2% | +8.18% | +3.96% | +4.22%p | −0.92%p | [−0.49, +8.76] | 12/20 |
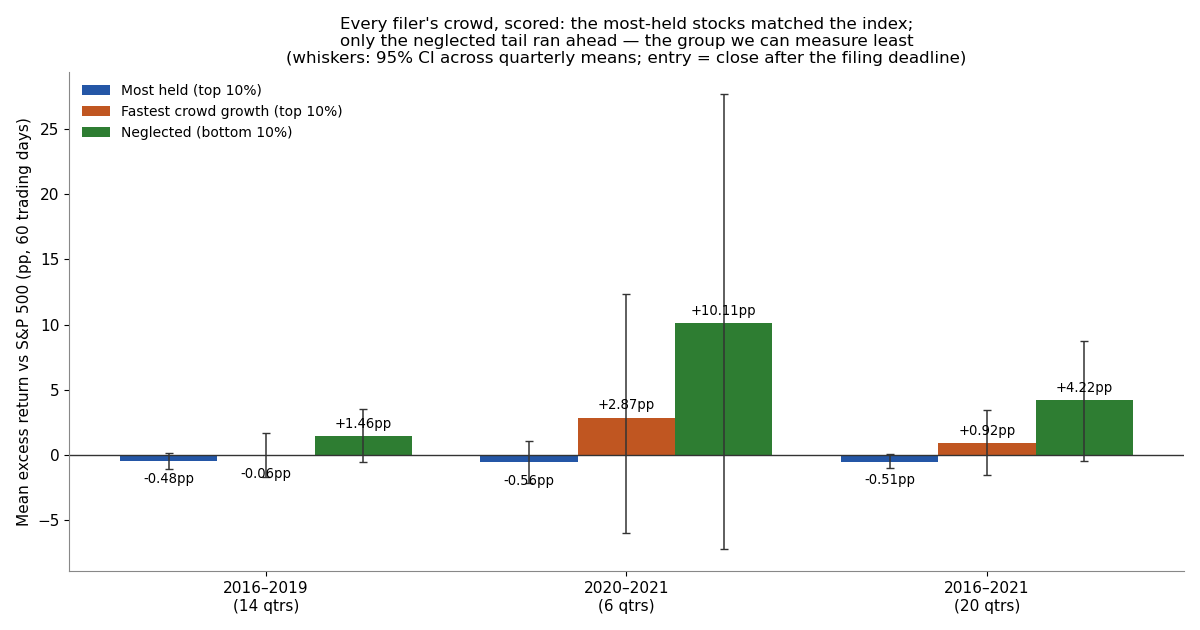
Widening the lens changed nothing. Our earlier 81-fund study found the 30 most-held names among tracked funds at +0.21 points (CI −0.86 to +1.28 — an interval that includes zero, so no evidence of an edge there either). Counting all 7,000-plus filers instead of 81 lands in the same place: popularity is not a signal, at any scale we can measure.
Result 2: the rush in was noise with good stories
Stocks whose holder count surged averaged +4.80%, an excess of +0.92 points — but the interval is wide (−1.54 to +3.42, p = 0.44), the median surging stock trailed the index (−0.37 points), and fewer than half (48.1%) beat it. Split by era there is nothing to hold on to: −0.06 points in 2016–2019, +2.87 in 2020–2021 with an interval from −5.99 to +12.31. The group's best quarter shows why the average misleads: 2020Q3 surgers, bought on November 17, 2020, averaged +26.2% (excess +16.9 points, n = 211) — one violent window doing the work of twenty quiet ones. Following the rush meant Magnite (+416.5% in that same quarter, after its filer count jumped by 164) — and it also meant USA Today Co., which went from zero filers to 212 in a single quarter (2019Q4) right before it fell −83.9% into the COVID window. The typical case was neither: Simpson Manufacturing, +3.2% in a +1.1% tape.
Result 3: the neglected tail — a premium we cannot certify
The bottom decile is the one place the averages move. Neglected stocks averaged +8.18% against SPY's +3.96% — an excess of +4.22 points — and they beat the median stock in the same quarters by +4.79 points (CI +1.16 to +8.42, p = 0.012), ahead in 16 of 20 quarters, in both eras (+2.87 points versus the median stock in 2016–2019 alone, p = 0.007). At 30 and 90 days, the excess over SPY itself is +2.53 and +5.81 points, with quarterly intervals that exclude zero (p = 0.02 and p = 0.01).
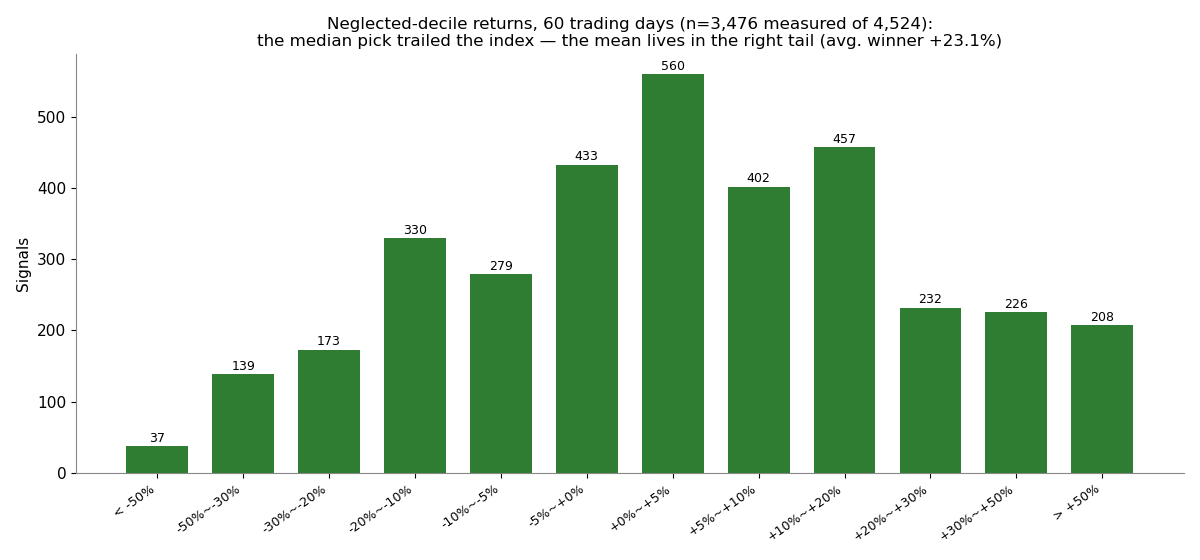
Now the discipline. At the headline 60-day horizon, the quarterly interval for the SPY comparison still includes zero (−0.49 to +8.76, p = 0.08). The median neglected pick trailed the index by 0.92 points; only 46.2% beat it. The mean is carried by a thin right tail — the average winner gained +23.1%, 208 of 3,476 measured picks (6.0%) rose 50% or more, topped by Riot Platforms at +877.8% on a base of 50 filers. And this is the group where the data is worst: 1,048 of 4,524 picks (23.2%) could not be measured at all, 1,033 of them because no price series survives. Delisted and vanished companies are exactly the ones missing, and they do not go missing at random — they are disproportionately the disasters. As an arithmetic bound, not an estimate: if every unmeasured pick had gone to zero, the group's mean excess would be −20.9 points instead of +4.2. The truth is somewhere between, and the honest label for the neglected premium is a lead — the most interesting one in this study, and the one we would least want to certify. These are also names held by a few dozen filers at most, where entering at the close, cost-free, is a courtesy real portfolios do not get.
In the crisis window, neither end of the popularity scale protected anyone: 2019Q4 signals entered February 18, 2020, and the crowd averaged −18.5% (excess −2.6 points, win rate 10.2%) while the neglected averaged −18.6% (excess −2.7 points). Being everyone's stock and being nobody's stock lost the same way that quarter.
Does the result survive its own checks?
Five checks, pre-registered. (1) Horizons: crowd −0.05 points at 30 days, −0.62 at 90; surge +0.81 and +0.69, all intervals including zero; neglected +2.53 and +5.81 as above. (2) Eras: no group's sign is stable across 2016–2019 and 2020–2021 except the neglected, which is positive in both. (3) Mega-cap removal: all three answers essentially unchanged. (4) Quarter-equal weighting: same conclusions as event weighting. (5) Excluding stale exit prices: no change — the crowd and neglected groups contain no stale exits at all, the surge one. The crowd's zero is robust. The neglected premium is robust to everything except the one thing we cannot fix: the missing fifth of its own sample.
Cases mark the crowd's range. Its best pick was Tesla in 2020Q1 (+91.1% against SPY's +14.9%; 1,064 filers); its worst were the COVID-window industrials — Delta Air Lines −66.7% and Boeing −64.2% on the same February 2020 entry. The median crowded pick was Zimmer Biomet in 2016Q4: +3.6% in a +2.2% tape, held by 767 filers. Owning what everyone owns mostly means owning the tape.
What this test cannot see
The universe is the tickers the filings could be mapped to — 54.5% of holder pairs in 2016Q3, rising to 63.5% by 2021Q2 (74.7% to 86.7% by reported value); unmapped securities are outside the test entirely. Tickers double-count share classes (Alphabet's two classes are separate rows), and roughly 12% of crowd picks are funds themselves by name — index ETFs are among the most-held "stocks" in America, which is part of what "crowded" means here. The window stops at 2021Q2: the market-wide record for 2021Q3–2025Q4 is still being backfilled, so this study says nothing about the post-2021 market. Prices come from series resolvable today, which — as the neglected group shows — flatters any group whose losers disappear. And a 13F remains what it always was: long positions only, up to 45 days late, from managers above $100M.
How to read a holder count now
A holder count answers "how many institutions report this name" — a fact about reporting, not about prospects. On our pages, treat the most-held lists as a census: useful for knowing what the market owns, silent on what happens next, at least across the 20 quarters and 45,178 stock-quarters scored here. And when a screen shows you an eye-catching average from the neglected end of the market, ask the two questions this study could not answer for its own best result: what did the median pick do, and how many picks are missing? The full signal file — every group, every quarter, scores attached — is published with this piece, and the live version of the popularity test sits on the Track Record, next to the decade-long re-score in our previous study. Judge by the track record.
Methodology and data
Sources: SEC Form 13F Data Sets, market-wide merged record (quarterly by-ticker aggregations; 5,651 distinct filers for 2016Q3 rising to 7,547 for 2021Q2). Groups: per-quarter deciles of reported filer counts — most-held (top 10%), fastest filer-count growth (top 10%), fewest filers (bottom 10%) — over the ticker-mapped universe (1,946–2,704 tickers per quarter). Entry = close on the first trading day after the 45-day filing deadline; headline hold 60 trading days; returns from dividend/split-adjusted closes; SPY benchmark and trading calendar. Full signal file: signals_crowding.csv (11,648 group picks, with scores wherever a price history survives). Trading costs and taxes are not reflected. Past patterns are not a promise of future results. For education only — not investment advice.
Revision history
- v1.0 — October 10, 2026: first publication. Data as of 2026-10-09.