We rebuilt five earlier years of 13F signals (2016–2021) with the same rules as our live track record. Heavy Accumulation won 65% of the time and still only matched the S&P 500. A decade, one answer.
Our track record page carries an uncomfortable result: Heavy Accumulation — the signal that fires when three or more of the 81 funds we track raise their weight in the same stock in the same quarter — wins 56% of the time and still trails the S&P 500. The obvious objection is that the test only covers 2021–2026: a rate shock, a bear market, a rotation out of the crowded names these funds own. Maybe the signal worked fine in the years before and the era is the problem.
So we rebuilt the earlier years. This summer we merged a ten-year backfill of Form 13F filings (2016Q3–2021Q2) from the SEC's own datasets. For this test we extracted the historical holdings of the same 81 tracked funds from the preserved raw filings, rebuilt both of our headline signals exactly as the live site computes them, and scored them under identical rules. Before trusting the extension, we re-ran the recent period through the same code: it reproduced the published track record to the last decimal (2,936 signals; excess −0.43 points) and matched the site's BEST top-30 lists in all 19 quarters, 30 for 30. The ruler is the same. Only the years are new.
The test
Signals. Heavy Accumulation: in a quarter, at least three tracked funds increased the stock's portfolio weight versus the prior quarter (values rebuilt as reported shares × quarter-end unadjusted close; brand-new positions do not count — the same boundary as the live computation). BEST top 30: the 30 keys held by the most tracked funds that quarter, ties broken by the number of funds adding. One disclosure about our own house: the site's English description of Heavy Accumulation says "share count increased by 20% or more," but the computation that actually produces the track record is the weight-increase rule above. The code is what we tested, and the description text needs fixing — flagged here rather than quietly harmonized.
Entry and scoring. A 13F is public at most 45 days after quarter-end. Entry is the close on the first trading day after that deadline — the first price at which every filing behind the signal was public. Headline hold is 60 trading days; we also report 30 and 90 days and the track record's own convention (exit at the next quarter's deadline). Returns use dividend- and split-adjusted closes, and every signal is scored as excess return versus the S&P 500 (SPY) over the same window. Costs and taxes are not modelled.
Sample. 2,567 Heavy Accumulation signals across 20 quarters (2016Q3–2021Q2), every one measurable, covering 404 distinct tickers; 600 BEST slots, 589 measurable. The funds filing in any given quarter ranged from 62 to 77 of the 81 — younger funds simply did not exist yet.
Result 1: a higher win rate, the same zero
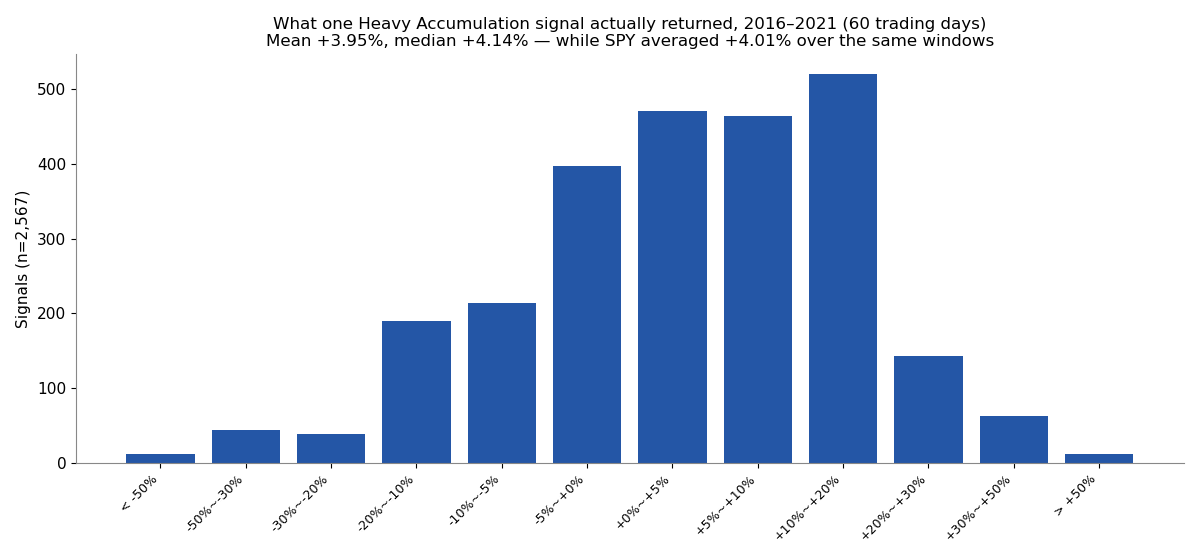
In 2016–2021 the signals felt much better. Heavy Accumulation won 65.1% of the time (versus 54.6% in 2021–2026 on the same 60-day ruler), the average signal returned +3.95%, and the median returned +4.14%. But SPY averaged +4.01% over those same windows — the earlier era was simply a stronger tape. The mean excess was −0.06 points, the median excess was exactly 0.00, and the share of signals that beat the index was 50.0% — a coin flip, precisely. The 95% confidence interval on the quarterly mean excess runs from −0.96 to +0.83 points (p = 0.88). By the standard we apply to everything on this site, that is no evidence of an edge.
The distribution is wide in both directions: the average winner gained +11.0%, the average loser dropped −9.3%, the top decile started at +18.3% and the bottom decile at −10.7%. There was plenty of money in the tails. There was none in the middle, which is where a copier actually lives.
Result 2: the most-held 30 did no better
The BEST list — the 30 most widely held names each quarter — averaged +4.17% over 60 days in 2016–2021, against SPY's +3.96%: an excess of +0.21 points, with a confidence interval from −0.86 to +1.28 (p = 0.69). Its win rate was 68.6%, but only 51.8% of its picks beat the index, and its average excess was positive in just 9 of 20 quarters (the recent period: 8 of 19). Popularity, measured with a five-year head start, is still not a signal.
| Era | Quarters | Signals | Win rate | Beat SPY | Mean | Median | SPY | Excess | 95% CI of excess |
|---|---|---|---|---|---|---|---|---|---|
| 2016–2019 | 14 | 409 | 63.6% | 52.8% | +2.22% | +3.71% | +2.31% | -0.09%p | [-1.09%p, +0.93%p] |
| 2020–2021 | 6 | 180 | 80.0% | 49.4% | +8.58% | +7.25% | +7.69% | +0.88%p | [-2.61%p, +4.38%p] |
| 2016–2021 (all) | 20 | 589 | 68.6% | 51.8% | +4.17% | +5.01% | +3.96% | +0.21%p | [-0.86%p, +1.28%p] |
| 2021–2026 (recomputed) | 19 | 570 | 60.2% | 47.9% | +2.37% | +2.34% | +2.41% | -0.04%p | [-1.20%p, +1.11%p] |
Result 3: the era changed; the answer didn't
Split the earlier window and the pattern holds. In 2016–2019, Heavy Accumulation's excess was −0.42 points (1,766 signals). In the pandemic window, 2020–2021, it was +0.72 points on 801 signals — the best sub-period anywhere in the decade, and still statistically indistinguishable from zero (CI −1.57 to +2.93). Note the trap inside that "good" era: the win rate hit 73.7%, yet fewer than half the signals — 49.3% — beat the index. The average was carried by a few very large winners in a violent rebound, not by typical trades.
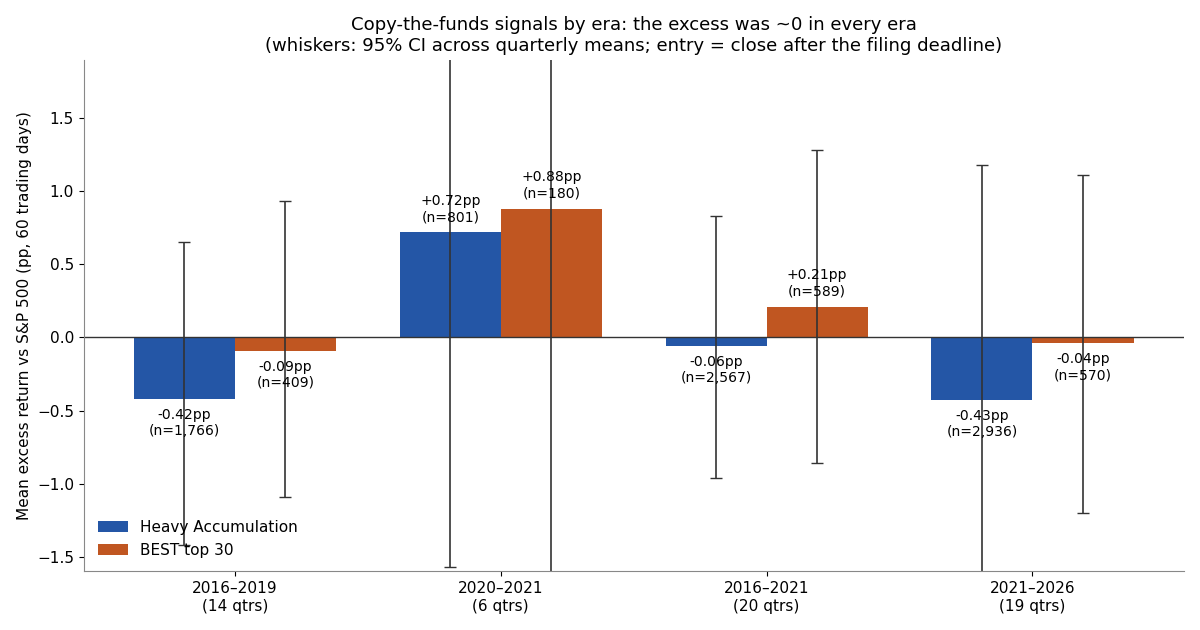
| Era | Quarters | Signals | Win rate | Beat SPY | Mean | Median | SPY | Excess | 95% CI of excess |
|---|---|---|---|---|---|---|---|---|---|
| 2016–2019 | 14 | 1,766 | 61.3% | 50.3% | +1.90% | +2.80% | +2.32% | -0.42%p | [-1.42%p, +0.65%p] |
| 2020–2021 | 6 | 801 | 73.7% | 49.3% | +8.46% | +7.24% | +7.74% | +0.72%p | [-1.57%p, +2.93%p] |
| 2016–2021 (all) | 20 | 2,567 | 65.1% | 50.0% | +3.95% | +4.14% | +4.01% | -0.06%p | [-0.96%p, +0.83%p] |
| 2021–2026 (recomputed) | 19 | 2,936 | 54.6% | 45.1% | +2.06% | +1.45% | +2.49% | -0.43%p | [-2.01%p, +1.18%p] |
The crisis quarter shows what these portfolios are made of. Signals from 2019Q4 entered on February 18, 2020, straight into the COVID crash: Heavy Accumulation averaged −20.9% over the next 60 trading days against SPY's −15.9% (excess −5.0 points, win rate 12.1%); the BEST 30 averaged −19.6% and won 3.3% of the time. And across the full decade, in windows where SPY fell, Heavy Accumulation signals trailed the index by −2.89 points on average (238 signals), versus +0.22 in rising windows — consistent with a high-beta tilt in what tracked funds accumulate, though we tested outcomes, not causes, so treat that as a hypothesis. The 2018 selloff, incidentally, mostly misses these windows: because entry waits for the filing deadline, the December 2018 drawdown lands inside the holding windows of 2018Q3 signals, which still finished +1.23 points ahead — timing artifacts like this are why every quarterly table in the data file prints its actual holding window.
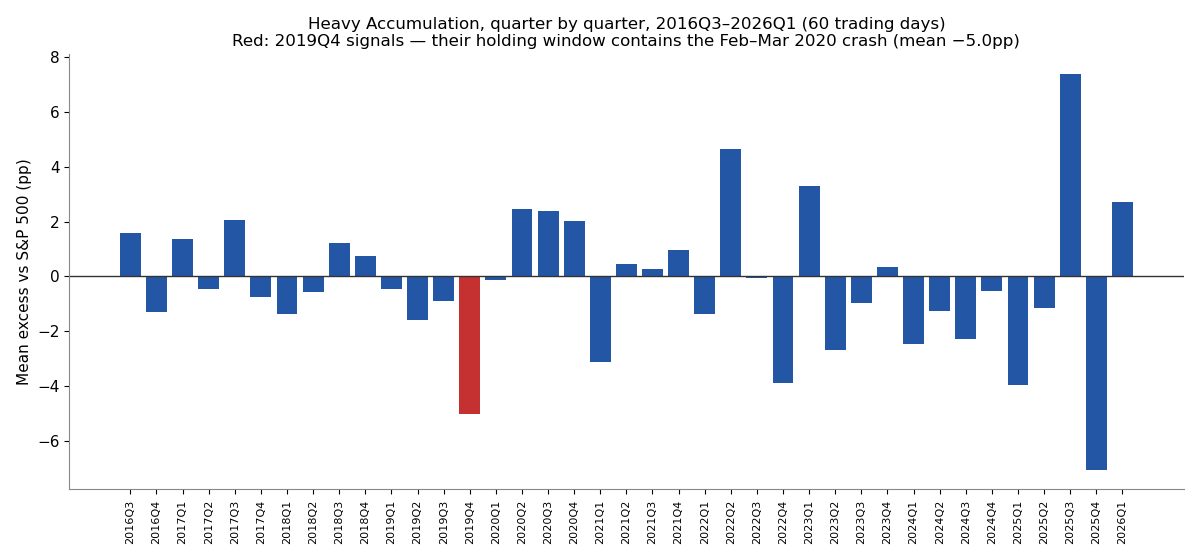
Stack all 39 quarters together and the decade reads: Heavy Accumulation, 5,503 signals, excess −0.26 points (CI −1.10 to +0.62, p = 0.58); BEST top 30, 1,159 scored picks, excess +0.09 points (CI −0.66 to +0.84, p = 0.82). Ten years, two crises, one answer.
Does the result survive its own checks?
Five checks, pre-registered. (1) Shorter and longer holds: −0.25 points at 30 days, −0.12 at 90. (2) The track record's own exit convention instead of 60 days: +0.03. (3) Dropping the three COVID-whipsaw quarters entirely: +0.06. (4) Weighting quarters equally instead of signals: −0.07. (5) Excluding the single signal whose exit price was stale (a delisting): unchanged. BEST behaves the same way (−0.40 to +0.33 across its checks). No specification finds an edge, and none finds a meaningful deficit either — the honest description is that these signals tracked the index with extra variance.
Individual cases mark the range. The best Heavy Accumulation signal of the era was Baidu in 2020Q3 (+126.7% in 60 days; five funds had raised their weight), followed by Carvana and Sea Limited in the post-crash rebound (+96.0% and +82.7%). The worst was New Oriental Education in 2021Q1 (−83.1% while SPY rose +8.4%), then Sabre and Cenovus inside the COVID window (−72.8% and −60.1%). The typical signal — the median — was Accenture in 2017Q1: +4.14%, in a window where SPY returned +2.0%. For every Baidu there is an EDU, and the median copier got neither.
What this test cannot see
Two layers of survivorship sit inside the sample, and both lean the same way. The fund list is today's tracked roster applied backwards — funds that later closed or fell off the list are absent, which flatters the past. And prices come from tickers resolvable today: when a company is delisted and its series disappears, its signals tend to disappear with it. The clearest fingerprints are the 11 BEST slots we could not score at all — every one an old CUSIP of a renamed or restructured company (Priceline Group, the pre-merger United Technologies, DowDuPont). Value reconstruction is also approximate: 13F dollar values in that era were mostly reported in thousands, so weights are rebuilt from shares × quarter-end prices rather than taken from the filings, and about a fifth of historical positions have no resolvable price and drop out of the weight math entirely, exactly as in the live pipeline. Finally, a 13F shows long positions in U.S.-listed securities only, up to 45 days late, from managers above $100M — the signal was always a delayed shadow of the real book.
None of these caveats rescue the signal. They mostly bias the backtest upward, and it still lands on zero.
How to read the track record now
The 2021–2026 result was not a bad-era artifact. Following the crowd of tracked funds — by accumulation or by popularity — matched the S&P 500 across a decade that included a trade war, a pandemic crash and the fastest rebound on record, and the matching was not a strategy: it came with fatter tails, deeper drawdowns in falling markets, and a win rate that rose and fell with the index itself. On our own pages, that is exactly what the Track Record is for: the signals are published with their scores attached, decade included. Judge by the track record.
Methodology and data
Sources: SEC Form 13F Data Sets quarterly files (2016Q3–2021Q3 submission windows), preserved raw archives; fund cohort = the 81 CIK-identified funds in GetCoattail's tracked roster (of 83 tracked names), 62–77 filing per quarter. Filing selection: latest filing per fund per period, amendments preferred, notice filings excluded — the pipeline's canonical rule, verified to reproduce the merged dataset's filing sets exactly. Prices: Yahoo daily bars (dividend/split-adjusted for returns; unadjusted quarter-end closes for weight reconstruction), SPY as benchmark and trading calendar. Full signal files with per-signal scores: signals_s1.csv (5,503 signals) and signals_best.csv (1,170 slots, 1,159 scored). Trading costs and taxes are not reflected. Past patterns are not a promise of future results. For education only — not investment advice.
Revision history
- v1 — October 9, 2026: first published version. Data as of 2026-10-09.