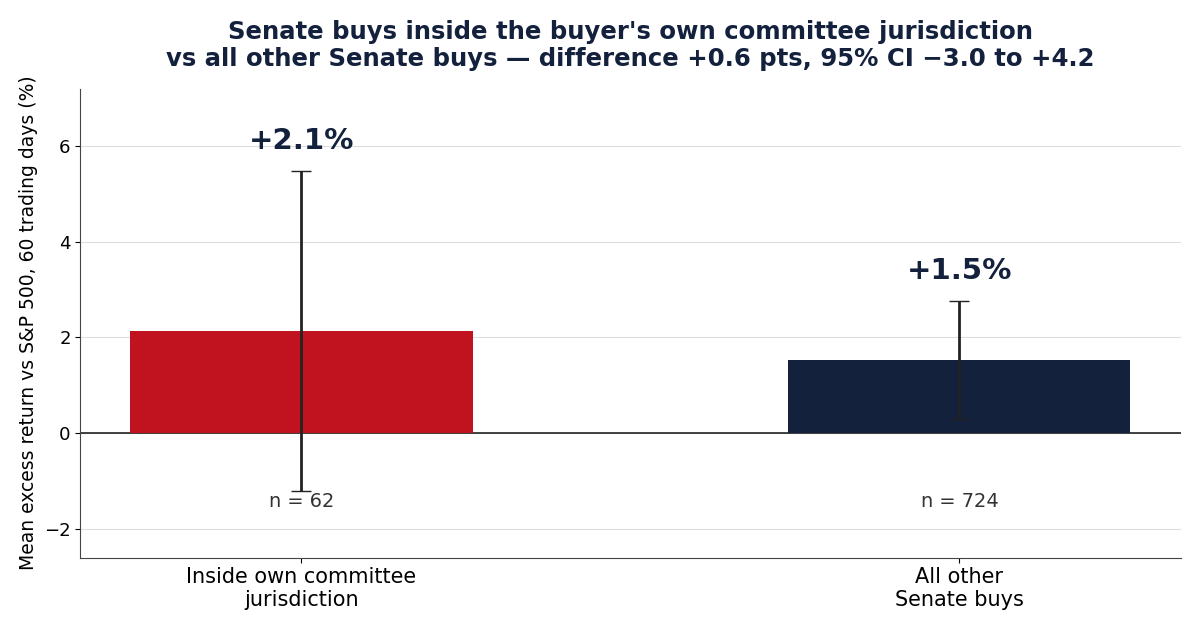
We scored 817 disclosed Senate buys and flagged the 62 inside the buyer's own committee jurisdiction: they averaged +2.1% vs +1.5% for the rest — a +0.6-point gap indistinguishable from zero.
Our previous test in this series produced a puzzle. Copied after disclosure and held for 60 trading days, Senate purchases beat the S&P 500 by +1.46% on average, while House purchases went nowhere. That left two obvious questions. Which senators actually produced the Senate's average? And is the popular explanation — senators trading stocks that their own committees oversee — where the number comes from?
This time we scored the senators individually, and we flagged every purchase that landed inside the buyer's own committee jurisdiction. The method, including the committee mapping, was fixed before we ran it.
The test
Population and scoring are identical to the Senate–House test: every purchase on a Senate Periodic Transaction Report filed between October 1, 2021 and September 30, 2026, duplicates from amended filings removed, entered at the close on the first trading day after filing, held 60 trading days (30 and 90 reported alongside), scored as excess return versus the S&P 500. That leaves 817 scored purchases by 20 senators. We re-ran the earlier pipeline on the current data file first: it reproduces the published Senate numbers exactly.
The scorecard rule. A senator gets an individual row only with at least 10 scored purchases. Thirteen qualify. The other seven — 19 purchases between them — are reported as a group and not ranked.
The overlap rule, deliberately narrow. Committee assignments come from the public congress-legislators dataset built on Senate records, matched to the Congress (117th, 118th or 119th) in which each trade occurred. A purchase counts as overlap only if the stock's industry, classified by the SEC's own SIC code for the issuer, falls under a committee the senator sat on at the time — and we mapped only four committees whose jurisdiction is specific enough to mean something: Banking → financials; Energy and Natural Resources → oil, gas and refining; Health, Education, Labor and Pensions (HELP) → drugs, medical devices and health services; Armed Services → aircraft, missiles, ships and defense instruments. Broader committees (Commerce, Finance, Appropriations and the rest) were not mapped at all: their jurisdiction covers so much of the economy that calling a trade "inside" it would be unfalsifiable. Of the 817 scored purchases, 786 could be classified; the 31 that could not were all purchases of index or sector ETFs, which have no single industry. 62 purchases — 7.9% — were overlap.
Result 1: the scorecard
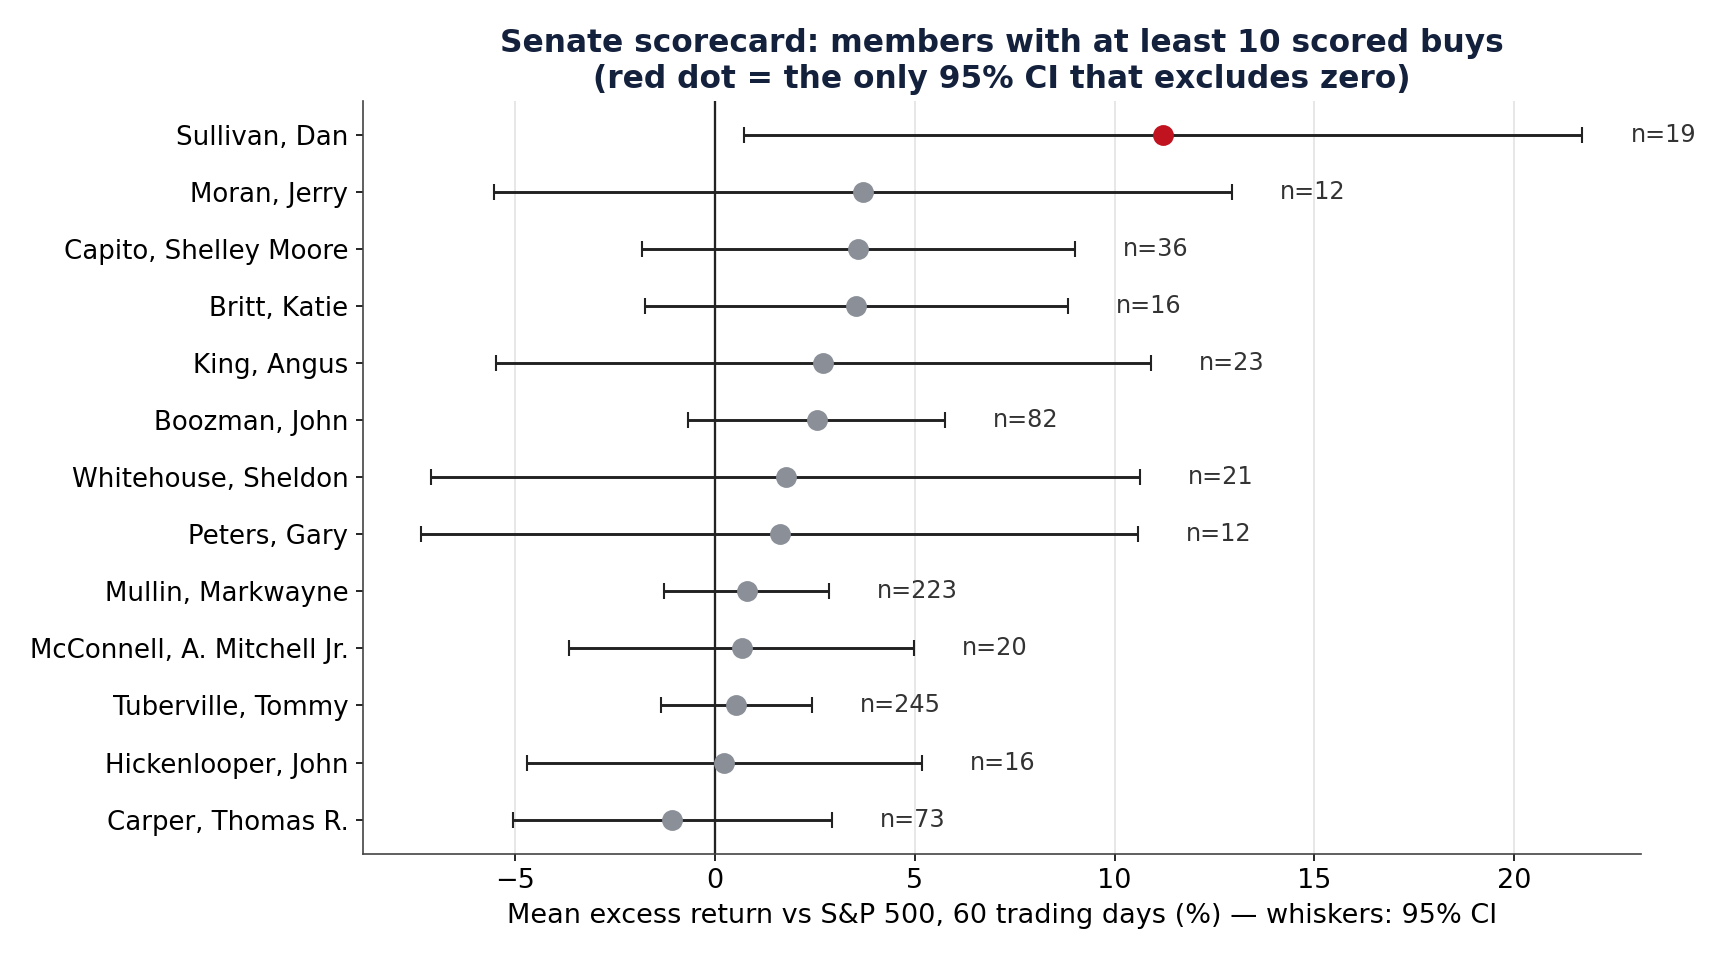
The top of the table is Dan Sullivan of Alaska: 19 scored purchases averaging +11.22% excess over 60 days, median +7.66%, 68% of them beating the index. His is the only one of the 13 confidence intervals that excludes zero (+0.73% to +21.71%) — and with 13 members on the board, chance alone would produce roughly one such interval, so read the red dot as "the leader in this sample," not a crown. Much of Sullivan's average is timing: a batch of purchases disclosed on December 21, 2022 — entered the next trading day, after a brutal year for growth stocks — included Nvidia (+69.2% excess) and Meta (+67.2%).
Behind him, the averages compress fast: Jerry Moran +3.71% (12 purchases), Shelley Moore Capito +3.59% (36), Katie Britt +3.54% (16), Angus King +2.71% (23), John Boozman +2.54% (82), Sheldon Whitehouse +1.77% (21), Gary Peters +1.62% (12) — every one of those intervals crosses zero. At the bottom sits Thomas Carper at −1.07% across 73 purchases, also statistically indistinguishable from zero.
The two names that dominate the Senate tape are in the middle. Tommy Tuberville, the most prolific filer with 245 scored purchases, averaged +0.53% (CI −1.36% to +2.42%). Markwayne Mullin, with 223, averaged +0.80% (CI −1.27% to +2.86%). Volume is not performance: together they supplied 57% of the Senate's signals and, per trade, landed almost exactly on the index.
| Senator | Buys scored | Mean excess | Median | Beat SPY | 95% CI of mean |
|---|---|---|---|---|---|
| Dan Sullivan | 19 | +11.22% | +7.66% | 68.4% | [+0.73, +21.71] |
| Jerry Moran | 12 | +3.71% | −1.49% | 41.7% | [−5.53, +12.94] |
| Shelley Moore Capito | 36 | +3.59% | +3.04% | 55.6% | [−1.84, +9.01] |
| Katie Britt | 16 | +3.54% | +2.97% | 68.8% | [−1.75, +8.83] |
| Angus King | 23 | +2.71% | −2.78% | 47.8% | [−5.49, +10.91] |
| John Boozman | 82 | +2.54% | +0.01% | 50.0% | [−0.67, +5.76] |
| Sheldon Whitehouse | 21 | +1.77% | −0.14% | 47.6% | [−7.10, +10.63] |
| Gary Peters | 12 | +1.62% | +0.11% | 50.0% | [−7.36, +10.59] |
| Markwayne Mullin | 223 | +0.80% | +0.02% | 50.7% | [−1.27, +2.86] |
| A. Mitchell Jr. McConnell | 20 | +0.67% | −0.05% | 50.0% | [−3.65, +4.98] |
| Tommy Tuberville | 245 | +0.53% | −1.38% | 46.1% | [−1.36, +2.42] |
| John Hickenlooper | 16 | +0.23% | +2.88% | 62.5% | [−4.71, +5.17] |
| Thomas R. Carper | 73 | −1.07% | −3.31% | 45.2% | [−5.07, +2.93] |
Result 2: the committee-overlap test
If committee oversight conferred an informational edge, it should show up here. It does not.
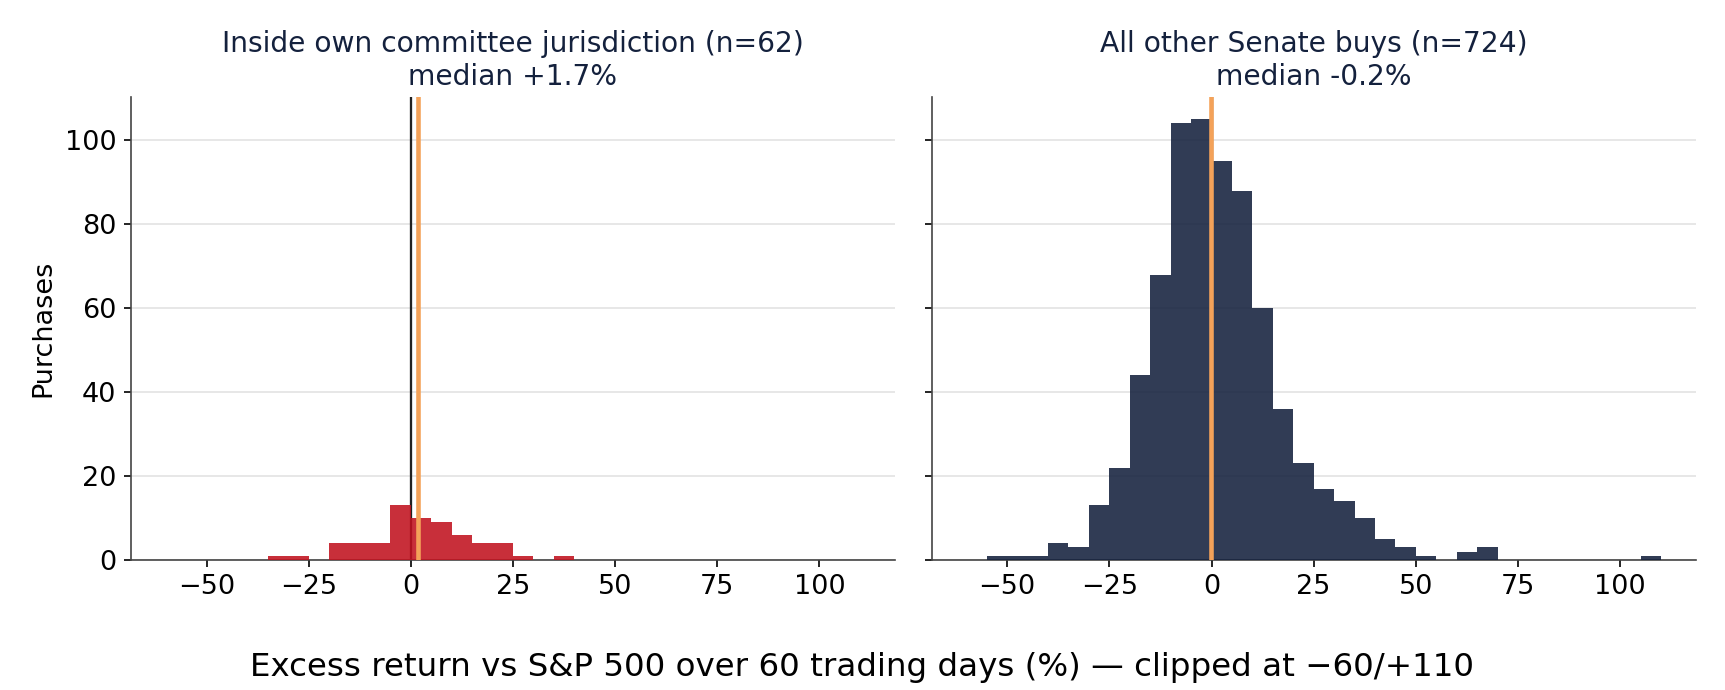
The 62 overlap purchases averaged +2.14% over 60 days (95% CI −1.22% to +5.49%), with a median of +1.69% and 56.5% beating the index. The 724 other classifiable purchases averaged +1.53% (CI +0.29% to +2.77%), median −0.15%, 49.4% beating the index. The difference is +0.61 percentage points, with a 95% confidence interval of −2.95 to +4.17 — comfortably including zero. By the standard we apply to our own screens, that is not a result; it is no evidence of an edge.
| 60 trading days after filing | Buys scored | Mean excess | Median | Beat SPY | 95% CI of mean |
|---|---|---|---|---|---|
| Inside own committee jurisdiction | 62 | +2.14% | +1.69% | 56.5% | [−1.22, +5.49] |
| All other classifiable Senate buys | 724 | +1.53% | −0.15% | 49.4% | [+0.29, +2.77] |
Difference between the groups: +0.61 percentage points (Welch 95% CI −2.95 to +4.17). 786 of the 817 scored purchases could be classified; the 31 that could not were index or sector ETF purchases.
Every robustness check lands in the same place. At 30 days the overlap group actually trails (−0.72 points, CI −3.13 to +1.68); at 90 days it leads by +1.30 (CI −3.40 to +6.00). Weighting each senator equally instead of each trade shrinks the gap to +0.29 points. Re-classifying every trade with end-of-Congress rosters instead of start-of-Congress rosters changes not one trade's status. And by Congress, the sign flips: +1.43 points in the 117th, +2.85 in the 118th, −4.82 in the 119th.
Result 3: what the overlap bucket actually contains
The overlap sample is smaller and narrower than the phrase "senators trading their committees' stocks" suggests. All 62 trades come from just seven senators, and 52 of the 62 come from two: Tuberville (28) and Mullin (24). Forty-seven of the 62 are health-care stocks bought by members of the HELP Committee; defense adds 10, banking 4, and energy exactly 1. Remove Tuberville and Mullin and the overlap sample is 10 trades averaging +5.31% — against +2.89% for the rest — with a confidence interval so wide (−4.62 to +9.47 for the difference) that it says almost nothing.
The two extreme overlap trades make the point concretely. Both are Mullin's, both health care, both in a joint account: an Eli Lilly purchase that gained +38.01% after disclosure, and a Boston Scientific purchase that lost −34.30%. The same committee, the same account type, opposite tails. And one more quiet fact: none of the 43 purchases made in a senator's own name were overlap trades. Every overlap purchase sat in a spouse's account (10) or a joint account (52) — the accounts most likely to be run with an adviser.
For calibration, the extremes of the full sample sit outside the overlap bucket entirely. The best scored purchase — John Fetterman's Micron buy, +159.79%, in a dependent child's account — is a semiconductor stock no mapped committee covers. The worst — a Mullin purchase of Sprouts Farmers Market, −50.98%, traded in January 2024 and disclosed 19 months later — is a grocer. The median scored purchase of the entire study is, fittingly, a Mullin Chevron trade at −0.03%: an energy stock, but Mullin never sat on the Energy Committee, so it counts as non-overlap. Jurisdiction is about the member's seat, not the stock's sector alone.
What we can and cannot claim
We can claim this: in five years of disclosed Senate purchases, the trades that fell inside the buyer's own committee jurisdiction — under a deliberately narrow, published mapping — did not measurably outperform the trades that didn't. The observed gap is +0.6 points and cannot be distinguished from zero by any variant of the test we pre-registered. We can also claim the scorecard as a description of this sample: one senator's average clearly above the pack, the two most prolific traders at index level, and nobody else's record separable from luck at these sample sizes.
We cannot claim that committee knowledge is worthless in general. The test is narrow by design: four committees, one industry classification, 62 trades concentrated in two members and one sector. A broader mapping — counting Commerce or Finance as "covering" technology or health care — would manufacture a bigger overlap bucket and a murkier question. Our price universe, built from currently tracked tickers, flatters all groups in the same direction, as in the earlier tests. Disclosed amounts are ranges, so positions cannot be sized; costs are not modelled; and committee rosters are snapshots at the start and end of each Congress, so a mid-Congress switch between those dates would be missed (the two snapshots agree on all 786 classifications, which bounds how much this can matter here).
The story that senators profit by trading what they oversee is plausible, repeated often, and — in the only version of it we could define tightly enough to test — not visible in the record. What would change our reading is the same as before: more senators filing, more trades classified, and time. We will re-run this exact test as the record grows, same mapping, same entry rule, same benchmark.
Methodology and data
Data: U.S. Senate eFD Periodic Transaction Reports filed 2021-10-01 to 2026-09-30; committee rosters from the public congress-legislators dataset (Senate records) for the 117th–119th Congresses; issuer industries from SEC SIC codes; prices are adjusted daily closes to 2026-10-02. The full signal file — signals_senate_scorecard.csv, all 4,631 extracted purchases with scores, industries, committee assignments and overlap flags — is published with this article. For education only — not investment advice.
Revision history
- v1.0 — October 9, 2026: first publication.