GetCoattail Research — we ranked Senate stock trading and holdings. The leaderboards do not agree.
Tommy Tuberville reported 866 stock trades — more than any other senator, and first place on every way of adding up the money. His most recent annual financial disclosure, the document that lists what a senator owns rather than what they traded, puts his individual stocks at a minimum of $855,030 — 12th among 94 senators. The holdings crown belongs to Pete Ricketts — 25 trades in five-plus years, all sales. And the largest single line items in any annual report — "Over $50,000,000" — are not stocks at all. Two documents, three leaderboards, three different names on top.
Why there are two rankings at all
Senators disclose their finances in two streams. Periodic Transaction Reports (PTRs) record individual trades, filed within 45 days of each transaction. Annual financial disclosures record what the household owned at year-end. Both report amounts only as value brackets — "$15,001 – $50,000," never an exact figure. We ranked both streams in full: every stock trade in the 706 PTRs filed by 56 senators (January 2021–October 2026), and the listed-stock holdings in CY2025 annual reports from 94 of the 100 sitting senators.
Headlines usually grab whichever number is larger. But "trades a lot" and "owns a lot" are different claims, from different documents, failing in different ways. We stress-tested the trading ranking.
How we built the trading ranking
Population. Every PTR in the Senate eFD system filed from January 2021 through October 2026: 706 filings from 56 senators — 47 current, 9 former — matched to the Senate roster as of October 5, 2026. 21 of them are amendments re-stating an earlier report, counted once, at the latest version (685 reports). Trade dates run February 7, 2020 to September 11, 2026.
What counts. Transactions the forms label as stock: 4,246 — 2,194 purchases, 2,021 sales (full or partial). Another 31 stock rows are "Exchange" entries — corporate actions, not trades — excluded from every dollar total.
The bracket problem. Every amount is a range, so no senator has a single trading total. We computed each total three ways — floors, midpoints, ceilings — and ranked all 56 filers on each. The headline ranking uses midpoints, ranges printed beside every figure; the full three-basis table is published with this article.
Result 1: one senator laps the field
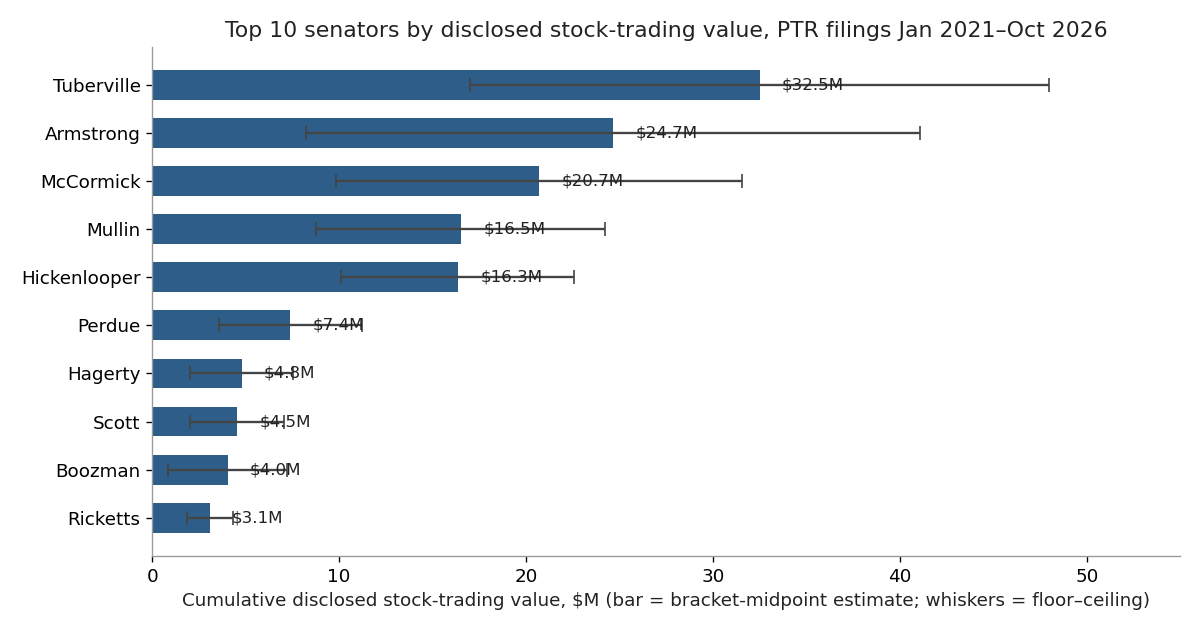
| # | Senator | Status | Stock trades | Buys | Sells | Total, midpoint est. | Total range (floor–ceiling) |
|---|---|---|---|---|---|---|---|
| 1 | Tuberville, Tommy | current | 866 | 375 | 491 | $32,501,433 | $17,022,866 – $47,980,000 |
| 2 | Armstrong, Alan | current | 704 | 654 | 49 | $24,659,352 | $8,248,703 – $41,070,000 |
| 3 | McCormick, David H. | current | 84 | 80 | 4 | $20,698,042 | $9,831,084 – $31,565,000 |
| 4 | Mullin, Markwayne | former | 410 | 287 | 123 | $16,512,705 | $8,775,410 – $24,250,000 |
| 5 | Hickenlooper, John | current | 123 | 38 | 83 | $16,345,560 | $10,126,121 – $22,565,000 |
| 6 | Perdue, David | former | 262 | 50 | 212 | $7,398,131 | $3,556,262 – $11,240,000 |
| 7 | Hagerty, Bill | current | 34 | 4 | 27 | $4,785,016 | $2,020,031 – $7,550,000 |
| 8 | Scott, Rick | current | 6 | 0 | 6 | $4,524,003 | $2,003,006 – $7,045,000 |
| 9 | Boozman, John | current | 414 | 218 | 196 | $4,034,207 | $848,414 – $7,220,000 |
| 10 | Ricketts, Pete | current | 25 | 0 | 25 | $3,075,012 | $1,850,025 – $4,300,000 |
Top 10 of 56 filers, ranked by cumulative disclosed stock purchases plus sales (midpoint basis). "Stock trades" counts all stock-typed rows; 31 of the 4,246 such rows market-wide are corporate-action exchanges, excluded from every dollar total. Filings: Senate eFD PTRs filed Jan 2021–Oct 2026; trades dated Feb 2020–Sep 2026.
Tuberville is first on all four measures — trade count, and floor, midpoint and ceiling totals: 866 trades (375 buys, 491 sells) across 276 tickers, in 49 PTRs, worth between $17.0 million (floors) and $48.0 million (ceilings), a full 162 trades clear of the next filer.
Result 2: "senators trade a lot" is mostly five senators
Across all 56 filers, disclosed stock trading sums to $157.8 million (midpoint basis). The top five account for 70.2% of it; the top ten, for 85.3%. Tuberville alone is 20.6%.
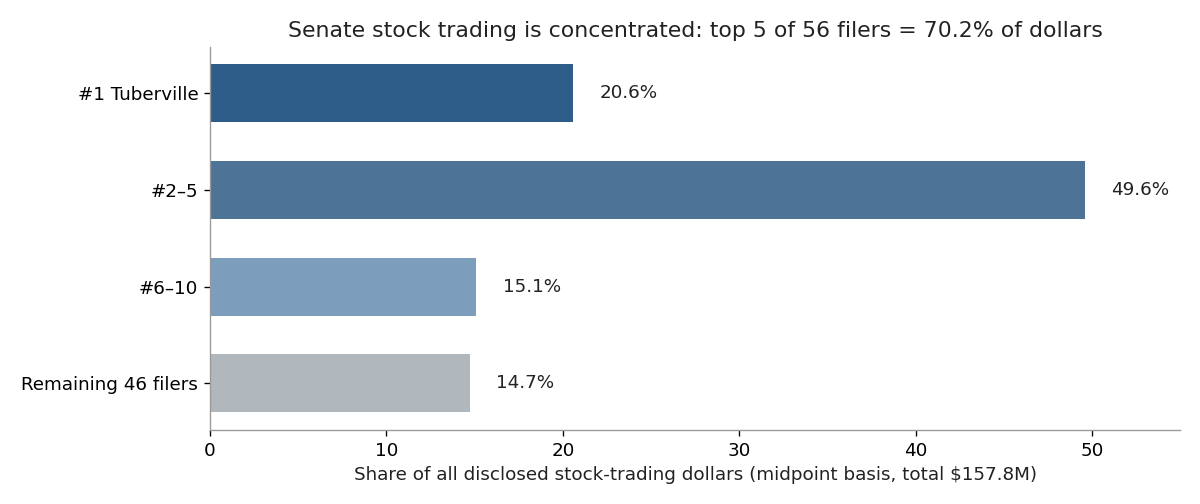
The typical filer is nowhere near the top: the median senator reported about $199,756 of stock trading, and 13 of the 56 filers report no stock purchases or sales at all. The image of a hundred senators actively trading is wrong twice over.
Result 3: a rank is a range, not a position
Rebuild the ranking on floors or ceilings alone and the cast barely changes: 8 senators are top-10 on all three bases, only 12 on any basis.
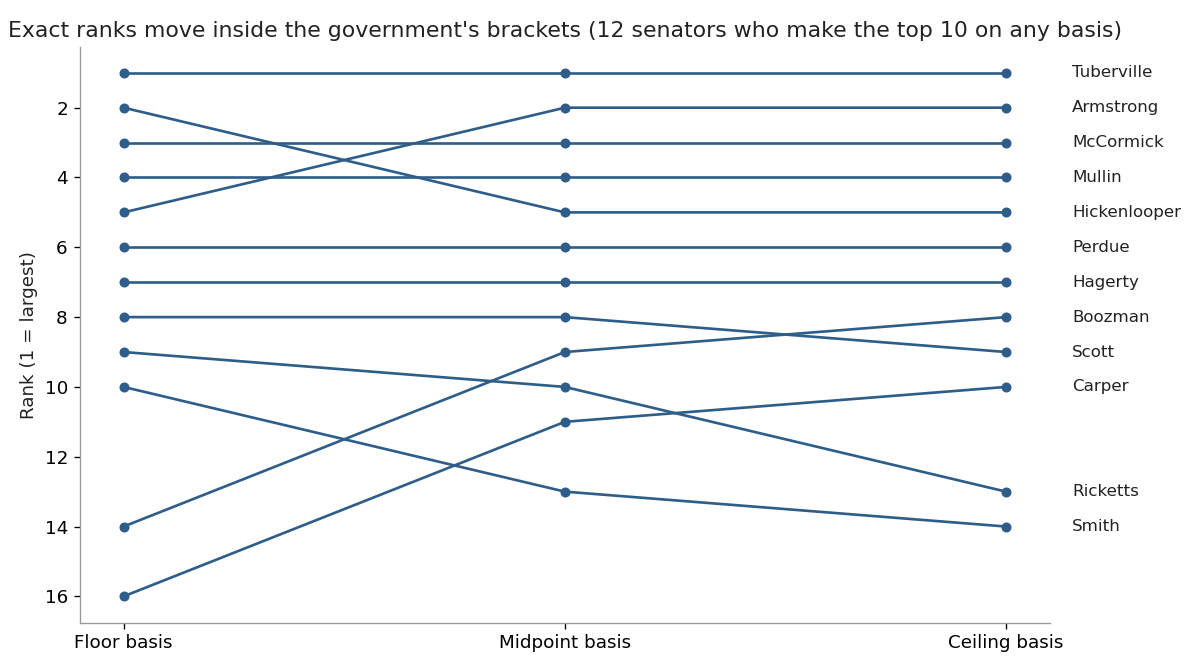
Exactly where they sit is not. Boozman is 14th on floors, 9th on midpoints and 8th on ceilings; Armstrong is 5th on floors and 2nd on the other two; Hickenlooper is 2nd on floors and 5th on midpoints. Armstrong's range alone runs $8.2 million to $41.1 million — a fivefold spread. Where the range is wider than the distance to the next name, the precise rank is an artefact of bracket arithmetic.
Result 4: trades and dollars tell different stories
Count the trades and you get one leaderboard; add up the dollars, another. Rick Scott filed six stock transactions — all sales — yet ranks 8th by dollars (midpoint $4.5 million) and 28th by count, because his trades sit in huge brackets. McCormick is the mirror image: 84 trades in four tickers, 80 of them purchases — 3rd by dollars, 12th by count.
The extreme case is Jacky Rosen: nine stock rows, 26th by count — every one an Exchange entry, corporate actions such as the GE-to-GE HealthCare separation, with $0 of purchases or sales. By dollars she is 54th of 56. A "most active traders" list that does not name its yardstick has not finished defining its terms.
Three records that are not what the ranking suggests
Armstrong's No. 2 is a five-month event. All 704 of his trades fall between March 24 and August 14, 2026, packed into two PTR documents: 654 purchases averaging roughly $11,700 (midpoint) against 49 sales averaging roughly $347,000 — $7.7 million bought against $17.0 million sold. The shape is a portfolio rearranged after arriving in office, not a trading habit; without that context, "the Senate's No. 2 trader" misleads.
Perdue's No. 6 is a ghost of 2020. David Perdue's 262 trades all sit between February 7 and April 16, 2020 — about ten weeks, all in a joint account. He and Mullin, the two former senators in the top ten, are flagged in the table rather than dropped. For sitting senators only, the top five is Tuberville, Armstrong, McCormick, Hickenlooper and Hagerty.
Hagerty's No. 7 is one-directional. Of Hagerty's $4.8 million midpoint total, purchases are $56,502 — four purchases against 27 sales.
The other document: what senators actually hold
Everything above is flow. The annual financial disclosure is the stock: a year-end snapshot of what the household owned, in the same wide brackets. We collected the most recent reports (calendar year 2025, filed in 2026, latest amendments): 94 of 100 sitting senators filed electronic reports; we classified all 5,286 asset rows in them. Four filed their final version on paper: Blumenthal, Durbin, Cantwell, Wyden. Two more, Armstrong and Graham, were seated in 2026 and owe no CY2025 report yet: the trading table's No. 2 has no holdings document at all.
We counted only listed individual stocks, identified by asset name; the form's own "stock" label is not used, because it files bond ETFs and index funds as stock. Funds and ETFs (2,477 rows), bonds, private stakes, real estate and cash were classified separately; open-ended "Over $…" rows are excluded from every sum. The metric is the sum of bracket floors — the least the stocks can be worth.
| # | Senator | Listed-stock floor | Ceiling | Positions |
|---|---|---|---|---|
| 1 | Ricketts, Pete | $55,001,004 | $125,015,000 | 5 |
| 2 | Whitehouse, Sheldon | $7,674,092 | $22,772,000 | 104 |
| 3 | Smith, Tina | $2,465,023 | $5,278,000 | 26 |
| 4 | Peters, Gary C. | $1,933,072 | $5,128,000 | 80 |
| 5 | Collins, Susan M. | $1,602,047 | $4,230,000 | 47 |
| 6 | Britt, Katie Boyd | $1,257,018 | $5,832,000 | 20 |
| 7 | Hickenlooper, John W. | $1,097,021 | $2,612,000 | 29 |
| 8 (tie) | Cruz, Ted | $1,000,001 | $5,000,000 | 1 |
| 8 (tie) | Scott, Rick | $1,000,001 | $5,000,000 | 3 |
| 8 (tie) | Sullivan, Dan | $1,000,001 | $5,000,000 | 1 |
Listed-stock holdings, CY2025 annual reports (filed 2026, latest versions), 94 of 100 sitting senators; listed individual stocks only, ranked by sum of bracket floors. The full 94-senator table (annual_holdings_by_senator.csv) is published with this article.
The table is not close. Ricketts' five listed-stock rows floor at $55,001,004 — 67.3% of the $81.8 million Senate-wide total — and are essentially one stock: Charles Schwab in three accounts, two in the $25,000,001–$50,000,000 bracket. His family founded TD Ameritrade, acquired by Schwab in 2020. One Schwab row, at its floor alone, exceeds every other senator's entire listed-stock total. In the trading table he is 10th by dollars: 25 trades, all sales, all on one day in September 2023.
Second is Whitehouse at $7,674,092 — the broadest book in the Senate, 104 positions; his 139 trades rank 12th by trading dollars. Smith is third at $2,465,023.
The trading king ranks 12th here: Tuberville's 41 listed positions floor at $855,030 (ceilings $2,286,000), his largest Apple at $250,001–$500,000. Boozman, third by trade count, holds 63 listed positions flooring at $48,048 — 34th. The Senate's heaviest trading ends in stock lists worth, at most, low seven figures.
Tuberville's figure is also below the $1,055,033 our earlier three-senator sample produced, because the sample counted rows the form labels as stock — several are funds. The census counts actual companies only. McCormick's report holds a Bridgewater equity instrument marked "Over $50,000,000," proceeds of his hedge-fund exit. Counted as labelled, he looked like a $50.5 million stockholder; classified by what it is — a private stake — it leaves the ranking, and his listed-stock floor is $500,001, 18th. Justice carries 14 rows marked "Over $50,000,000," all private coal, hotel or land interests. The largest numbers in Senate disclosure are not in the stock market at all.
Two cautions mirror the trading side. Forty-seven of the 94 report no listed individual stocks at all — their money sits in funds, managed accounts, blind trusts and cash, invisible here; zero means "none disclosed," not "owns nothing." And the bracket disease applies too: Cruz, Scott and Sullivan tie at a $1,000,001 floor — an artefact of identical minimum brackets, not a measurement.
Three leaderboards, three different answers. Who trades most: Tuberville. Who holds the most listed stock: Ricketts, by an order of magnitude. Where the biggest disclosed positions sit: private holdings no stock ranking shows. The documents are public. The definitions are where the story is decided.
Whose trades are these, anyway?
One more caution: "the senator" usually did not place the trade in an account solely theirs. Across the 4,246 stock transactions, 44.0% (1,868) sit in joint accounts, 26.5% (1,125) in a spouse's name, 28.0% (1,191) in the senator's own name and 1.5% (62) in a child's — 72.0% is not in the senator's sole name. The filings do not say who decided each trade; these are household records wearing a senator's name.
What this data cannot tell you
The denominator is 56, not 100. Senators with blind trusts, or who simply do not trade, file no PTRs and are invisible here. The data cannot distinguish "does not trade" from "had nothing to report."
The brackets cap the precision. Every total is an estimate inside a wide range — Armstrong's spans fivefold. Any single number quoted from this data is softer than it looks; treat exact ranks below the very top as provisional.
Flow is not performance. PTR brackets carry no prices or share counts, so no return can be computed; whether disclosed trades performed is tested separately. Nor does activity imply information: the filings record that trades happened, not why.
The holdings ranking counts listed stocks only, across 94 of 100 senators. Funds, ETFs, bonds and private stakes are excluded by construction — including them is how a private Bridgewater stake becomes a "$50.5 million stock portfolio." Four senators' final reports are paper-only, two newly seated senators have filed none: absence means unmeasured, not empty-handed. Classification is by asset name.
How to use this on GetCoattail
- 1. Ask which yardstick a ranking uses — trades, dollars, or holdings. Our politician screens label which one you are looking at.
- 2. Read the range, not the rank — and for "what do they own," open the annual report, not the trade stream.
Related reading: The 56% Win Rate That Still Didn't Beat the S&P 500; our Pelosi trade file.
Methodology and data
Data and method: U.S. Senate eFD Periodic Transaction Reports (706 filings, submitted Jan 2021–Oct 2026; trades dated Feb 7, 2020–Sep 11, 2026) and Annual Financial Disclosures for CY 2025 (94 of 100 sitting senators, latest filed versions; 4 paper-only final reports — Blumenthal, Cantwell, Durbin, Wyden — and 2 newly seated senators, Armstrong and Graham, excluded). Amounts are disclosed only as brackets; trading totals are sums of bracket floors, midpoints or ceilings as labelled. "Stock trades" = transactions typed as stock, purchases plus full/partial sales; 31 Exchange rows excluded from dollar totals. Amended reports: 21 of the 706 PTRs re-state an earlier report by the same senator (the later filing restates at least 80% of the earlier filing's stock rows); each report is counted once, at its latest version, leaving 685 counted reports. Ranks are ordinal positions in the sorted table — filers with identical totals do not share a rank, so a position inside a tie group reflects table order, not a measured difference. Holdings = listed individual stocks classified by asset name from 5,286 disclosed asset rows (funds/ETFs, bonds, private stakes, real estate and cash separated); open-ended "Over $…" rows excluded from sums (3 listed-stock rows). Current/former status matched by full name to the Senate roster on Oct 5, 2026. The full 56-senator trading table (rankings_by_senator.csv) and 94-senator holdings table (annual_holdings_by_senator.csv) are published with this article.
- Data files: all 56 filers' stock-trading totals on all three bases — floors, midpoints, ceilings (CSV); all 94 senators' listed-stock holdings (CSV).
Past patterns are not a promise of future results. For education only — not investment advice.
Revision history
- v1.0 — October 7, 2026: first publication. An earlier draft counted amended reports alongside the originals they replaced; recomputing with each report counted once, at its latest version, lowers the market-wide midpoint total from $165.1 million to $157.8 million and the leading senator's trade count from 1,024 to 866, and one senator's status was corrected from current to former. Holdings figures are unaffected.