Why this question is worth a precise test
Committee jurisdiction is the most plausible legal information channel in Congress: Banking members sit through briefings on bank supervision, Armed Services members see procurement plans years before contracts are public. If a disclosed-trading edge exists anywhere, it should concentrate here.
Under the STOCK Act (5 U.S.C. §13105(l)), members report their trades in Periodic Transaction Reports, due no later than 45 days after the transaction. We score every purchase from the first close the public could act on — the trading day after filing — so the test asks the only question a reader of these filings can act on: after disclosure, did the jurisdiction trades do better?
The test
Population. Every purchase on a Periodic Transaction Report by the 59 members GetCoattail tracks — 48 in the House, 11 in the Senate — filed between October 1, 2021 and September 30, 2026. After removing duplicates from amended filings: 5,528 purchases. Of those, 4,205 could be assigned an industry; the other 1,323 (index ETFs, funds and issuers with no SIC code) were set aside as unclassifiable rather than counted as "outside jurisdiction" (the earlier study's convention). Of the classifiable 4,205, 3,471 could be scored at 60 days; the rest lack a price file (251) or run past the end of the price data (483). Attrition was 20.0% inside jurisdiction, 17.3% outside.
The jurisdiction rule, deliberately mechanical. Each issuer's industry is its SEC SIC code. Each committee was mapped in advance to the SIC groups its jurisdiction names: Financial Services and Banking to financials (SIC 6000–6999); Armed Services to a fixed list of defense codes (aircraft, missiles, ships, ordnance, navigation); Energy and Natural Resources to oil, gas and refining; HELP and Education and Workforce to health care and education; Agriculture to farm and food codes; Commerce and Transportation to transport and telecoms; Natural Resources to mining. Committees whose reach is economy-wide or non-industrial — Appropriations, Ethics, Judiciary, Budget, Oversight and the rest — were mapped to nothing: a committee that funds everything has no honest "inside." One judgment call deserves a spotlight: insurers sit in the financial SIC division, so a health insurer counts as a financial stock. The full mapping is published with this article and applied identically to everyone.
The big caveat, stated before the results. Assignments are the current, 119th-Congress rosters, applied to all five years. Applying today's seats to a 2021 trade is an approximation — the price of a both-chambers test, since no equivalent machine-readable historical series exists. We handle it three ways: a 119th-Congress-only check, where the rosters are the members' own; the 118th window re-scored against that Congress's own rosters; and full disclosure here.
Scoring. Identical to our Senate–House and Senate Scorecard studies: entry at the close on the first trading day after filing, excess return versus the S&P 500 over 30, 60 and 90 trading days, 60 primary. As a pipeline check, re-running this code on the Senate alone reproduces our published Senate Scorecard numbers exactly — 817 scored purchases averaging +1.46%.
Result 1: the jurisdiction slice is small
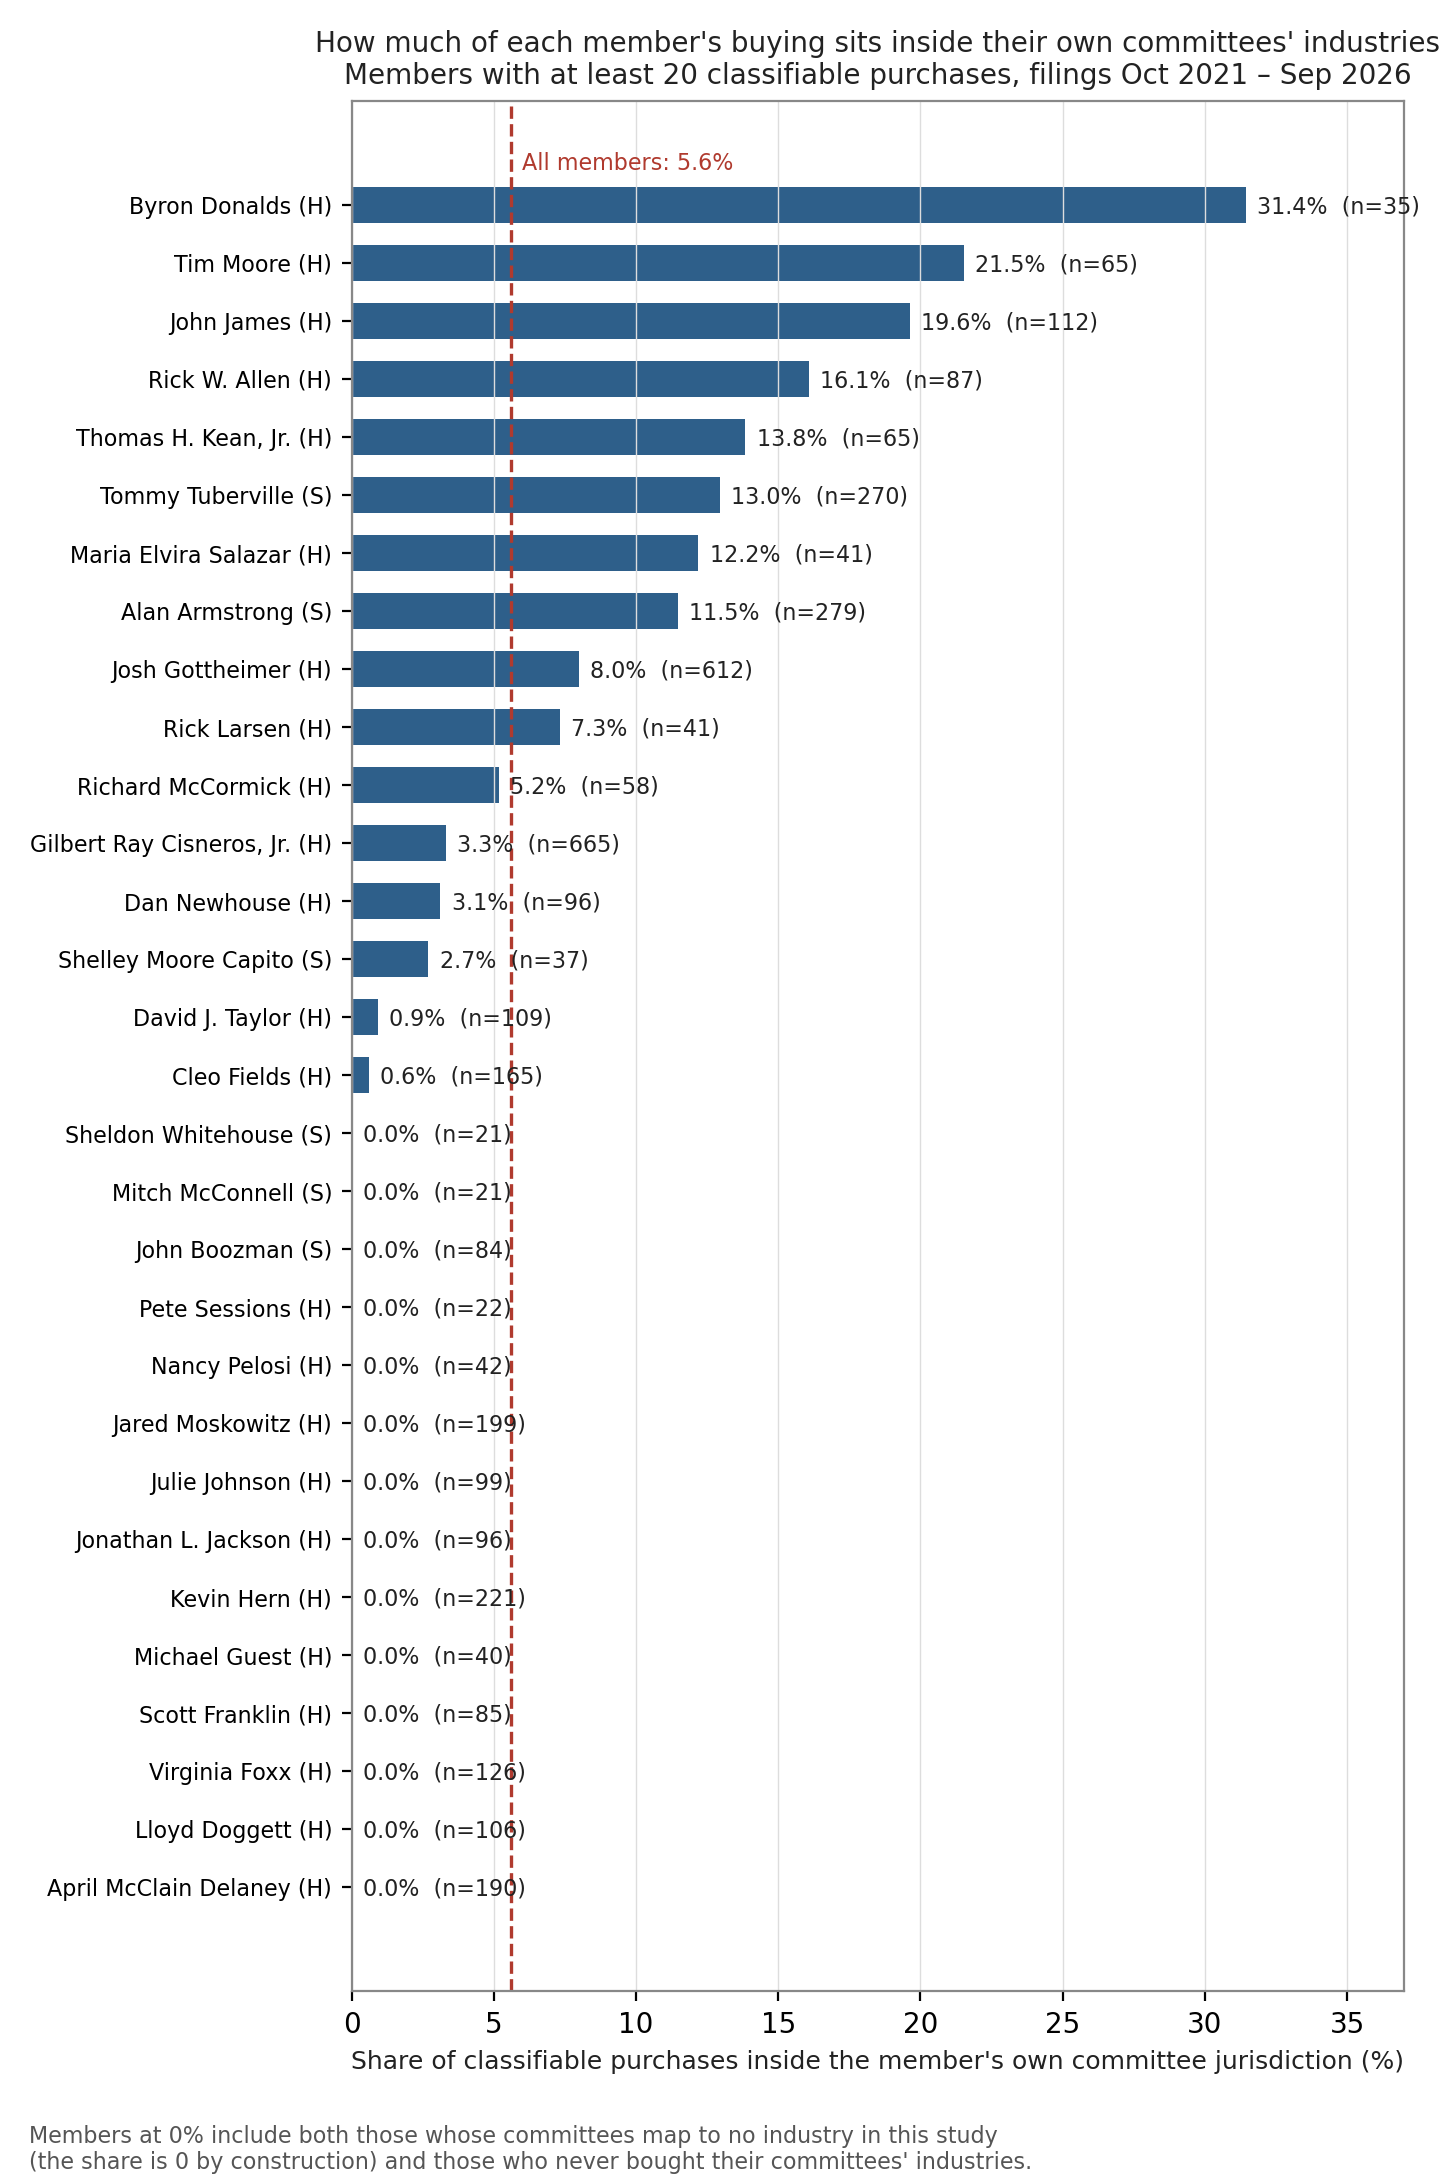
Of 4,205 classifiable purchases, 235 (5.6%) fell inside the buyer's own committee jurisdiction — 9.8% in the Senate (72 of 737) and 4.7% in the House (163 of 3,468). Half of the 48 members with classifiable buys — 25 — never made one in five years; for 14, that is true by construction, because none of their committees map to an industry at all. All 235 came from the other 23 members.
Is 5.6% low? Against two baselines, yes: weighting members' seats across the tracked stock universe predicts 9.7%, and weighting by the purchase pool's own industries predicts 6.6%. The observed share is significantly below both (permutation p ≤ 0.002).
The highest share belongs to Byron Donalds (Financial Services): 31.4% of his 35 classifiable purchases were financials. By count, the most in-jurisdiction buying came from Josh Gottheimer (49 of 612, 8.0%), Tommy Tuberville (35 of 270, 13.0%) and Alan Armstrong (32 of 279, 11.5%) — Armstrong's arrived in a single catch-up filing in July 2026, after his March appointment, and none can be scored yet. The scored jurisdiction trades concentrate in three committees: House Financial Services (72 of the 188), House Energy and Commerce (46), Senate HELP (26). Education contributes zero.
Result 2: no performance difference we can measure
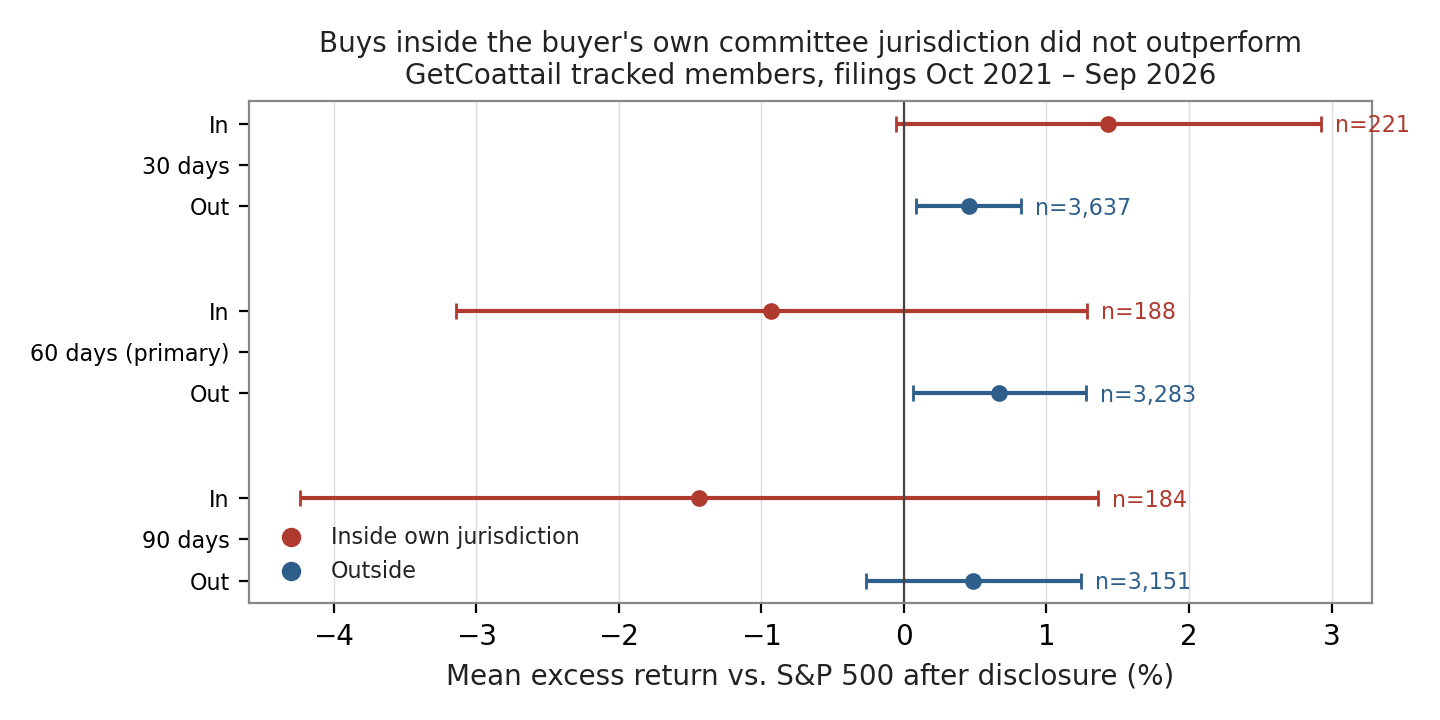
The 188 scored in-jurisdiction purchases averaged −0.93% excess over 60 days (median −2.86%, 41.0% beating the index, 95% CI −3.14% to +1.28%). The 3,283 scored purchases outside jurisdiction averaged +0.67% (median −1.01%, 47.6% beating the index, CI +0.07% to +1.28%). The difference, −1.60 points with a confidence interval of −3.90 to +0.69, cannot be distinguished from zero. Member-clustered errors (trades bunch within members; windows overlap) widen the interval to −6.11 to +3.67. Same answer, honestly wider.
| Group (60 trading days after disclosure) | n | Mean excess | Median | Beat index | 95% CI of mean |
|---|---|---|---|---|---|
| Inside own jurisdiction — all | 188 | −0.93% | −2.86% | 41.0% | −3.14 to +1.28 |
| Outside — all | 3,283 | +0.67% | −1.01% | 47.6% | +0.06 to +1.28 |
| Inside — Senate | 39 | +2.05% | −0.09% | 48.7% | −1.85 to +5.94 |
| Outside — Senate | 372 | +1.35% | −0.57% | 48.4% | −0.23 to +2.93 |
| Inside — House | 149 | −1.71% | −2.95% | 38.9% | −4.31 to +0.90 |
| Outside — House | 2,911 | +0.58% | −1.06% | 47.5% | −0.07 to +1.24 |
Table 1: Excess return vs. the S&P 500, entry at the first close after filing. The inside-minus-outside difference is −1.60 points overall (95% CI −3.90 to +0.69); with member-clustered errors the interval widens to −6.11 to +3.67.
Split by chamber, the point estimates point in opposite directions: in the Senate, jurisdiction buys averaged +2.05% against +1.35% for the rest (difference +0.70, CI −3.49 to +4.88, on just 39 trades); in the House, −1.71% against +0.59% (difference −2.30, CI −4.98 to +0.39).
Does the result survive?
At 30 days the gap is +0.98 points; at 90 days, −1.92; every interval includes zero. Restricting to 119th-Congress filings — where today's rosters are truly the traders' own — the jurisdiction group leads by +2.34 points, again with an interval (−2.11 to +6.79) that includes zero. The narrow four-committee mapping from our Senate study gives +0.99; the broadest defensible mapping (adding Finance and Ways and Means as financial committees) gives −1.46; both intervals include zero. Dropping the two highest-volume members changes nothing. Equal-weighting members instead of trades: −3.04. Members against themselves (the 20 with scored buys on both sides): −3.30. Every interval includes zero.
| Check | In n | In mean | Out n | Out mean | Difference | 95% CI |
|---|---|---|---|---|---|---|
| 30-day horizon | 221 | +1.43% | 3,637 | +0.45% | +0.98 | −0.56 to +2.52 |
| 90-day horizon | 184 | −1.44% | 3,151 | +0.49% | −1.92 | −4.82 to +0.97 |
| 119th-Congress filings only | 70 | +3.35% | 1,696 | +1.01% | +2.34 | −2.11 to +6.79 |
| Narrow mapping (Senate study's four committees) | 28 | +2.33% | 383 | +1.35% | +0.99 | −3.74 to +5.71 |
| Broad mapping (adds Finance, Ways & Means) | 211 | −0.79% | 3,260 | +0.67% | −1.46 | −3.59 to +0.66 |
| Excluding the two highest-volume members | 154 | −1.49% | 3,036 | +0.72% | −2.21 | −4.85 to +0.44 |
| Filed Oct 2021–Jan 2023 (117th-Congress window) | 28 | −2.51% | 449 | +2.70% | −5.20 | −11.85 to +1.44 |
| Filed Jan 2023–Jan 2025 (118th-Congress window) | 90 | −3.76% | 1,138 | −0.63% | −3.14 | −5.67 to −0.61 |
Table 2: Robustness checks on the 60-day difference (inside − outside), except where the horizon itself is the check. Every interval includes zero except the 118th-Congress filing window, discussed in the text.
One cell deserves honesty rather than a footnote: split by filing period, the 118th-Congress window shows a −3.14-point gap whose interval (−5.67 to −0.61) does exclude zero — on the negative side. The windows on either side flip sign (−5.20, then −3.14, then +2.34), and across the ten-plus comparisons in this study, one interval excluding zero is close to what chance produces on its own. Two sterner tests dissolve even that cell: re-scoring the 118th window on its own Congress's rosters moves the gap to −2.80, with zero back inside the clustered interval (−6.57 to +0.82); scoring every period on its own rosters gives −1.10 overall, interval including zero. We report the cell; we do not build on it.
The cases cut both ways — inside one committee
The two Financial Services members with the most jurisdiction buying land at opposite ends. Tim Moore's 14 scored in-jurisdiction purchases averaged +20.98% (median +31.18%, 13 of 14 beating the index) — including the best jurisdiction trade in the study, a UnitedHealth purchase filed August 5, 2025 (+33.42% in 60 days). (An insurer — hence a "financial" stock under the SIC rule.) Byron Donalds' 10 scored in-jurisdiction purchases averaged −12.39%, with one of ten beating the index. Josh Gottheimer, the most prolific jurisdiction buyer, averaged −3.61% across 43 scored trades and made the single worst one (Affirm, filed November 2021, −63.42%). John James of Energy and Commerce averaged −10.04% across 20 jurisdiction trades.
The extremes of the whole study sit outside jurisdiction, and both belong to the same freshman: Gil Cisneros bought Intel (filed February 13, 2026; +151.48%) and Centene (filed May 6, 2025; −71.15%) — neither semiconductors nor, for an Armed Services member, a health insurer is inside his jurisdiction under the rule. The median scored purchase of the 3,471 is a Tuberville Clorox trade at −1.08%, outside all of his mapped seats.
What we can and cannot claim
We can claim this: for the 59 members we track, across five years and both chambers, purchases inside the buyer's own committee jurisdiction — under a published, mechanical SIC mapping — were rare (5.6% of classifiable buying, against baselines of 6.6% and 9.7%) and did not measurably outperform the purchases that fell outside it, in the primary test or in any variant we ran. Combined with our Senate-only result (62 overlap trades, +0.61-point gap, interval including zero), the committee story has failed the same test at two widths of definition.
We cannot claim committee knowledge is worthless. The measurement has real seams. Today's rosters are projected backwards five years; the period-matched re-runs blunt but cannot erase that. The SIC rule is rigid — it files health insurers under finance and platform companies under "computer services," whatever committee actually oversees their issues. Ten tracked members contribute no parseable purchases at all, and 476 House filings are scanned images our parser cannot read. Our price universe uses currently tracked tickers, flattering every group in the same direction. We test purchases only; nothing here speaks to sales. Disclosed amounts are ranges, so nothing here is position-weighted. And the jurisdiction sample, 188 scored trades concentrated in a few committees and members, is simply small: the test can rule out a large edge, not a modest one.
One plausible reading is that committee work mostly conveys knowledge about regulation and spending — slow, diffuse forces — rather than about which stock wins the next quarter. That is a hypothesis, not a finding. The finding is narrower and, for readers of these filings, more useful: the "they bought what they oversee" flag, by itself, carried no measurable information about what happened next.
How to read a committee headline
On any member's page on this site, compare two things before treating a trade as a committee story: the member's actual committee list, and the stock's industry. If the pairing survives, look at the trade itself — size range, timing, habit — because the overlap label alone has not predicted performance in five years of data. What would change our reading: more members filing readable reports, a bigger jurisdiction sample, and time.
Methodology and data
Data and methodology: Periodic Transaction Reports (Senate eFD; House Clerk index and filing texts) for purchases filed 2021-10-01 to 2026-09-30 by the 59 members tracked by GetCoattail; committee assignments from the public congress-legislators dataset (119th Congress, current; end-of-117th and end-of-118th snapshots from the same dataset's revision history for the roster sensitivity checks); issuer industries from SEC SIC codes; prices are adjusted daily closes (price universe to 2026-10-02). Entry is the close on the first trading day after filing; returns are excess versus the S&P 500 over the same window; trading costs and taxes are not reflected. The full signal file — signals_committee_jurisdiction.csv, every extracted purchase with its industry, committee assignment and jurisdiction flags — is published with this article. Past patterns are not a promise of future results. For education only — not investment advice.
Revision history
- v1.0 — October 13, 2026: first publication. Filings through 2026-09-30; prices to 2026-10-02.