GetCoattail Research — we measured the gap between every disclosed Senate stock trade and the day the public could first read about it. The middle of the distribution is boring. The tail belongs to three people.
The median Senate stock trade is disclosed 32 days after it happens — inside the 45-day reporting window the STOCK Act sets. The slowest disclosure in the data took 953 days: purchases made in a senator's first week in office, in his spouse's name, surfaced about two and a half years later. A third number sits between them: 35.4% of all disclosed stock trades were filed more than 45 days after the trade. All three numbers are true. Only one of them describes a typical senator.
How we measured the lag
Population. Every Periodic Transaction Report (PTR) in the Senate eFD system filed from January 2021 through October 2026: 706 reports from 56 senators — 47 current, 9 former. Twenty-one reports are amendments re-stating an earlier report; each is counted once, at its latest version, leaving 685. Forty-four of the 56 filers report stock transactions: 4,246 in total, traded between February 7, 2020 and September 4, 2026. (Our companion ranking of who trades and who holds is here.)
The lag. For each transaction row, the lag is the report's filing date minus the trade date, in calendar days. One report can bundle many trades, so the lag is measured per transaction, and we report document-level behaviour separately.
The 45-day line — and what we do not call it. The STOCK Act's outer limit for reporting a transaction is 45 days. But the forms do not record when the senator was notified of a trade, and notice timing is what the deadline actually runs from. So this article says "filed after day 45" — a fact about dates — and never "in violation." Extensions and broker-notice delays are invisible in this data, in both directions.
Two ways to date an amendment. When a report is later amended, the same trades get a second filing date. Our headline numbers date each report at its latest version — the same convention as our rankings piece. Where it matters, we also show the first-report basis: rows re-dated to the original filing. The gap between the two bases is itself one of the results.
Result 1: the typical trade is disclosed in about a month
The median lag is 32 days on the headline basis, 31 on the first-report basis; a quarter of all trades are disclosed within 23 days. That centre barely moves however the data is cleaned — every counting rule we tried puts the median between 29 and 32 days.
The punctual end has volume behind it. Shelley Moore Capito disclosed 239 stock trades with not one filed after day 45 — median 23 days, longest 44. David McCormick disclosed 84, also with none late, median 22 days. In total, 23 of the 44 senators with stock trades never filed a single stock row after day 45.
Result 2: the late tail is three people
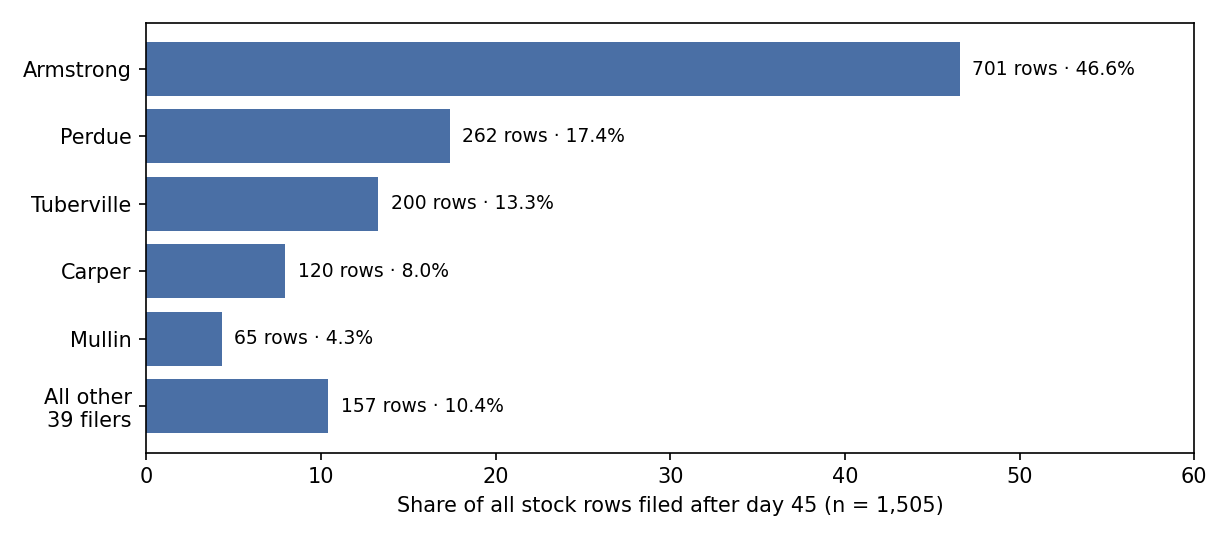
1,505 of the 4,246 stock rows — 35.4% — were filed after day 45, and 515 of them (12.1%) after a full year. That pool sounds like a chamber-wide habit. It is not:
| # | Senator | Status | Stock rows filed after day 45 | Share of all late rows |
|---|---|---|---|---|
| 1 | Armstrong, Alan | current | 701 | 46.6% |
| 2 | Perdue, David | former | 262 | 17.4% |
| 3 | Tuberville, Tommy | current | 200 | 13.3% |
| 4 | Carper, Thomas R. | former | 120 | 8.0% |
| 5 | Mullin, Markwayne | former | 65 | 4.3% |
| — | Top 5 subtotal | 1,348 | 89.6% | |
| — | All other filers (39 senators) | 157 | 10.4% | |
| — | Total | 1,505 | 100.0% |
Stock rows filed more than 45 days after the trade date, latest-filing basis; population n = 4,246 stock transactions, 44 filers, reports filed Jan 2021–Oct 2026. The full 44-senator table (filing_lag_by_senator.csv) is published with this article.
Three senators — Armstrong, Perdue, Tuberville — account for 77.3% of every late row; five account for 89.6%. Looked at by document rather than by row, the lateness shrinks further: of 504 reports containing stock trades, only 68 (13.5%) contain even one row filed after day 45. The typical report holds three transactions, and its longest lag is 29 days.
One document does outsized work. A single report filed by Alan Armstrong on July 21, 2026 carries 702 stock rows — 701 of them past day 45 — covering trades from his first months in office, March 24 to June 24, 2026. Delete that one document and the chamber-wide late share falls from 35.4% to 22.7%, and the median lag from 32 to 29 days.
Result 3: late filing is episodic, not chronic
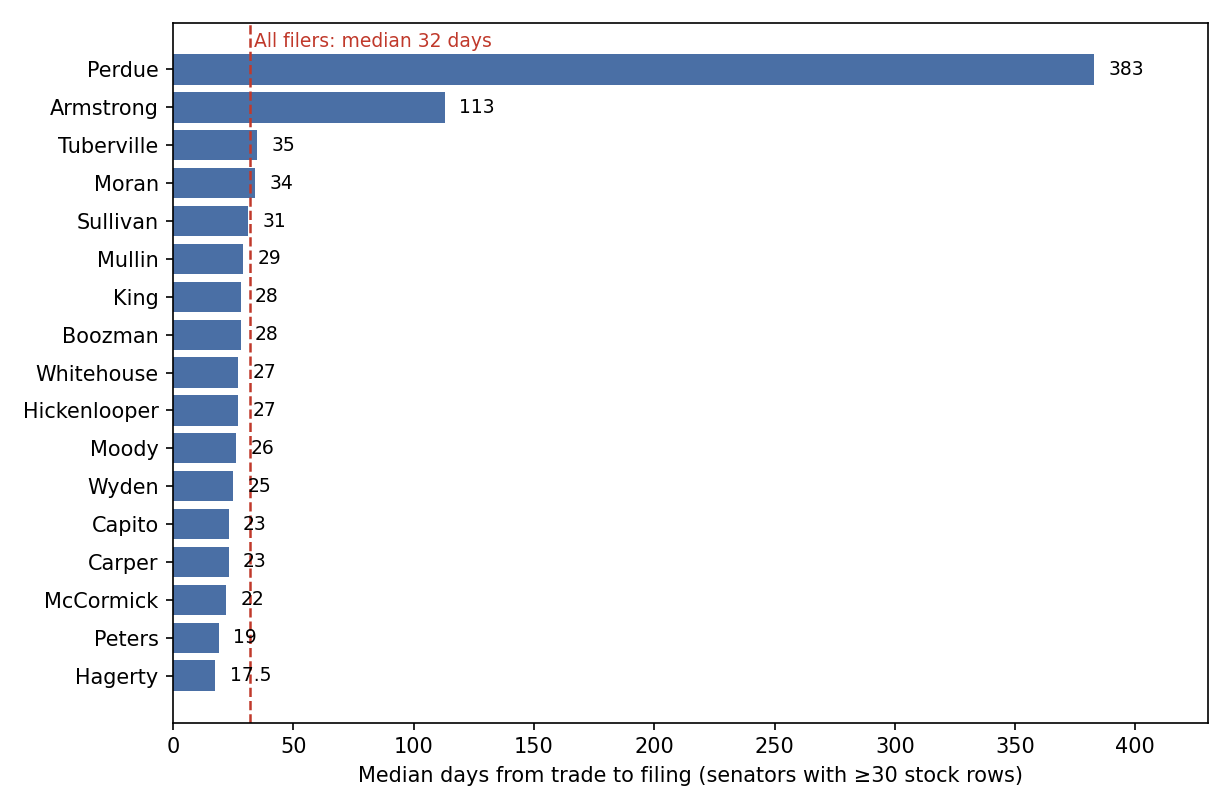
The senators with the most late rows are not, in the main, slow filers. They are punctual filers with occasional bulk events — an arrival, a departure, a clean-up:
| Senator | Status | Stock trades | Median lag (days) | Mean lag | Longest lag | Filed after day 45 |
|---|---|---|---|---|---|---|
| Armstrong, Alan | current | 704 | 113 | 114 | 119 | 701 (99.6%) |
| Perdue, David | former | 262 | 383 | 399.3 | 450 | 262 (100.0%) |
| Tuberville, Tommy | current | 866 | 35 | 139 | 876 | 200 (23.1%) |
| Carper, Thomas R. | former | 351 | 23 | 113.3 | 761 | 120 (34.2%) |
| Mullin, Markwayne | former | 410 | 29 | 116.3 | 953 | 65 (15.9%) |
| Boozman, John | current | 414 | 28 | 52 | 499 | 49 (11.8%) |
| Hickenlooper, John | current | 123 | 27 | 62.4 | 492 | 19 (15.4%) |
| Sullivan, Dan | current | 111 | 31 | 61.8 | 238 | 19 (17.1%) |
| Wyden, Ron | current | 53 | 25 | 70.8 | 465 | 15 (28.3%) |
| Moran, Jerry | current | 110 | 34 | 65.1 | 435 | 9 (8.2%) |
| Whitehouse, Sheldon | current | 139 | 27 | 26.1 | 301 | 6 (4.3%) |
| Hagerty, Bill | current | 34 | 17.5 | 67.8 | 523 | 6 (17.6%) |
| Peters, Gary | current | 43 | 19 | 28 | 262 | 2 (4.7%) |
| Capito, Shelley Moore | current | 239 | 23 | 22.6 | 44 | 0 (0.0%) |
| McCormick, David H. | current | 84 | 22 | 20.5 | 30 | 0 (0.0%) |
| Moody, Ashley B. | current | 57 | 26 | 28.1 | 39 | 0 (0.0%) |
| King, Angus | current | 45 | 28 | 30.8 | 41 | 0 (0.0%) |
Filing lag per senator, latest-filing basis; senators with at least 30 stock transactions (17 of 44 filers). The remaining 27 filers are in the published CSV; small samples are not ranked. "Filed after day 45" counts transaction rows, not reports.
Read the median and the mean together and the pattern shows. Thomas Carper's median lag is 23 days — a model filer — yet his mean is 113.3 days and 120 of his rows (34.2%) are late, because a batch of clean-up reports he filed on a single day in May 2021 reaches back to 2020 trades. Among filers with at least 30 stock transactions, David Perdue is the only one at 100% late — all 262 rows — but he is a former senator, and every row is a February–April 2020 trade filed on May 2, 2021, after he had left office: a departure backlog, not a sitting senator's habit.
The extreme tail belongs to Markwayne Mullin. His median lag is 29 days. But the ten longest delays in the entire dataset are all his: purchases dated January 3, 2023 — his first week in the Senate — in his spouse's name, in the smallest bracket ($1,001–$15,000): Shopify, PayPal and FirstCash at 953 days, disclosed August 13, 2025; Insulet, Instructure, Hubbell and others at 939 days, disclosed July 30, 2025. These are original filings, not amendments — the delay is the same on either measurement basis. Fifty-eight of his 410 stock rows were disclosed more than a year after the trade.
Result 4: the recent, real cases are smaller — with one exception
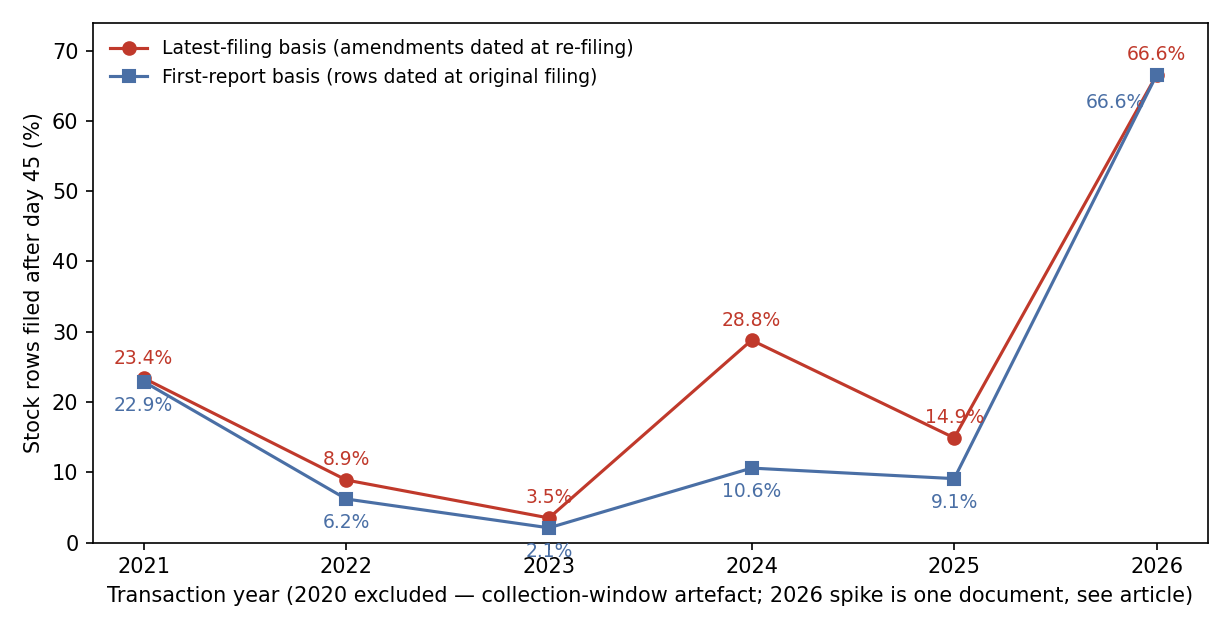
Most of the extreme backlog is old: arrivals, departures and 2020–2021 clean-ups. The recent record is mostly clean. Trades made in 2026 carry a headline late rate of 66.6% — but 701 of those 705 late rows are the single Armstrong document above. Set it aside and 2026 is the cleanest year in the data: 356 trades, four filed after day 45 (1.1%), median lag 23 days.
The standing exception is Katie Britt. Her sample is small — 24 stock trades — so we cite her as a case, not a rank: 22 of the 24 (91.7%) were filed after day 45, and her median lag is 271 days. A report she filed on January 26, 2026 contains purchases dated April 14, 2025 — Exxon Mobil, JPMorgan and Alphabet among them — a lag of 287 days. It is an original filing, not an amendment artefact. Small numbers, but they are the kind of delay the 45-day window exists to prevent the public from missing — and they are recent.
Result 5: the lateness statistic is made by the measuring rule
Three hundred and twenty stock rows sit in reports that replaced an earlier version of the same report. Date those rows at the original filing instead of the amendment, and 261 of them get a different lag. Nothing else changes — and the chamber-wide late share falls from 35.4% to 31.6%. Restrict attention to trades from 2022–2025, the years clear of the collection window's edges, and the effect doubles: 13.4% late on the latest-filing basis, 6.8% on the first-report basis.
The cleanest illustration is Tommy Tuberville's spring of 2024. His May 2024 trades were first filed in June 2024. An amendment filed on August 5, 2026 re-states them — and on the latest-filing basis those rows read as 824 days late, with some of his 2024 rows measuring 876. The trades did not move. The ruler did.
Neither basis is the "true" one: the latest version is what a reader of the record sees today; the first report is when the public could first have known. But any late-filing statistic that does not state its basis — and its amendment rule — is a number with the method missing, and the method is worth up to half the number.
One quieter regularity survives both bases: trades in a spouse's name are disclosed fastest — median 26 days, 18.6% after day 45, across 1,125 rows. Joint accounts sit at the overall pattern (median 32 days). We report the spouse figure as an observation, not an explanation; the filings do not say who manages which account.
What this data cannot tell you
It cannot call anything a violation. The 45-day clock runs from when the filer knew, or should have known, of a transaction. Notice dates, extensions and broker delays are not in the data. Every figure here is a gap between two dates on public forms — nothing more.
2020 is a window artefact. Our collection covers reports filed from January 2021. A 2020 trade filed on time was filed in 2020 and is invisible here; the 2020 trades we see arrived in 2021 clean-ups, which is why 95.4% of them read as "late." We exclude 2020 from the year comparison rather than quote a meaningless rate.
Rows are counted as filed. A handful of rows repeat: 108 rows share an identical signature across two different counted reports, and 130 rows repeat verbatim inside a single report — plausibly separate lots of the same trade, indistinguishable on the form. Together they are under 6% of rows and cannot move any headline here, but they are in the counts.
Lag is not performance, and not proof of anything about a trade's motive. A disclosure can be late and innocent, or punctual and interesting. Whether disclosed Senate trades actually made money is a different question, tested separately — see The 56% Win Rate That Still Didn't Beat the S&P 500.
The denominator is 44, not 100. Twelve of the 56 PTR filers report no stock transactions at all, and senators who do not trade file no PTRs. This is a study of the senators who disclose stock trades, not of the chamber.
How to use this on GetCoattail
- 1. Read both dates. On our politician pages, every disclosed trade carries its trade date and its filing date. A report whose trade dates reach back months is a backlog event — an arrival, a departure, a clean-up — not fresh trading activity. Weight it accordingly.
- 2. Ask any "late filing" statistic for its basis. Latest version or first report? One bulk document in or out? The answer can halve the number.
Related reading: 866 Senate Stock Trades vs. $55 Million in One Stock — who trades, who holds, and why the two leaderboards disagree.
Methodology and data
Data and method: U.S. Senate eFD Periodic Transaction Reports (706 reports submitted Jan 2021–Oct 2026; trades dated Feb 7, 2020–Sep 4, 2026). Lag = calendar days from transaction date to the submitted date of the report containing the row. Amended reports: 21 of the 706 re-state an earlier report by the same senator (the later filing restates at least 80% of the earlier filing's stock rows, by row signature: date, owner, ticker, asset, type, amount bracket); each report is counted once, at its latest version, leaving 685 counted reports and 4,246 stock transactions from 44 filers (12 further filers report no stock rows). Headline basis is the latest-filing date; the first-report basis re-dates the 261 rows whose signature matches a superseded original to that original's filing date. "Filed after day 45" means lag > 45 calendar days; the data contain no notice dates, so no figure here is a determination that any rule was broken. Per-senator rankings are restricted to filers with at least 30 stock transactions; smaller samples are cited as cases only. Transaction-year 2020 is excluded from year comparisons (collection-window artefact). The full 44-senator lag table (filing_lag_by_senator.csv) is published with this article.
Past patterns are not a promise of future results. For education only — not investment advice.
Revision history
- v1.0 — October 7, 2026: first publication. Pre-publication revision (from independent verification): the 100%-late claim now carries its 30-transaction minimum, the Carper clean-up is described as a batch of reports filed on a single day in May 2021, and the stock-trade range ends Sep 4, 2026. No headline figure changed.