GetCoattail Research — Applied Digital is the market's purest listed bet on building AI data centers: revenue up 322% in the quarter it reported on October 7, about $36 billion of contracted lease revenue — and a GAAP net loss of $221.0 million, $6.4 billion of debt, and a stock that closed at $25.38 on October 2, down 48.9% from its 252-session closing high. Three of our 83 superinvestors hold it — every one of them new in the second quarter, 1,005,328 shares in total — and its insiders, across the entire Form 4 record we parse, have never recorded one open-market purchase against $34,724,280.30 of sales.
Start with the narrative: the print was enormous on the top line and red at the bottom. Applied Digital reported fiscal first-quarter 2027 results after the close on October 7, 2026: revenue of $341.9 million, up 322% year over year and far above the roughly $116.3 million consensus, with an adjusted loss of $0.01 a share against a consensus loss of about $0.29 — and a GAAP net loss of $221.0 million, against $18 million a year earlier. Adjusted EBITDA was $64.4 million. The company put its contracted base at about 1.41 gigawatts of critical IT load across five campuses, worth about $36 billion of base-term lease revenue, or about $86 billion if all renewal options are exercised; 250 megawatts at its Polaris Forge 1 campus are live. As of August 31 it held $3.7 billion of cash against $6.4 billion of debt, and it has issued $1.59 billion of 7.000% senior secured notes due 2031 toward the next building. The stock closed down 6.04% at $23.81 on results day, then rose after hours. Benzinga's October 8 radar of five stocks trending among retail traders named Applied Digital first. It was the highest-ranked stock we had not yet audited.
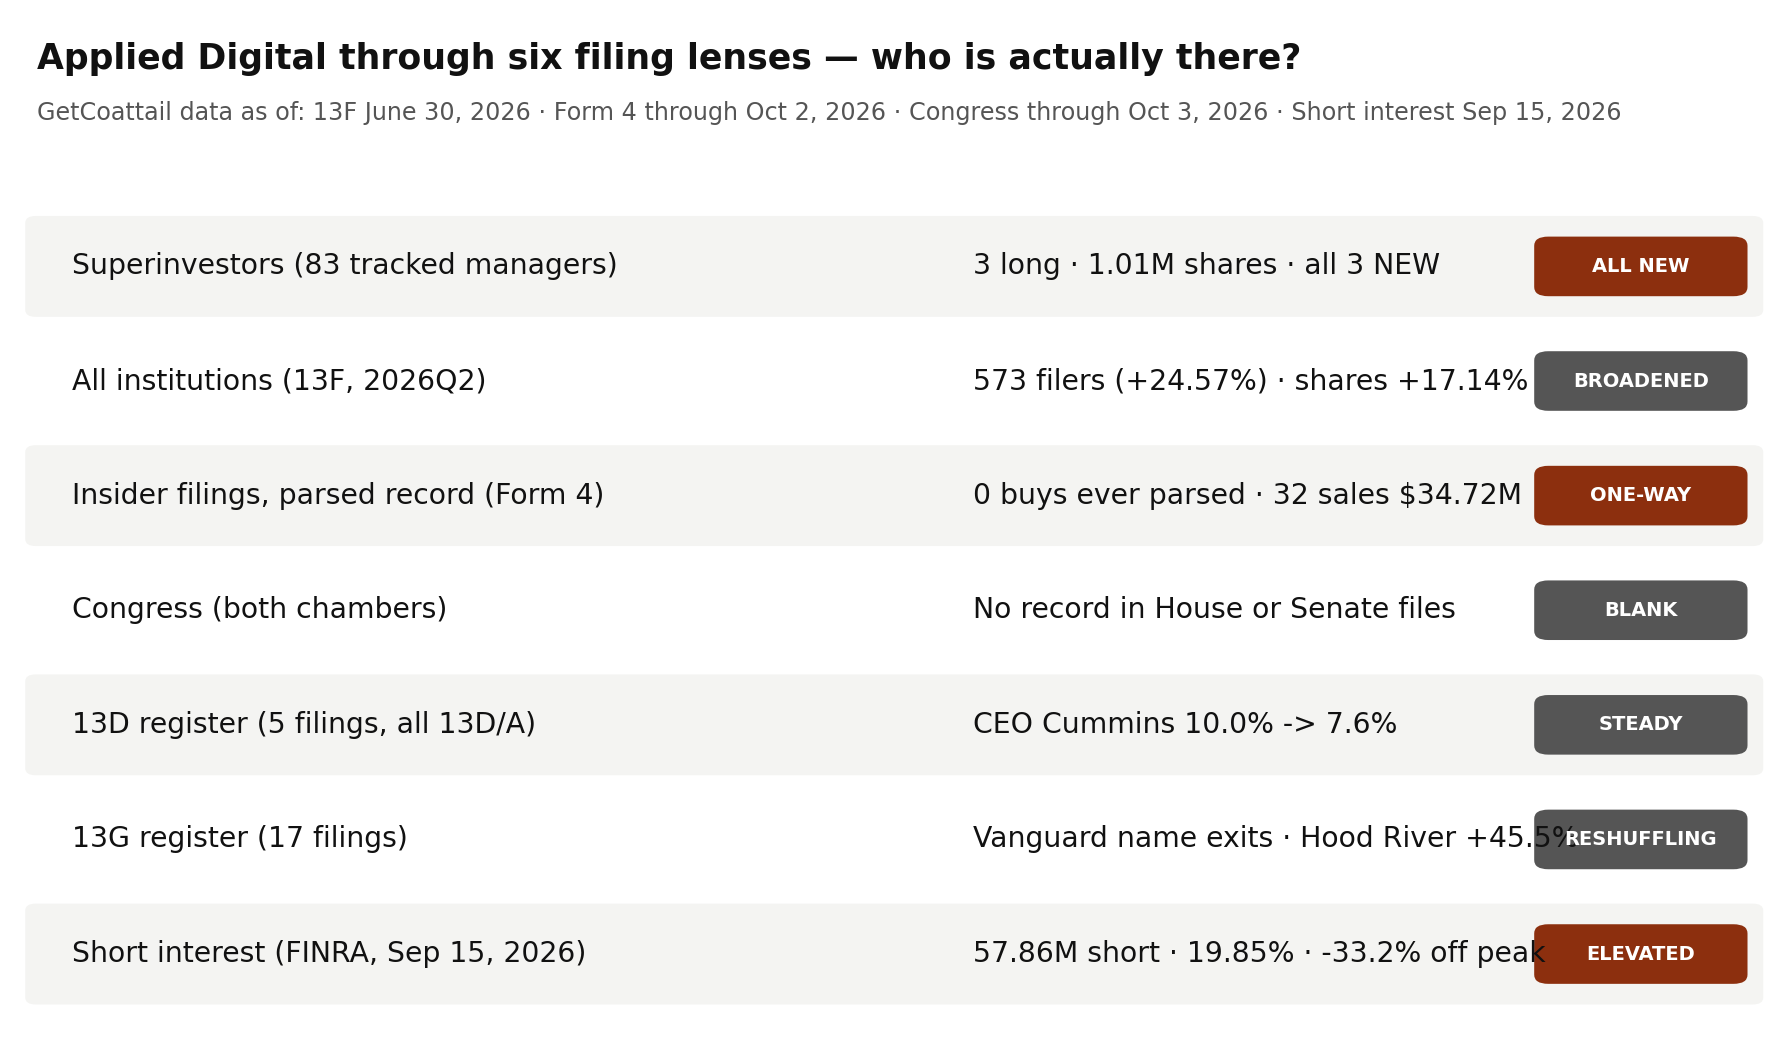
Now the filings. For Applied Digital — the thirty-first Filing Tape audit — the story is arrival without breadth: the tracked register went from zero to three names in one quarter, the full market broadened by a quarter, and the insider register has only ever pointed one way.
Lens 1: the superinvestors — three holders, every one of them new
We track 83 large, mostly long-only managers whose 13F portfolios we collect directly from SEC EDGAR. As of June 30, 2026, 3 held Applied Digital long — no option rows — totalling 1,005,328 shares worth $37,498,734. The direction count is three new, and nothing else: no increases, no decreases, no unchanged rows.
The register is one large arrival and two small ones. Chase Coleman's Tiger Global Management holds 885,000 shares worth $33,010,500, a 0.14% portfolio weight, marked new — and 88.0% of the tracked cohort's Applied Digital shares. Polen Capital Management is new with 98,328 shares worth $3,667,634, a 0.03% weight. Daniel Loeb's Third Point is new with 22,000 shares worth $820,600, a 0.02% weight. A quarter earlier the register was empty: the pipeline's first-quarter file holds zero filing rows for this CUSIP, so the cohort's position was built entirely inside the second quarter — the same quarter in which the price rose 57.1%, from $23.74 to $37.30. Because the prior-quarter base is zero, we state the share counts rather than a growth rate. No Applied Digital row appears in our EDGAR collection's exit lists, and the cohort's reported value implies $37.30 per share, matching the June 30 close exactly. Three names is not breadth; it is a first print.
Lens 2: institutions — 573 filers, up 24.57%
Zoom out to the whole 13F market and the broadening is real. At June 30, 2026, 573 institutions reported positions, up from 460 at March 31 (+24.57%), and 563 reported long positions. Reported shares rose 17.14%, from 183,030,956 to 214,398,806 shares, with 533 filers entering and 420 exiting. Reported aggregate value rose 82.81% to $10,115,164,264; the aggregate includes option rows, so we headline filer and share counts and label dollars "reported" (see methodology). The implied value per share, $47.18, sits 26.5% above the June 30 close of $37.30 — the widest gap of that kind in this series so far. Set the two registers side by side and the quarter reads the same way at both scales — more filers, more shares — but the tracked cohort's 1,005,328 shares are under half of one percent of the full market's reported count.
Lens 3: the 5% register — the chief executive at 7.6%, a reshuffled passive bench
Twenty-two SC 13D/G filings cover Applied Digital in our full parse — 6 SC 13G originals, 11 SC 13G/A amendments and 5 SC 13D/A amendments, with fourteen reporting persons and the most recent filed July 31, 2026. All five 13D/A amendments are one person's: Wesley Cummins, the company's chairman and chief executive, reported 22,254,970 shares (10.0%) as of March 26, 2025, then 22,176,070 shares (8.5%), 21,154,050 shares (7.4%), 21,154,050 shares (7.6%), and 22,042,487 shares (7.6%) as of July 7, 2026 — up 4.2% in shares from the January row, while the percentage slid from 10.0% because the share count around him grew. We report rows as filed and never sum them: group members and affiliated rows report overlapping stakes, and this register's aggregate field would multiply-count them. On the 13G side, The Vanguard Group reported 12,760,035 shares (6.04%) as of December 31, 2024, then 24,168,082 shares (8.65%) as of December 31, 2025, then 0 shares (0.0%) as of March 13, 2026; a row under a different reporter name, Vanguard Portfolio Management, then reported 14,996,742 shares (5.36%) as of March 31, 2026 and 13,768,802 shares (4.81%) as of June 30, 2026 — down 8.2%, reported as filed rather than merged with the other name. Hood River Capital Management rose 45.5% to 22,037,431 shares (7.89%) as of December 31, 2025. Jane Street Group, LLC's row climbed from 11,616,116 shares (5.0%) to 20,886,105 shares (7.1%) as of March 31, 2026, up 79.8%. BlackRock, Inc. stepped down 20.9% to 12,199,793 shares (4.3%) as of June 30, 2026. And one row belongs to the tenant: CoreWeave, Inc. reported 13,062,521 shares (5.5%) as of May 28, 2025, then 0 shares (0.0%) as of June 10, 2025 — the anchor customer printed as a 5% holder and was gone two weeks later.
Lens 4: insiders — zero purchases in the parsed record, $34,724,280.30 of sales
The parsed Form 4 record holds 66 filings through October 2, 2026. Across it, open-market purchases total zero transactions — no shares, no dollars, no buyers at all. Against that stand 32 sales totalling 1,431,599 shares and $34,724,280.30, by seven sellers, five of them recorded as officer sales. The last year holds the same shape: zero purchases against 20 sales — 699,209 shares, $24,313,273.30, seven sellers. The last 90 days hold a single market trade: one sale of 75,000 shares for $2,336,250.00, across 7 filings. Our site's insider aggregate (October 10, 2026) matches the full parse's 90-day figures exactly: zero purchases, one sale, $2,336,250.00, no last buy recorded. We assign no motives to any of it; the record's shape is the fact — in a stock whose story is insiders building at full speed, the personal register has only ever sold.
Lens 5: Congress — no record in either chamber
Across the congressional record we maintain (combined record as of October 3, 2026), Applied Digital has no record at all — no purchases, no sales, no member rows. The House aggregate (as of October 3, 2026) and the Senate aggregate (as of October 1, 2026) each carry no Applied Digital record. We report the absence rather than omitting the lens.
Lens 6: short interest — 19.85% of the share count, down 33.2% from the peak
As of September 15, 2026 — the most recent FINRA settlement date — 57,863,931 Applied Digital shares were sold short, with days-to-cover of 4.07, down 0.97% from the prior settlement. The series peak is recent: 86,580,036 shares on January 30, 2026, so the latest reading is 33.2% below the peak. Year over year the borrow is down 15.7%, from 68,679,087 shares on September 15, 2025, and since the June 30 settlement (70,993,690 shares) it is down 18.5%. Against the 291,469,112 shares in our fundamentals file (as of July 28, 2026), the borrow is 19.85% of the reported share count — still one share in five, in a stock whose tracked superinvestor register is three names old.
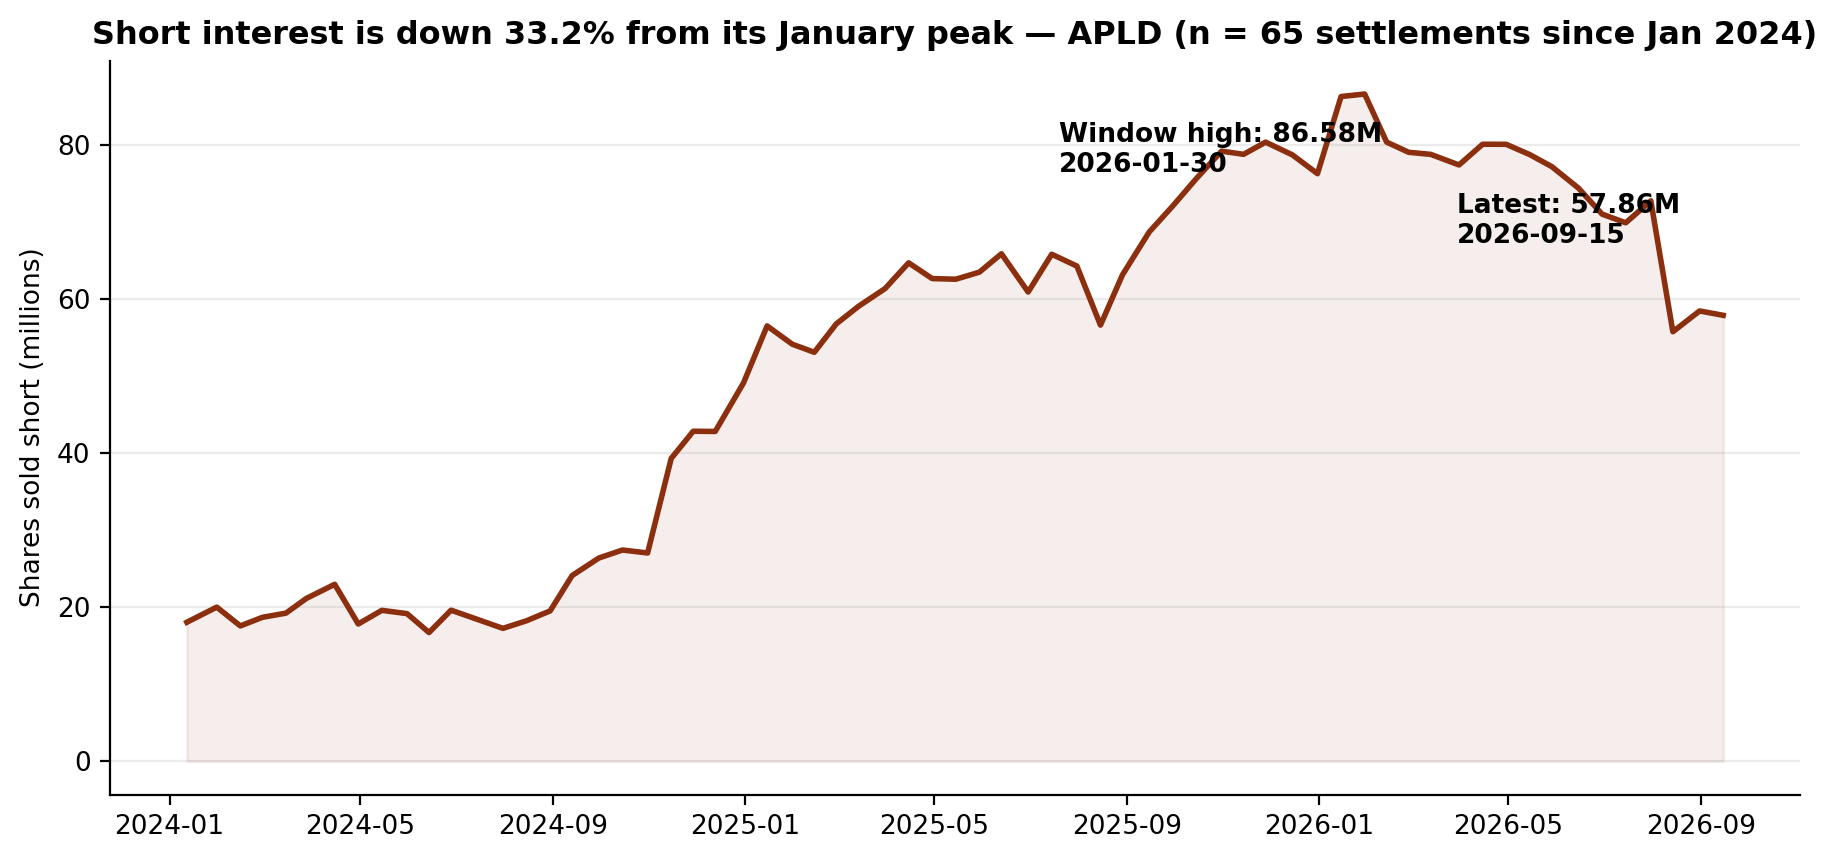
The recent settlements run 69,869,887 on July 15, then 72,715,542, 55,733,587, 58,427,815 and 57,863,931 — a July step up, a sharp August release, then two settlements of drift. The series began at 3,166 shares on January 29, 2021, before the company's 2022 listing, when the borrow was a few thousand shares; its lowest reading is 2,388 on April 15, 2021. At 19.85% of the share count the level, not the direction, is the fact in this lens.
The gap, stated plainly
The registers describe a company executing faster than its filing record can broaden. The tracked superinvestors went from zero rows to three — Tiger Global's 885,000 shares, Polen's 98,328 and Third Point's 22,000, all new, all inside a quarter when the price rose 57.1%. The full market broadened in earnest: filers up 24.57% to 573, reported shares up 17.14% to 214,398,806. The 5% register is dominated by the chief executive's own 22,042,487 shares (7.6%) and a passive bench that reshuffled under two different Vanguard reporter names. Insiders bought nothing — in the last 90 days, the last year, or the parsed record as a whole — against $34,724,280.30 of sales. Congress registers nothing. And the borrow, at 57,863,931 shares and 19.85% of the share count, has been unwinding from its January peak all year. One plausible reading is that the registers are sorted by speed: the fastest money (the borrow) has been leaving since January, the broad market arrived through the spring, and the tracked cohort printed its first three names only in the June quarter — each register reacting to a different vintage of the same story. The record supports each clause separately; it does not say which register is right.
What would change the picture
Nothing above is a recommendation. It is a record. These are the filings that would change the description:
- 1. The 2026Q3 13Fs (filing window closing mid-November 2026). Whether Tiger Global's 885,000 shares, Polen's 98,328 and Third Point's 22,000 survived a quarter in which the price fell 32.0% is the whole lens: with three holders, all new, any single exit returns this register to near its starting point.
- 2. The first insider open-market purchase in the parsed record. The count stands at zero purchases against 32 sales totalling $34,724,280.30. A single purchase — by anyone, of any size — breaks a pattern that has held for the entire record we parse.
- 3. The next Cummins 13D/A. The chief executive's register last printed on July 7, 2026, at 22,042,487 shares (7.6%), up 4.2% in shares from January. In a register this concentrated, his next amendment is the 5% lens.
- 4. Whether the borrow keeps unwinding into the results season. Short interest stood at 57,863,931 shares on September 15, down 33.2% from 86,580,036 on January 30 and at 19.85% of the share count with days-to-cover of 4.07. A rebuild toward the January peak, or a break below the August release level, is the fastest-updating series in this audit.
- 5. A congressional first print. Both chambers' registers are blank for this name. Any member row — in either direction — would be this lens's first entry.
Until one of those prints, the record describes a stock held by three of our 83 tracked superinvestors — 1,005,328 shares, every position new in the June quarter — whose insiders have recorded sales and no purchases, whose congressional register is blank, and whose borrow has fallen by a third from its January peak while remaining one share in five.
Related reading: Four of 83: Trian Is 68.6% of the Superinvestors' Wendy's Stake. Short Interest Is 25.61% of the Share Count. — Filing Tape #30; One of 83: The Superinvestors' T-Mobile Register Shrank to a Single Holder. Short Interest Is Up 44.3% in a Year. — Filing Tape #29; Zero of 83: The Superinvestors Aren't in IREN — Filing Tape #1. Applied Digital's own page: Applied Digital Corp. (APLD) on GetCoattail.
Methodology and data notes
- Superinvestor lens: 83 managers collected directly from SEC EDGAR Form 13F (managers_13f collection), positions as of June 30, 2026; Applied Digital identified by CUSIP 038169207. Three distinct managers hold long positions totalling 1,005,328 shares; all three reported rows are long (no put or call rows) and all three are marked new. Quarter-to-quarter cohort totals (0 shares at March 31 across zero filing rows; 1,005,328 shares at June 30 across three filing rows) are from the site pipeline's holdings files on the same CUSIP basis in both quarters, and the pipeline's second-quarter total matches the EDGAR collection's long total exactly (difference of 0 shares and $0), so no collection difference needs reporting for this name. Because the first-quarter total is zero, no percentage change is computed for the cohort. No Applied Digital row appears in the EDGAR collection's exit lists. Tiger Global's share of the cohort is 88.0% = 885,000 / 1,005,328.
- Full-market lens: SEC Form 13F Data Sets full-market aggregation. The primary table is the full13f collection's by-ticker file (holders = distinct filers reporting the CUSIP; 563 of the 573 reported long positions), and its figures match the backfill fixtures' by-CUSIP row for 038169207 exactly on holders, shares, reported value, prior holders and prior reported value. Reported-value caution: the aggregate value ($10,115,164,264 over 214,398,806 shares) implies ≈$47.18 per share against a June 30, 2026 close of $37.30 in our price file, a gap of +26.5% — the widest such gap in this series so far. The aggregate sums the VALUE of every information-table row — including put and call option rows — while the share count covers long common-stock rows only, so we headline filer and share counts and label dollar values "reported."
- Insider lens: full-parse Form 4 aggregation (agg_by_ticker), record as of October 2, 2026 (66 filings). Sale and purchase counts are transaction-code counts (S and P) in non-derivative rows; grants and exercises are not counted as purchases, and one filing can contain many transaction rows. Purchase transactions total 0 across the parsed record (0 shares, $0.00, zero buyers, zero recorded as officer purchases). Sale transactions total 32 across the record (1,431,599 shares, $34,724,280.30, seven sellers), five of them recorded as officer sales. In the year through October 2, 2026: no purchases and 20 sales (699,209 shares, $24,313,273.30). In the 90 days through October 2, 2026: no purchases and one sale (75,000 shares, $2,336,250.00) across 7 filings. The site's insider aggregate (compiled as of October 10, 2026, 90-day window) matches those 90-day figures exactly (zero purchases; one sale; $2,336,250.00; no last buy). "Never bought" in the headline is scoped to this parsed record, whose 66 filings are the coverage stated here.
- 13D/G lens: full-parse SC 13D/G aggregation and parsed filings (22 filings matching CUSIP 038169207 and issuer CIK 1144879, fourteen reporting persons in aggregate: 6 SC 13G originals, 11 SC 13G/A amendments and 5 SC 13D/A amendments), filings through July 31, 2026. All five 13D/A amendments are Wesley Cummins's rows (22,254,970 shares at 10.0% as of March 26, 2025; 22,176,070 at 8.5% as of September 3, 2025; 21,154,050 at 7.4% as of October 31, 2025; 21,154,050 at 7.6% as of January 6, 2026; 22,042,487 at 7.6% as of July 7, 2026, filed July 8, 2026; share change from the January row +4.2% = (22,042,487 / 21,154,050) − 1). The Vanguard Group's rows (12,760,035 shares at 6.04% as of December 31, 2024; 24,168,082 at 8.65% as of December 31, 2025; 0 shares at 0.0% as of March 13, 2026, filed March 26, 2026), the separate Vanguard Portfolio Management rows (14,996,742 shares at 5.36% as of March 31, 2026; 13,768,802 at 4.81% as of June 30, 2026, filed July 31, 2026 — a different reporter name, reported as filed and not merged with The Vanguard Group's rows; change −8.2% = (13,768,802 / 14,996,742) − 1), Hood River Capital Management LLC's rows (15,147,422 at 7.17% as of December 31, 2024; 22,037,431 at 7.89% as of December 31, 2025; change +45.5% = (22,037,431 / 15,147,422) − 1), JANE STREET GROUP, LLC's rows (11,616,116 at 5.0% as of June 10, 2025; 14,120,497 at 5.5%; 17,067,159 at 6.1%; 20,743,643 at 7.0%; 20,886,105 at 7.1% as of March 31, 2026; change from the first row +79.8% = (20,886,105 / 11,616,116) − 1; affiliated Jane Street entities file joint rows in the same filings), BlackRock, Inc.'s rows (15,419,134 at 7.3% as of December 31, 2024; 12,199,793 at 4.3% as of June 30, 2026, filed July 27, 2026; change −20.9% = (12,199,793 / 15,419,134) − 1) and CoreWeave, Inc.'s rows (13,062,521 shares at 5.5% as of May 28, 2025; 0 shares at 0.0% as of June 10, 2025, filed June 12, 2025) are reported as filed. No rows are summed, because the aggregation's totalSharesReported field (431,220,187 shares) adds group members and different dates together and would multiply-count single positions. No reason for any change is asserted — the filings themselves are the record.
- Congress lens: Senate PTR archive and House PTR archive as maintained on this site, combined record as of October 3, 2026 — no Applied Digital record: no purchase transactions, no sale transactions and no member rows in the combined aggregate. The House aggregate (as of October 3, 2026) and the Senate aggregate (as of October 1, 2026) each carry no Applied Digital record, and we report that absence in both chambers rather than omitting the lens. Congressional disclosures report value ranges, so where this lens has data for other names it records direction and counts only.
- Short interest lens: FINRA Equity Short Interest files (biweekly settlement dates), collected directly from FINRA's public distribution; the Applied Digital series covers 135 settlements from January 29, 2021 to September 15, 2026. The maximum of the full collected series is 86,580,036 shares on January 30, 2026 — inside the chart window — so the latest reading of 57,863,931 shares on September 15, 2026 sits 33.2% below the peak ((57,863,931 / 86,580,036) − 1) and 15.7% below the September 15, 2025 reading of 68,679,087; the change from the prior settlement (58,427,815 shares on August 31, 2026) is −0.97%, and the change since the June 30, 2026 settlement (70,993,690 shares) is −18.5%. The latest row's prior-settlement field (58,427,815) matches the prior settlement file's reported figure exactly. The earliest settlements in the series (from January 29, 2021, a few thousand shares) predate the company's April 2022 listing in our price file and are reported as collected. FINRA publishes each settlement about two weeks after the fact. The share-count ratio uses the fundamentals file's share count of 291,469,112 shares outstanding as of July 28, 2026.
- Fundamentals note: our fundamentals collection carries Applied Digital's revenue of $144,193,000 labelled fiscal 2025, its net income of −$149,274,000 labelled fiscal 2024, and its assets of $9,929,312,000 labelled fiscal 2026 — the file carries a different fiscal year for each field, and we state each with the year the file assigns it rather than blending them into one fiscal year. The market value of about $7.39 billion uses that file's October 6, 2026 price ($25.34) and reported share count; our daily-close file ends October 2, 2026 at $25.38, and we keep the two files' figures separate rather than blending them.
- Prices: our own daily-close file for Applied Digital through October 2, 2026 ($25.38 close, +3.5% year to date on that file; 252-session closing high $49.65 on May 28, 2026; 252-session closing low $20.545 on March 30, 2026; closes of $23.74 at March 31, 2026 and $37.30 at June 30, 2026, a second-quarter change of +57.1%; change from June 30 to October 2 of −32.0% ((25.38 / 37.30) − 1)). The drawdown from the 252-session closing high is −48.9% ((25.38 / 49.65) − 1), and the gain from the 252-session closing low is +23.5% ((25.38 / 20.545) − 1).
- Market context sources: fiscal first-quarter 2027 results (revenue of $341.9 million, up 322% year over year, against a FactSet consensus of $116.3 million; adjusted loss of $0.01 a share against a consensus loss of about $0.29; GAAP net loss of $221.0 million against $18 million a year earlier; adjusted EBITDA of $64.4 million; cash of $3.7 billion and debt of $6.4 billion as of August 31, 2026) — the company's October 7, 2026 announcement as covered by Barron's and earnings summaries, checked October 10, 2026, summarised in our own words; contracted lease base (about 1.41 GW of critical IT load across five campuses, about $36 billion of base-term contracted revenue, about $86 billion if all renewal options are exercised; 250 MW live at Polaris Forge 1; $1.59 billion of 7.000% senior secured notes due 2031 issued toward the next building) — company statements as covered in the same reporting, checked October 10, 2026; results-day trading (close of $23.81 on October 7, 2026, down 6.04% on the day, followed by after-hours and premarket gains) — market coverage of the print, checked October 10, 2026; search and attention ranking (Applied Digital named first among five stocks trending among retail traders and investors in Benzinga's October 8, 2026 radar list, ahead of Webull, Super Micro Computer, Micron and Caterpillar; AltIndex's Reddit top 20 and meme-stock top 10 and Insider Monkey's Google search-volume top 20 were each fully covered or skipped in this series through their last names, and SELLAS Life Sciences, tenth on AltIndex's meme list, was skipped in this run for having no fundamentals record, no price file, no full-market 13F row and no 13D/G aggregate) — Benzinga, AltIndex and Insider Monkey, checked October 10, 2026. Figures we could not confirm against two sources were left out.
- Applied Digital is in the GetCoattail stock-page universe: Applied Digital Corp. (APLD) stock page. Series data: apld_lens_data.csv · apld_short_interest_series.csv. Earlier audits: The Wendy's Company · T-Mobile US, Inc. · IREN.
Past patterns are not a promise of future results. For education only — not investment advice.
This article describes public filings as of the dates stated. It is not investment advice and makes no recommendation. Filings lag reality: 13F positions are as of June 30, 2026, and later trading is not yet public.
Revision history
- v1.0 — October 10, 2026: first publication.