GetCoattail Research — four of five congressional stock buys land in a stock the superinvestors also hold. It looks like copying. We built the tests a copycat pattern would have to pass — a popularity baseline, a correlation check, and a performance score — and none of them finds it.
Start with the number that invites the story. Of 4,574 congressional stock purchases disclosed for trades between January 2025 and June 2026, 3,692 — 80.7% — are in tickers at least one of 81 tracked superinvestors held in mid-2026. Read the shared names and it looks like a shadow portfolio: Nvidia drew the most buys, Microsoft is held by 37 managers, and every stock held by 20+ managers was bought by Congress.
But two sets can overlap for two reasons. One is imitation. The other is arithmetic: two large pools, tilted toward the same big, liquid names, will share most of them without anyone following anyone. This article measures the overlap, then asks which reason the numbers support. The answer: the overlap is real — and it is the size popularity alone predicts.
How we measured the overlap
The congressional side. Every stock purchase row in Periodic Transaction Reports from both chambers, for trades dated January 1, 2025 through June 30, 2026: 4,574 buy rows covering 1,056 tickers, filed by 81 members — 17 senators and 64 representatives. Senate reports are counted once, at their latest amended version (685 of 706 reports), the convention of our earlier Senate work; House reports come from the Clerk's PTR archive. PTRs disclose amount brackets, not share counts, so everything is counted in rows and tickers, never dollars. Excluded: 430 Senate buy rows with no ticker, and 476 House documents surviving only as unreadable scans.
The superinvestor side. The 13F portfolios of 81 large, mostly long-only managers, collected directly from SEC EDGAR as of June 30, 2026. Long common stock only: 1,814 tickers, $1.14 trillion combined. We removed 114 bond-like lines and 17 option rows before matching. Holder counts are managers, not rows: two share classes of one name count once.
The snapshot warning, up front. A 13F is a photograph dated June 30, 2026; a purchase from January 2025 is matched against a holder list from eighteen months later. "Overlap" means a name sits in both sets — it says nothing about who moved first, and we use no verb that implies otherwise. That limitation shapes every result below.
The baselines. To judge whether the overlap exceeds popularity, we drew tickers from the managers' 1,814 without replacement, ten thousand times: uniformly, and weighted by each ticker's combined dollar value. Each draw takes 1,056 tickers, the number of names Congress bought; as a sensitivity, the weighted draw also runs at 688 — the overlap's own size. A copycat pattern has to beat the popularity baselines, not just the uniform one.
Result 1: the overlap is big — on the surface
The two sets share 688 tickers: 65.2% of everything Congress bought, 37.9% of everything the managers held. Weighted by buy rows, the typical purchase sits in a stock held by 6.74 managers. At the consensus end the meeting is total: all 11 tickers held by 20+ managers were bought by Congress, and 48 of the 52 held by 10+ (92%).
| Ticker | Superinvestors holding | Their combined value | Congressional buys | Members buying |
|---|---|---|---|---|
| MSFT | 37 | $14.7B | 78 | 25 |
| GOOGL | 36 | $43.8B | 34 | 15 |
| AMZN | 34 | $20.8B | 75 | 25 |
| GOOG | 34 | $30.9B | 41 | 10 |
| META | 31 | $14.8B | 50 | 21 |
| V | 30 | $22.6B | 32 | 13 |
| BRK.B | 26 | $16.2B | 22 | 10 |
| TSM | 24 | $9.7B | 23 | 8 |
| AAPL | 22 | $74.9B | 59 | 22 |
| MA | 22 | $6.1B | 10 | 7 |
The shared top: tickers ranked by superinvestor holders (2026Q2 13F, of 81 managers). Congressional buys are disclosed purchase rows for trades Jan 2025–Jun 2026. The full 2,182-ticker table (overlap_by_ticker.csv) is published with this article.
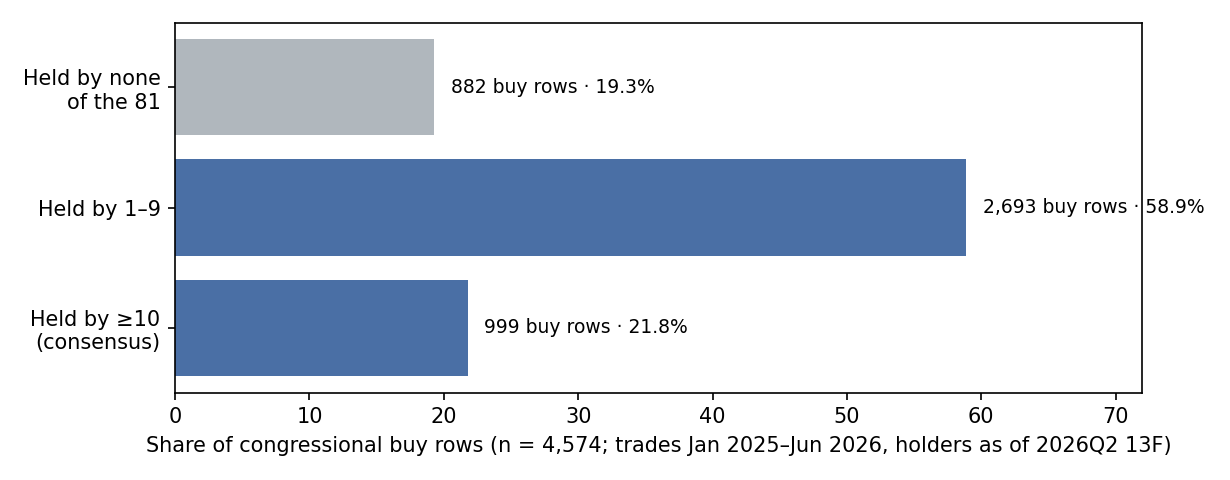
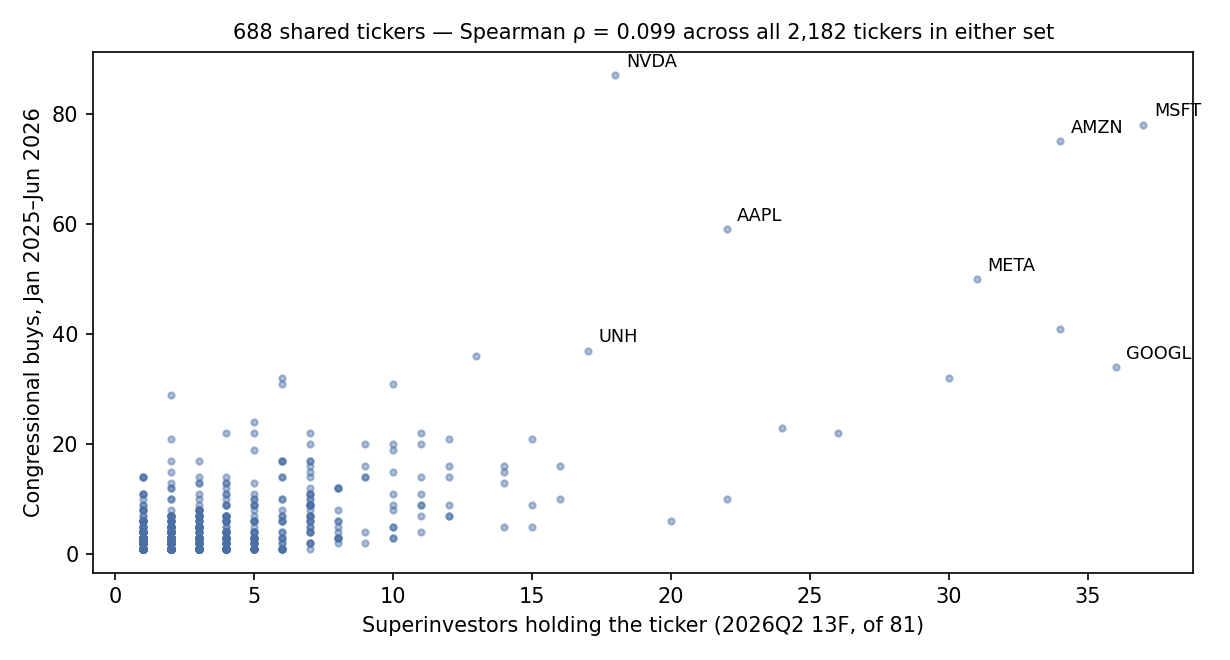
By buy count the leaders are the household names — Nvidia 87 buys (21 members; 18 managers hold it), Microsoft 78, Amazon 75, Apple 59, Meta 50. The breadth is genuine: 136 shared tickers were bought by five or more members, 32 by ten or more. But look at where the rows sit: only 21.8% are in consensus names (10+ holders); 58.9% are in names held by one to nine managers, and 19.3% in names none of the 81 held at all. The centre of gravity is the middle, not the consensus.
Result 2: the overlap is the size popularity predicts
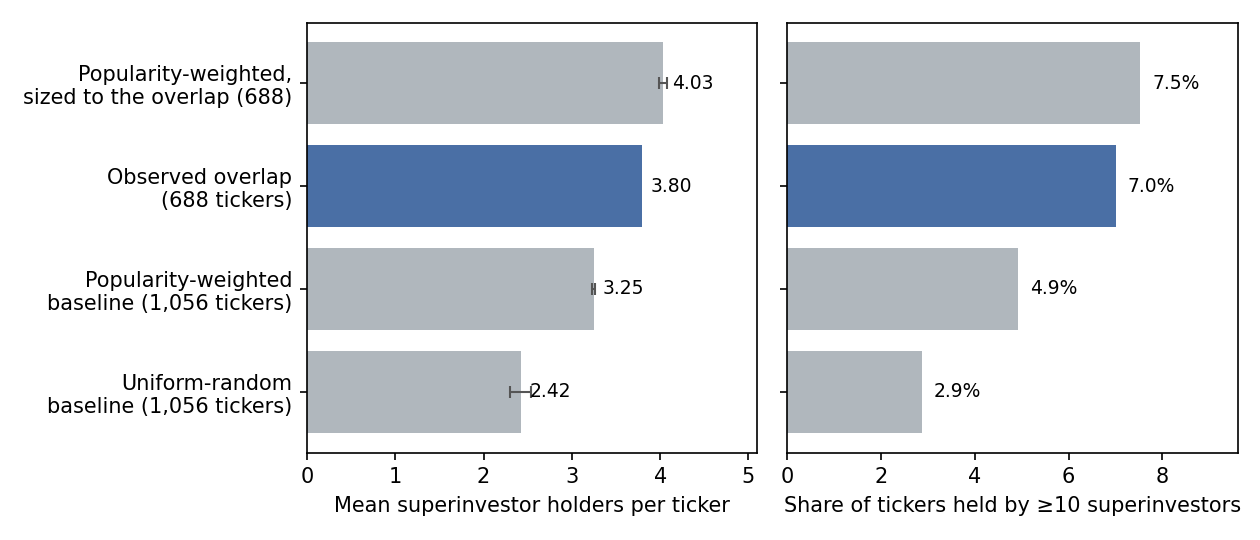
The 688 shared tickers average 3.80 holders, median just 2. The uniform baseline — 1,056 tickers drawn without replacement from the managers' 1,814 — expects 2.42 holders; the observed mean sits above all ten thousand uniform draws. The popularity-weighted version draws with probability proportional to the dollars behind each name, and expects 3.25 holders [95% range 3.23–3.27], with 4.9% of drawn tickers held by ten or more managers. The observed 3.80 and 7.0% clear that bar too, in every draw.
One size down, the same test reverses. Run the popularity-weighted draw at 688 tickers — the size of the overlap itself — and it concentrates harder on the biggest names: the expectation rises to 4.03, and the observed 3.80 falls below it in every draw. Which size is right is a modelling choice, not a fact: 1,056 is how many names Congress bought; 688 how many the managers held. Because the sign of the excess flips with that choice, the overlap's level cannot carry a copycat verdict either way. What it does establish is a range: no large, unexplained pile-up on consensus stocks.
The ticker-level data are where a copycat pattern would have to show up, and they are flat: across all 2,182 tickers in either set, the rank correlation between how many managers hold a stock and how often Congress buys it is ρ = 0.099 — close to none. The shared set itself is mostly obscure to the consensus: 640 of the 688 overlap tickers are held by fewer than ten managers. The overlap is not a story about famous names; it is 688 ordinary overlaps plus a megacap crust.
The headline ratio is not a window artefact: over the full 2021–2026 record (10,958 buy rows), 77.5% of buys are in manager-held names; for 2025 alone, 80.8%; for first half of 2026, 80.5% — a 77–81% band however the window is cut. (Average holder counts of shared names rise in recent windows — 4.01 in 2025, 4.67 in early 2026 — but mechanically: trades nearer the June 2026 snapshot match a current holder list more easily. Not a trend.)
Result 3: the two worlds that never meet
The non-overlap is stranger than the overlap. Start with the 368 tickers Congress bought that none of the 81 managers held — 882 buy rows. Only 20 of the 368 are in the S&P 500 top 300, and not one has a price file in our 1,634-ticker research universe. Its leaders are a bitcoin ETF bought 22 times by one senator (Bitwise's BITB), a 3× leveraged small-cap ETF bought 13 times by one member, a high-yield bond ETF (11 buys, one member), a bitcoin ETF (IBIT, 11 buys, three members), and an Ohio regional bank (FMAO, 8 buys, one member). The exceptions prove the shape: Ford drew 20 buys from five members and Robinhood 14 from six, yet none of the 81 managers holds either. Much of the "congress-only" leaderboard is one member's repeated habit, not a congressional pattern — and 30 of the 368 names are stocks at least one manager had exited during the second quarter, a sequence a quarterly snapshot cannot order.
The other direction is bigger. The managers held 1,126 tickers — 62.1% of their universe — that no member of Congress bought, and the untouched part is thick with high-conviction names: Moody's, held by 17 managers with $20.0 billion combined; Berkshire Hathaway's A shares, also 17; Sunbelt Rentals Holdings, 12. "Congress and Wall Street look at the same stocks" is true of a minority of the institutional world — the most popular minority.
Result 4: did the shared names pay?
We scored the buys with the pre-registered rule from our Senate-vs-House study: enter at the close on the first trading day after the filing becomes public, hold 60 trading days, measure excess over SPY. Groups are assigned by the ticker's holder count in the 2026Q2 snapshot — a classification made after many of the trades, taken seriously in the caveats below.
| Group (2026Q2 holders) | Signals scored | Mean 60-day excess vs. SPY | Median | Beat SPY | 95% CI of the mean |
|---|---|---|---|---|---|
| Held by ≥10 superinvestors | 922 | +1.35% | +0.43% | 51% | [+0.35, +2.35] |
| Held by 1–9 superinvestors | 2,260 | +0.22% | −2.48% | 44% | [−0.67, +1.12] |
| Held by none | 0 of 882 buy rows — no price data | — | — | — | — |
Performance of disclosed congressional buys by the bought ticker's superinvestor-holder group. Signals: trades Jan 2025–Jun 2026, filed Jan 2025–Sep 2026. Group difference (≥10 minus 1–9): +1.13 percentage points, 95% CI [−0.22, +2.47].
Buys in consensus names did fine: +1.35% over SPY on average, interval clear of zero. But the comparison that would make "overlap" itself the story fails: the gap against thinly held names is +1.13 points with an interval including zero, so there is no evidence the consensus buys did better — and the consensus figure is the same size as congressional buying in general in the earlier study (Senate +1.46%, House −0.07%), so nothing separates "the overlap" from "the buys." Two holes matter more than the point estimates. First, the natural control group — 882 buys in names no manager held — cannot be scored at all: none of those tickers has price data, so every performance claim covers only the priced, large-cap-tilted universe. Second, the scored groups are incomplete: 77 consensus-group and 433 few-holder signals went unscored for missing prices or a window running past the data.
What this data cannot tell you
Who moved first. The 13F is one snapshot. In 220 of the 688 shared tickers, at least one manager newly entered during the second quarter of 2026 — 311 new positions, many opened after the congressional buys they now "overlap." Size explains the data without any following in either direction, and this design cannot detect following even where it happened. What the aggregate tests rule out is a large unexplained pattern — a holder level inside the popularity range, a near-zero correlation, no performance gap — not every possible instance of one member watching one manager.
Whether the unscored fifth was any good. The 368 congress-only tickers sit outside our price universe — small caps, recent listings, ETFs. They are 19.3% of buy rows, and nothing in Result 4 describes them.
What "the institutions" think. The 81 managers are a selected set of large, mostly long-only investors — not the market. Shorts, options and intra-quarter trading are invisible. PTR amounts are ranges: the smallest disclosed purchase and a very large one are both one row. Three ticker aliases (mergers and rebrands) were matched by company name; any we missed shrink the measured overlap slightly.
How to use this on GetCoattail
- 1. Read pairings as popularity, not coordination. On our stock pages, "held by N superinvestors" and "bought by members of Congress" appear side by side. After this test, the pairing is a size reading: a name held by 30 of 81 managers and bought on Capitol Hill mostly tells you it is a megacap. The informative cases are the exceptions — widely held but never bought, or bought with no holder at all — and the published CSV filters both directions.
- 2. Don't pay for the overlap as a signal. Consensus-name buys scored positively, but no better than congressional buys generally, and the one group that could prove the point can't be scored. Treat overlap as context, not an edge.
Related reading: 866 Senate Stock Trades vs. $55 Million in One Stock — who trades, who holds, and why the two leaderboards disagree; 32 Days vs. 953: How Late Are Senate Stock Trade Disclosures? — why the dates on these filings are themselves a measurement problem.
Methodology and data
Congressional purchases are stock purchase rows in U.S. House and Senate Periodic Transaction Reports (House Clerk PTR archive; Senate eFD), trades dated Jan 1, 2025–Jun 30, 2026 (4,574 rows, 1,056 tickers, 81 members). Senate reports (706 filed) are counted once at their latest amended version (685 reports; the restated report must reproduce at least 80% of the earlier report's stock rows by row signature), leaving 4,246 Senate stock rows of all types, of which 1,764 are purchases with tickers; 430 Senate purchases without tickers and 476 House documents surviving only as unreadable scans are excluded. Three ticker aliases were unified by company name (BK→BNY, SQ→XYZ, FI→FISV; 55 rows). Superinvestor holdings are long common-stock positions in Form 13F filings of 81 managers collected from SEC EDGAR, as of Jun 30, 2026: 1,814 tickers, $1,139.7 billion combined, after removing 114 bond-like lines, 17 option rows and 60 rows without tickers; holder counts are distinct managers per ticker (a manager holding two share classes of one name counts once). Baselines are 10,000 Monte Carlo draws without replacement from the 1,814: uniform and weighted by combined dollar value, each drawing 1,056 tickers, plus the weighted draw at 688 tickers as a size sensitivity (seed fixed in the published code). Performance scoring follows the pre-registered Senate-vs-House rule — entry at the next trading day's close after filing, 60-trading-day hold, excess over SPY — with groups assigned by the 2026Q2 snapshot holder count; 882 buy rows in tickers with no price file are unscored. The full ticker-level table (overlap_by_ticker.csv) and the scored signals (signals_scored.json) are published with this article.
- Data file: all 2,182 tickers in either set — superinvestor holders and combined value, congressional buys and members buying (CSV).
- Data file: the scored congressional buy signals behind Result 4, with 60-day excess returns vs. SPY (JSON).
Past patterns are not a promise of future results. For education only — not investment advice.
Revision history
- v1.0 — October 7, 2026: first publication. Pre-publication revision (from independent verification): the popularity baseline was redesigned. The first draft's weighted baseline came from a with-replacement draw reduced to its unique names — a far smaller, megacap-concentrated set than the without-replacement draw the text described — and the article's "below the baseline" verdict rested on it. The baselines reported here are the described ones, all without replacement, and the verdict now rests on the correlation and performance tests, with the baseline level shown to depend on the draw-size conditioning. Separately, the managers-only list's third entry was corrected: the ticker belongs to Sunbelt Rentals Holdings (not Sun Communities), held by 12 managers rather than 13 holding rows, and the Senate processing tallies follow the independent recount. No other figure changed.