Every trading member of Congress has would-be copycats, and the pitch writes itself: these people see the legislation before it moves markets, so buy what they buy. Our earlier research tested that idea one trade at a time. This time we tested it the way a copycat would actually live it — as a portfolio. We took every stock purchase disclosed from 2021 through September 2026, entered each at the close on the first trading day after its disclosure became public, sold only when the same member later disclosed a sale of that stock, and let everything else ride. Then we scored each member's portfolio against the S&P 500 (SPY) over the identical span.
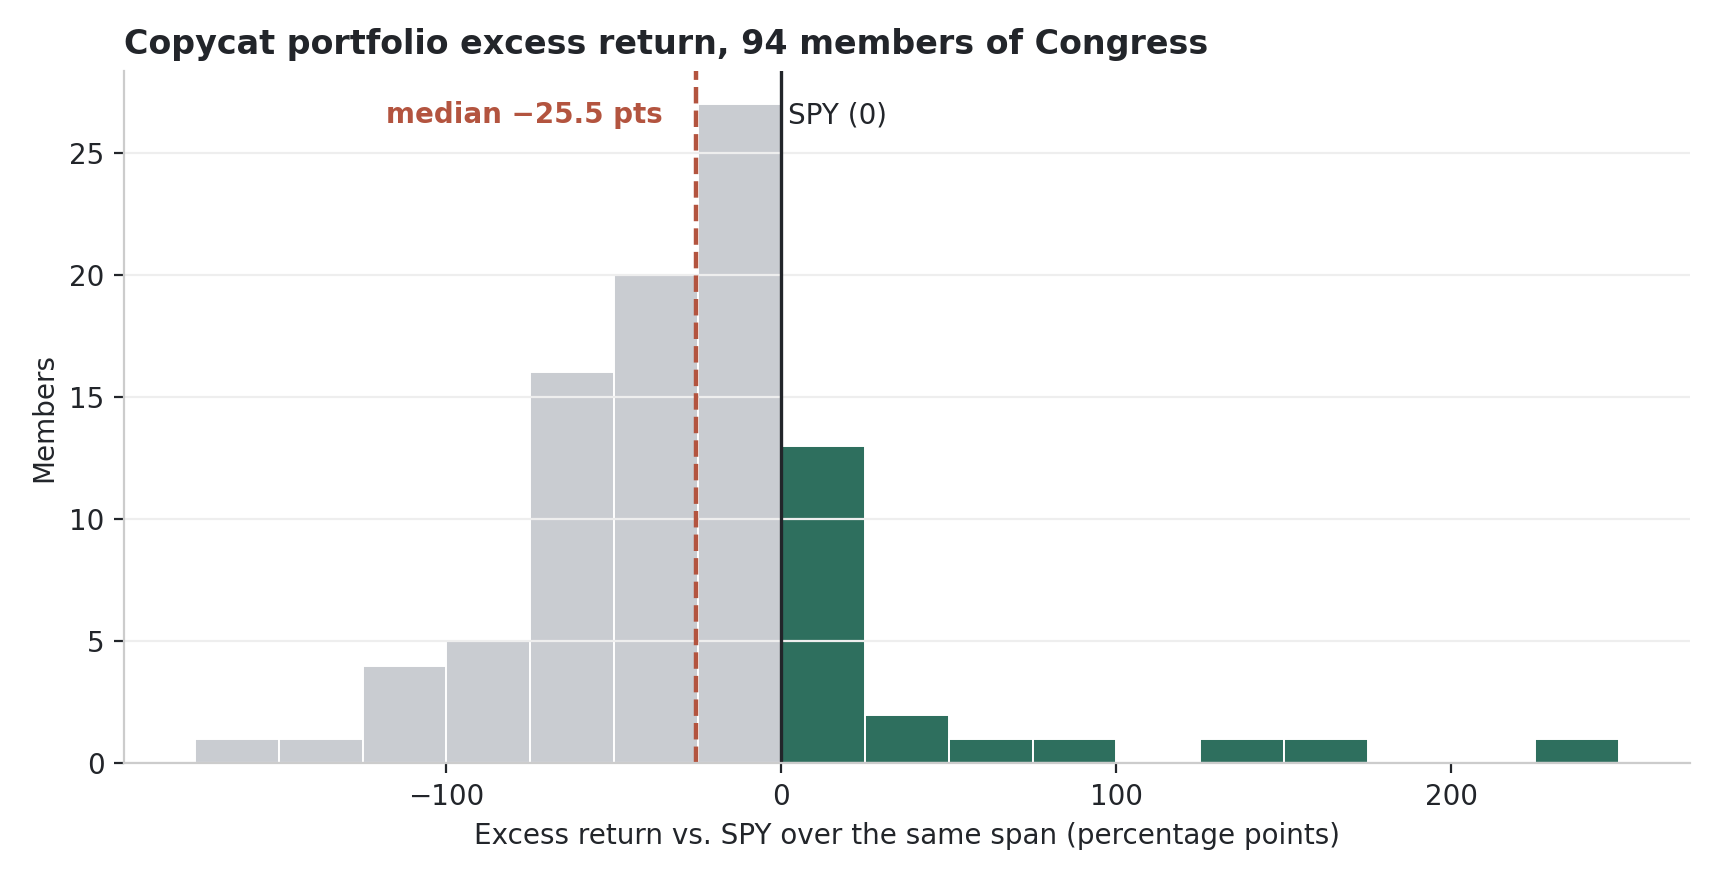
The median portfolio gained 54%. It also lost to the index by 25.5 percentage points, because SPY gained about 95% over the median member's span. Only 20 of the 94 members we could score beat the index at all. Read the 54% carefully: it is cumulative over years, not per year. The median member's clock ran 5.1 years (the longest, 5.7), so the median portfolio compounded at about +10.8% a year — against +14.6% a year for SPY over the same spans. Even the gain was a slower gain.
The scoreboard
The population is every stock purchase on a Periodic Transaction Report filed between January 1, 2021 and September 30, 2026 — 11,277 purchases by 153 members after removing duplicates created by amended filings. Of those, 10,599 could be scored (678 had no usable price history or failed a data-integrity check described below). The scoreboard covers the 94 members with at least ten scored purchases — 10,391 positions between them. Each purchase counts once, at equal weight, because disclosures report amounts only as ranges: nobody outside the member's household knows the real position sizes.
The result is not a near miss. A bootstrap confidence interval for the median excess runs from −36.2 to −12.6 — nowhere near zero — and the mean member did no better (−24.3). Even the member at the 75th percentile trailed the index slightly (−1.5). Just five members beat SPY by more than 50 points, while 27 trailed by more than 50. If stock-picking were a coin flip against the index, seeing only 20 winners out of 94 would be a roughly one-in-fifty-million accident (sign test, p ≈ 1.8×10⁻⁸). Whatever this is, it is not noise around a tie.
Why this doesn't contradict our +1.46%
Readers of our Senate-vs.-House study will remember a friendlier number: copied after disclosure and held for exactly 60 trading days, Senate purchases beat the S&P 500 by +1.46% on average (817 purchases; 95% CI +0.33% to +2.59%), while House purchases matched it (−0.07%, 6,044 purchases). Both results are real. They answer different questions, and the gap between them is mostly arithmetic, in four parts.
The unit of account. The +1.46% is an average across trades, and trade averages are carried by a right tail — the median Senate trade itself returned −0.03%. This study averages across members and reports the median. A tail can lift an average; it cannot lift a median.
The exit rule. The trade test sells everything after 60 trading days, winners and losers alike. A portfolio has no such discipline: it exits only when the member discloses a sale — and 43.5% of all scored positions were never sold at all. The median position that was sold had been held 123 days; the median unsold position, 471 days and counting.
The clock. Sixty days is a sprint; these portfolios ran for up to five and three-quarter years against an index that roughly doubled. Compounding is unforgiving in both directions — it is how a portfolio can gain 54% and still finish 25 points behind.
Who supplies the trades. A trade-level average is dominated by the members who trade most; a member-level median is not. The five most active traders in the record — 324 to 895 scored purchases each — finished between +2.3 and −37.5 points of excess. The most active of all, Gilbert Cisneros (895 purchases), ranks 19th. Volume is not an edge; it is just volume.
The never-sold engine
The most important number in this study is a share, not a return: 43.5% of positions were never closed. They are valued at the September 30, 2026 close — a mark, not a result. And the marks are where the good news lives. The median position actually sold returned +0.5%; the median position still open is marked at +12.2%. Realized trading, at the median position, did approximately nothing; the paper gains sit in positions nobody sold.
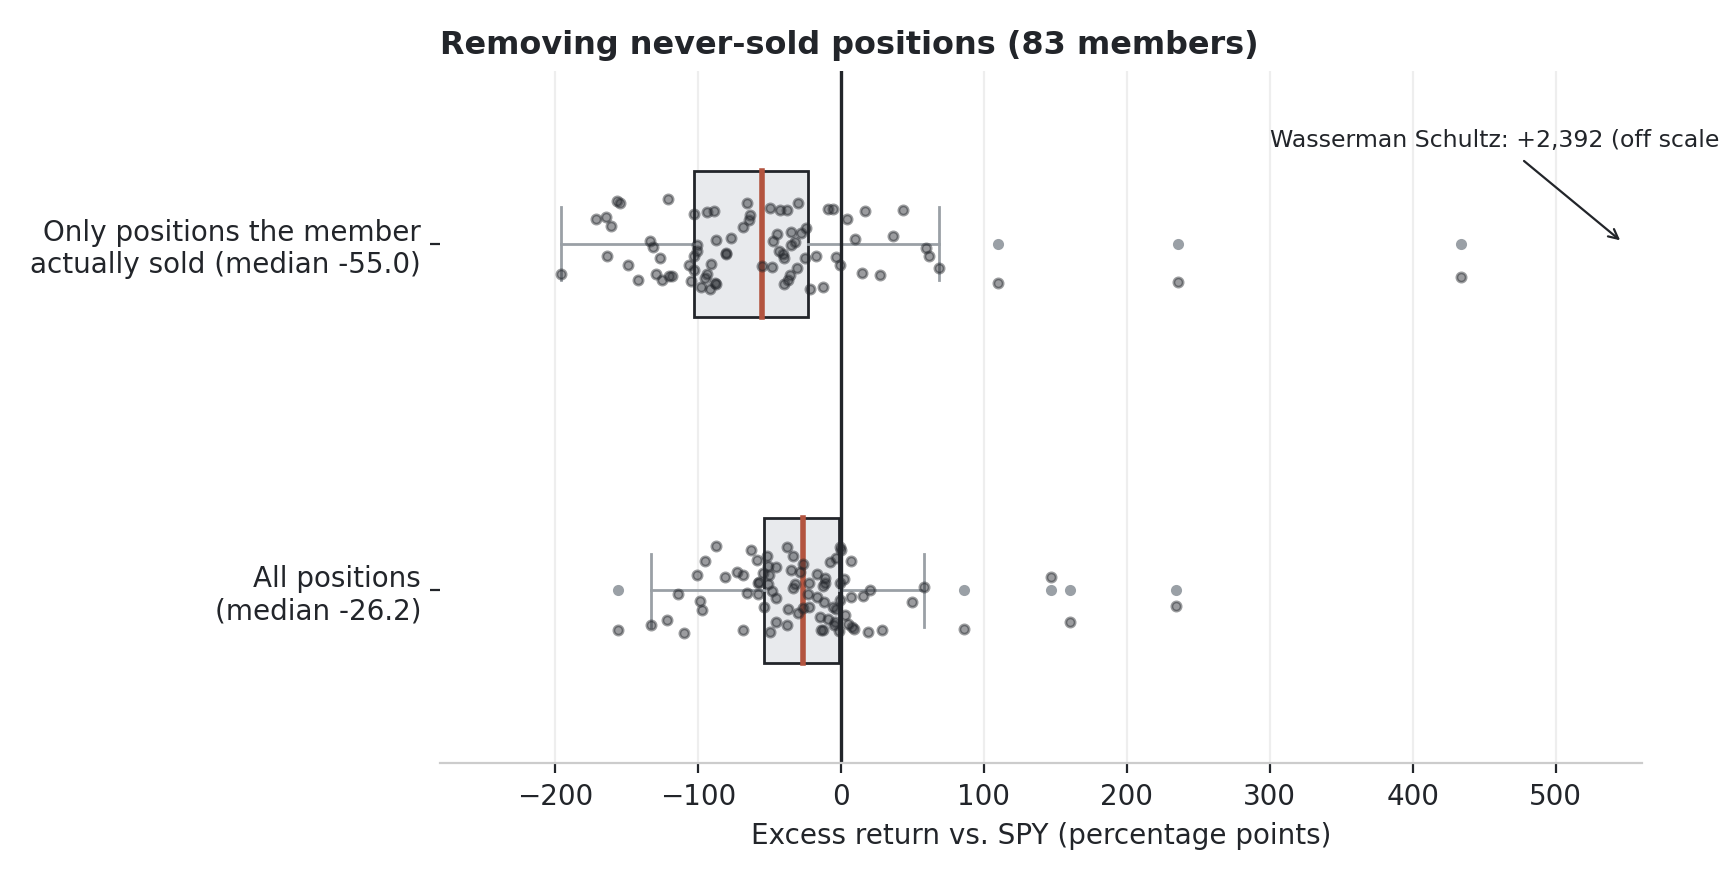
So we re-ran the simulation with never-sold positions removed — same members, same rules, only the positions each member actually closed. Among the 83 members who closed at least one position, the median excess falls from −26.2 to −55.0 points, and only 14 of 83 beat the index on realized positions alone. Ten of the 20 overall winners flip to non-winners: half the winning records are, in whole or in part, positions the member still holds. One caveat cuts the other way: in the closed-only run, a member who sold early sits in cash while the index keeps compounding, so early sellers are penalized twice. Treat −55.0 as the lower bound of a range whose upper bound is the headline −25.5 — the truth about realized performance is somewhere inside it, and neither end flatters the copycat.
Three portfolios
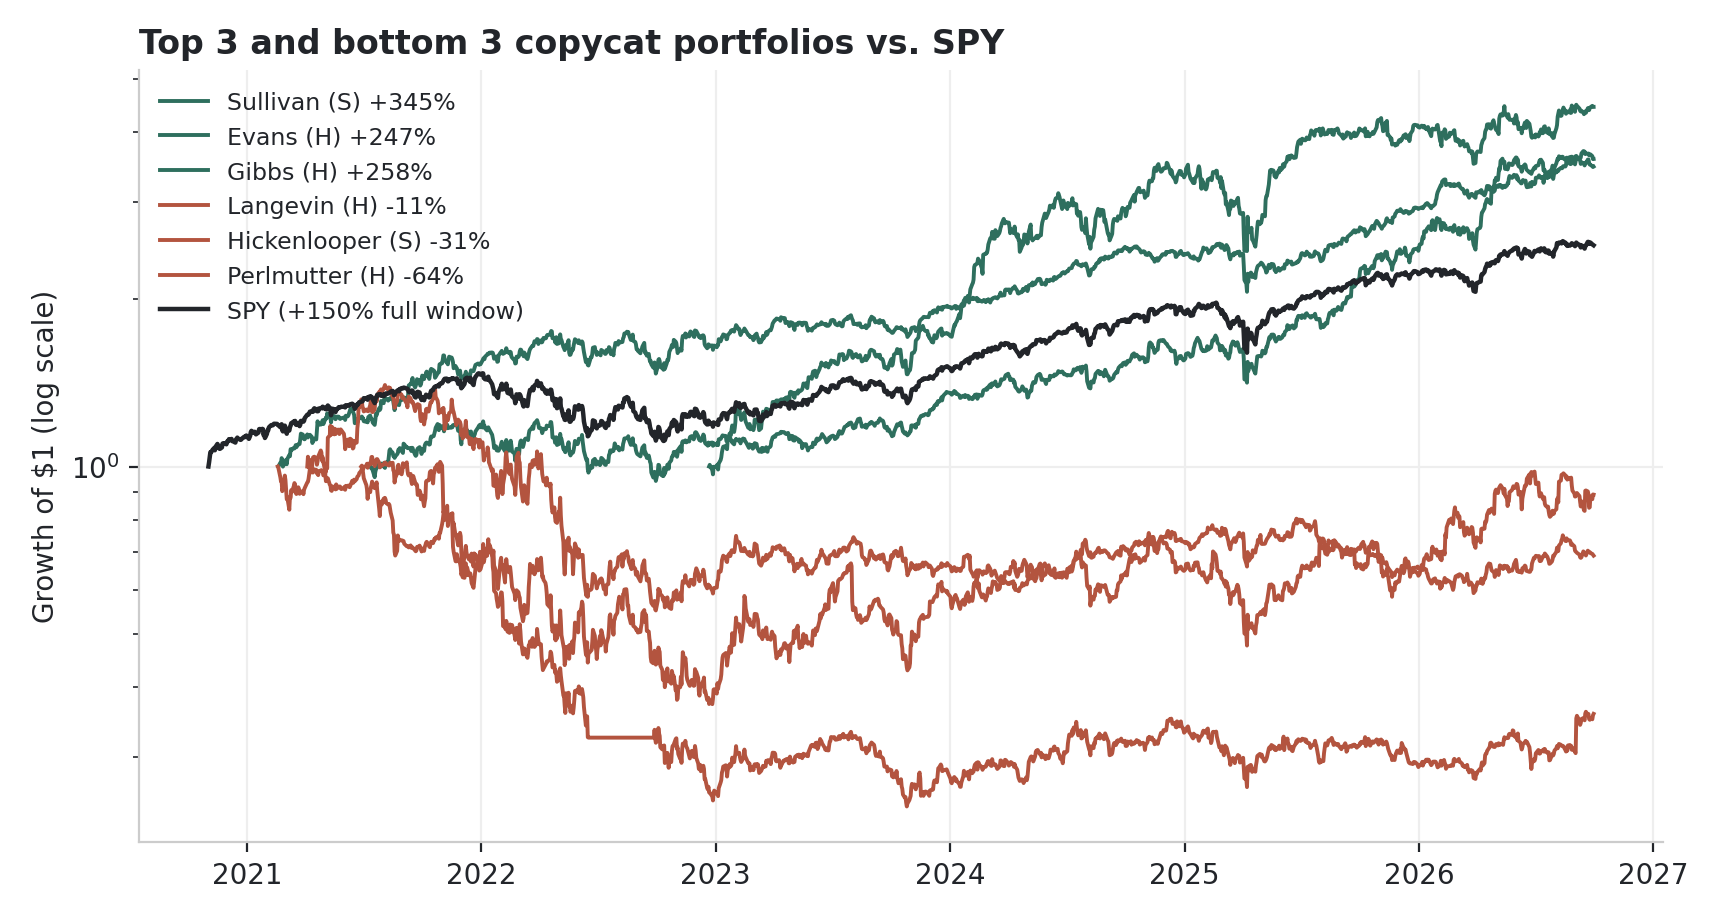
The winner: Dan Sullivan (Senate, R-AK), +234.7 points. Sullivan's record is a single basket bought at the right moment and one stock never sold. Eight positions were entered on one day — December 22, 2022, near the bear-market low (META, Amazon, Adobe, Alphabet, Microsoft, Apple, Disney, NVIDIA) — followed by a rotation in mid-2023. Twelve of his sell filings closed 17 of his 19 positions, at a 70.6% win rate, including Meta at +166%. But after September 25, 2023, the portfolio is two unsold positions: Disney (+24.8% at the mark) and NVIDIA, entered at $15.29 and marked at +1,393.9%, never sold. For three years, the daily "portfolio" was effectively those two stocks. Strip the never-sold positions out and his closed-only excess is −64.0 — the mirror image of the headline. Nearly all his disclosed buys sit in the smallest amount bracket ($1,001–$15,000), which is why this study weights every position equally: the filings cannot tell us which of his positions were large.
The median: David Perdue (Senate, R-GA), −24.9 points. Perdue is the typical case almost to the point of parody. His portfolio gained +71.4% — and SPY gained +96.2% over his span. He filed 179 sales during the window, yet not one of his 29 scored purchases was ever closed by a disclosed sale inside it. His entire score is mark-to-market on positions never sold.
The worst: Ed Perlmutter (House, D-CO), −155.5 points. Perlmutter's portfolio didn't just trail; it lost 64.2% of its value while the index gained 91.4% over his span. Six of his eleven scored purchases were closed, at a 16.7% win rate. Not every bad record is a benchmark illusion — some of it is simply losses.
And the name everyone asks about: Nancy Pelosi ranks 5th of 94, at +58.1 points (+173.2% against SPY's +115.0% over her span). Unusually for this table, her record survives the realized-only test too — her closed positions alone beat the index by +43.7 points, at an 80% closed win rate. She is one of the exceptions — and even the exception ranks fifth, with 19 of her 29 positions still open.
| Member | Scored buys | Closed / still open | Closed win rate % | Portfolio | SPY same span | Excess (pts) |
|---|---|---|---|---|---|---|
| Sullivan, Dan (S, R-AK) | 19 | 17/2 | 70.59 | +344.7% | +110.0% | +234.7 |
| Evans, Dwight (H, D-PA) | 20 | 14/6 | 85.71 | +247.1% | +87.2% | +160.0 |
| Gibbs, Bob (H, R-OH) | 16 | 4/12 | 50.0 | +258.2% | +111.1% | +147.1 |
| Guest, Michael Patrick (H, R-MS) | 43 | 7/36 | 28.57 | +160.8% | +74.6% | +86.2 |
| Pelosi, Nancy (H, D-CA) | 29 | 10/19 | 80.0 | +173.2% | +115.0% | +58.1 |
| Perlmutter, Ed (H, D-CO) | 11 | 6/5 | 16.67 | −64.2% | +91.4% | −155.5 |
| Hickenlooper, John (S, D-CO) | 25 | 16/9 | 62.5 | −30.9% | +102.0% | −132.9 |
| Langevin, James R. (H, D-RI) | 19 | 17/2 | 23.53 | −11.0% | +110.7% | −121.7 |
| McKinley, David B. (H, R-WV) | 10 | 4/6 | 25.0 | −0.6% | +113.0% | −113.6 |
| Lowenthal, Alan S. (H, D-CA) | 51 | 36/15 | 50.0 | +1.1% | +110.8% | −109.7 |
Table 1 — Top five and bottom five of the 94-member scoreboard. Full data: congress-portfolios.csv (published with this article and on the Track Record page).
Who the 20 winners are — and aren't
The winners are not who the signal study would have pointed to. Senators supplied the +1.46% trade-level headline, but at portfolio level the chambers are indistinguishable and both negative: Senate members' median excess is −26.3 (n=17), House members' −22.5 (n=77). Three of the 20 winners are senators, roughly their share of the table. Descriptively, the winners traded less than the rest (a median of 36 scored purchases against 62) and held more of their book unsold (57.5% of positions still open, against 45.7%) — which says less about skill than about this market: in a market that roughly doubled, the winning move was mostly not selling. The same trait would have been the losing move in a falling market, and nothing here tells us the winners would repeat it in one.
Two splits we report because readers will ask, with the caution attached. Party medians differ (Republicans −12.0, n=52; Democrats −37.5, n=41), but members differ in era, sector mix and trading style along with party, and we modelled none of that — treat it as a description of these 94 portfolios, not evidence about parties. Nor is the ranking a strategy — we test below whether yesterday's winners keep winning. They do not.
Stress tests: five attempts to rescue the result
The scoreboard uses one rule set. Before publishing, we tried to break its conclusion five ways. Two design choices first: amount-midpoint weighting moves the median excess only to −23.3 points, and the membership cutoff barely matters (−26.2 points with everyone who has even one scored purchase, n=151; −19.5 at a 30-purchase cutoff). The five tests below work at trade level — one scored purchase per observation, every median with a bootstrap 95% confidence interval.
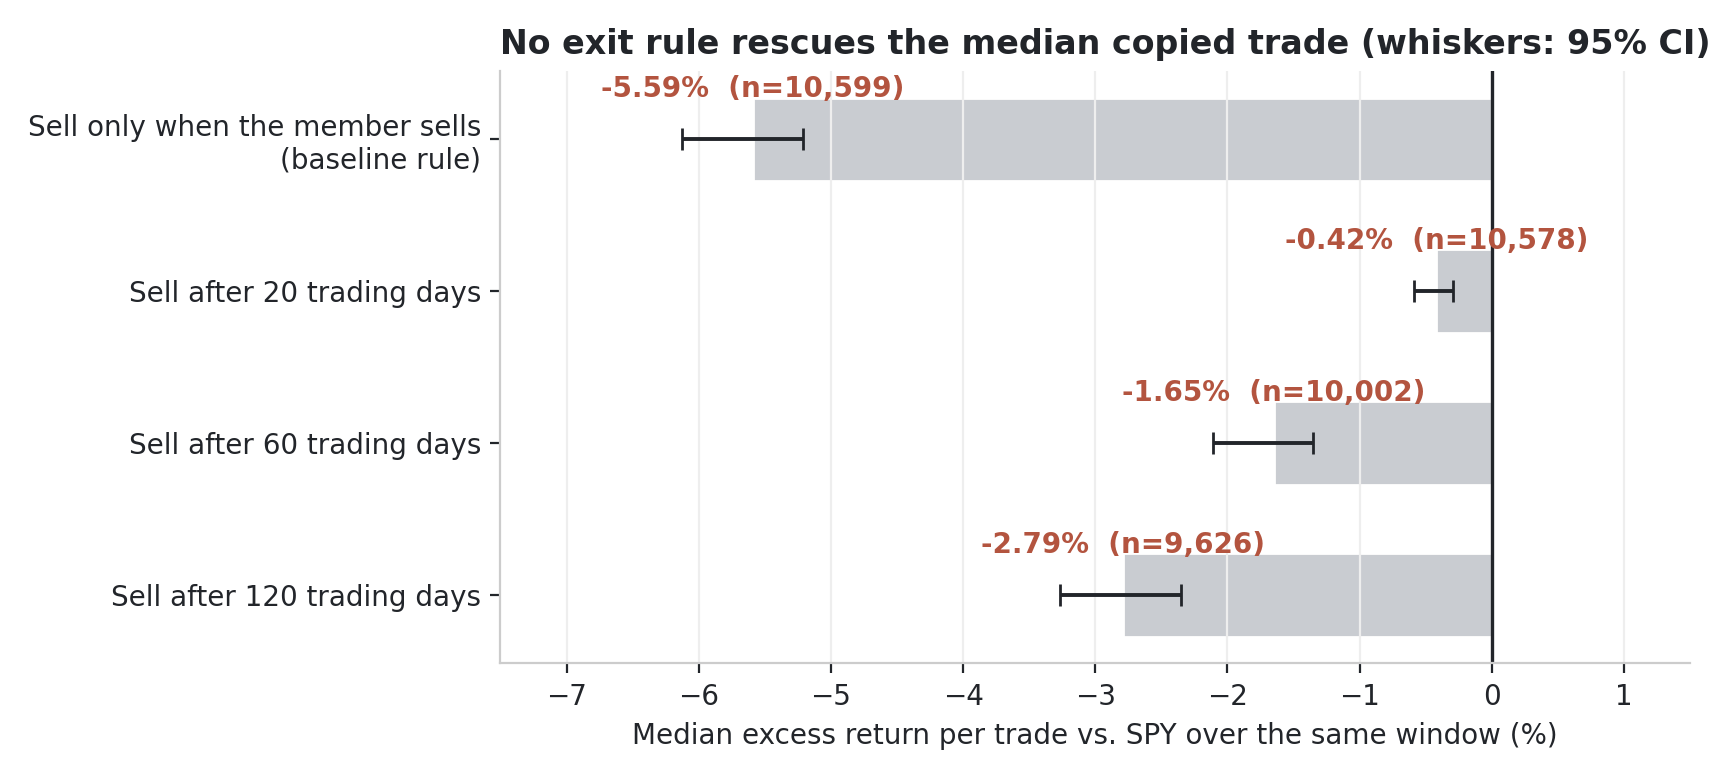
Change the exit rule. Holding each purchase for a fixed 20, 60 or 120 trading days instead of waiting for the member's own sale improves the median trade — and still loses. The median excess is −0.42% at 20 days (CI −0.59 to −0.29), −1.65% at 60 days (−2.11 to −1.35) and −2.79% at 120 days (−3.27 to −2.35), against −5.59% for the baseline rule. Every interval sits below zero: no exit rule rescues the median trade, and waiting for the member to sell is the worst exit tested. The one pocket that worked was a regime, not a rule: purchases entered during the 2022 bear market beat the index at the median at every fixed horizon (+0.6 to +1.2).
Follow only the big trades. If members bet larger on their best ideas, size should predict returns. It doesn't. Median 60-day excess by disclosed amount band runs −1.88% ($1,001–$15,000; n=8,011), −2.07% ($15,001–$50,000), +1.07% ($50,001–$100,000) and +0.03% (over $100,000) — not monotonic, and both large-band intervals include zero. No size effect to copy.
Follow only the past winners. We re-ranked members using filings through 2023 only (59 members with at least ten scored purchases), then scored only their trades filed from 2024 — a true out-of-sample test, no look-ahead. The top tenth's subsequent trades returned a median excess of −5.31% (n=94), worse than the −2.10% of everyone else; the top fifth did −3.09% against −2.08%. Both difference intervals include zero and point the wrong way. Three of the top six had stopped filing altogether by 2026. Past winners did not repeat.
Follow only the consensus. When at least two members bought the same stock within 30 days of each other, the median trade did measurably less badly: −0.56% versus −2.43% for solo purchases, a difference of +1.87 points whose interval (1.16 to 2.56) excludes zero. This is the one signal that survives — as a smaller loss. The consensus median itself is statistically indistinguishable from zero before costs and negative after the 0.2% round-trip cost we deduct in the data file. It narrows the gap; it is not an edge.
Blame the benchmark. Perhaps these portfolios simply hold more volatile, sector-tilted stocks, and SPY is the wrong yardstick. Re-measuring the 60-day test against each stock's own sector ETF (n=9,391) improves the median only to −1.01% (CI −1.30 to −0.76); adjusting each trade for its pre-entry beta (n=9,977) gives −0.98% (−1.27 to −0.68). Sector mix and market exposure explain roughly half a point of the shortfall. The rest is the picks.
What we can and cannot claim
We can claim this: over 2021–2026, under one published rule set, mechanically copying members' disclosed purchases trailed the S&P 500 for the large majority of members — the median by 25.5 points — and most of the outperformance that exists sits in positions never sold.
We cannot claim that members are bad investors. The simulation cannot see position sizes, hedges, options (excluded here), or the rest of a household's wealth; disclosures cover spouses and joint accounts, so a "member portfolio" is a household's disclosed slice, not a brokerage statement. Nor can we separate stock-picking from market exposure: a portfolio of high-beta names trails a doubling index on this arithmetic whenever its picks merely match their own risk class. And 632 purchases were dropped for missing price histories — those skew toward delisted and thin names, so if anything the scores above are flattered. Trading costs and taxes, which a real copycat pays on roughly ten thousand positions, are not modelled and would only widen the gap.
How to read a member's record
On GetCoattail's politician pages and the Track Record scoreboard, three habits will keep this data honest. First, read closed vs. still open before the headline return — a record that is mostly marks is a hypothesis, not a result. Second, compare every member against SPY over the same span, never against zero: in a market that doubles, "+54%" and "lost to the index" are the same sentence. Third, treat a member's disclosed sales as half the signal: a buy with no exit ever disclosed is an unfinished strategy, and copying only the buys imports that unfinished half into your portfolio.
The full scoreboard is published with this article (congress-portfolios.csv), together with the trade-level results file behind the stress tests (copycat-trade-results.csv), and maintained on our Track Record page. We will re-run this exact simulation as new filings land — same entry rule, same exit rule, same benchmark. If the median member starts beating the index, that page will say so.
Methodology and data
Sources. U.S. House Clerk and U.S. Senate eFD Periodic Transaction Reports filed 2021-01-01 to 2026-09-30; split- and dividend-adjusted daily closes. Entry at the close on the first trading day after the filing date. Exit when the member later discloses a sale of the same ticker (all open units of that ticker close at the next trading day's close; a sale and a buy in the same filing are processed sale-first); unsold units are marked at the September 30, 2026 close. Weighting: one disclosed purchase = one unit; daily portfolio return is the equal-weight average across open units, compounded; positions by amount-range midpoint are reported as a sensitivity. Benchmark: SPY over each member's own span (first entry to September 30, 2026); excess is the difference in cumulative returns, in percentage points. Exclusions, counted: 632 purchases had no usable price series; 46 were excluded because the first trade in the available series fell more than 15 days after filing — a guard against delisted names and recycled ticker symbols (a price series that resumes under a new company would otherwise fabricate returns); 476 House filings were scanned images that could not be machine-read and are outside the population. Options and non-stock assets are excluded throughout. Stress tests: trade-level, one scored purchase per observation; fixed-horizon exits sell at the close 20/60/120 trading days after entry and are benchmarked to SPY over the identical window; the out-of-sample test selects members on filings through December 2023 and evaluates only trades filed from January 2024; consensus means a second member bought the same stock within 30 calendar days by transaction date (a filing-date variant, reported in the audit file published with this article, agrees); sector benchmarks map each stock to its SPDR sector ETF by the SEC SIC code on file (9,391 of 10,002 sixty-day trades mappable — the rest are mostly foreign listings and funds with no SIC); beta is estimated from daily returns over the 252 trading days before entry (at least 60 required; 9,893 of 9,977 adjusted trades have the full 252). Medians carry bootstrap 95% CIs from 10,000 resamples; a variant deducting a 0.2% round-trip cost is reported for every stress-test figure in the audit file published with this article. Ten distinct rule variants were evaluated in total (four exit rules, two winner-selection cutoffs, two consensus definitions, two benchmark adjustments), plus the amount-band split of the 60-day rule; all are reported — none was selected after the fact. Not modelled: trading costs in the scoreboard itself, taxes, position sizes (undisclosed beyond ranges). Past patterns are not a promise of future results. For education only — not investment advice.
Related: Senate vs. House: the per-trade test · The Senate Scorecard · Track Record