Late-disclosed congressional buys (42+ days) trailed early ones by 1.91 points over 60 days vs the S&P 500 (n=14,328) — a pooled, House-driven, post-2020 result that weakens per member.
The intuition is familiar: if a member of Congress sits on a trade before disclosing it, maybe the trade was worth hiding — and worth copying once it surfaces. The pooled data point the other way. Across 14,328 scored congressional stock purchases filed between 2014 and 2026, the buys disclosed latest — 42 days or more after the trade — trailed the S&P 500 by 1.21% on average over the next 60 trading days, while the fastest disclosures, within 16 days, beat it by 0.70%. The gap is −1.91 percentage points (Welch two-sample test, 95% CI −2.63 to −1.19, p<0.001). Whatever filing delay signals here, it is not an edge to copy — closer to a warning label, with qualifications that matter.
Why this question matters
Congressional trades reach the public only through Periodic Transaction Reports, so a gap always separates the day a trade happens from the day anyone outside the household can read about it. Every filing poses the same question: fresh information about what a lawmaker just did, or an old trade arriving late?
The two cases call for different readings. A purchase disclosed within days is close to a live signal, opened near prices still on the screen. A purchase disclosed months later describes a decision made in a different market, possibly already closed. And if delay itself carried information — if late filers were systematically better traders — the gap would matter in the opposite direction. So we measured it. Our pre-registered hypothesis was that longer delays would predict better performance. The pooled data rejected it, in the opposite direction.
How we tested it
Population. Every stock purchase (transaction type P) on a Periodic Transaction Report from either chamber, filed between January 1, 2014 and September 30, 2026, options excluded. Duplicates created when the same trade appears in more than one filing were removed by keeping the earliest filing date — when the public could first have seen it (1,365 removed) — leaving 18,921 purchases.
Delay and scoring. Delay is the filing date minus the trade date, in calendar days; 16 rows had a negative delay and were excluded as data errors. Quartiles are cut on the pooled delay distribution of the scored sample, at 16, 28 and 41 days. A copied trade can only start once the filing exists, so entry is the close on the first trading day after filing. Each purchase is held for 60 trading days — the headline horizon, with 30 and 90 days as checks — and scored as excess return versus the S&P 500 (SPY) over the identical window, using adjusted closes. Of 18,905 purchases with a valid delay, 14,328 could be scored at 60 days; the rest are accounted for in the limitations. Amounts are disclosed only as ranges, so every purchase counts once.
The headline result
The gradient runs downhill, from +0.70% average excess in the earliest quartile to −1.21% in the latest (full table below). The primary test — latest minus earliest, −1.91 percentage points, 95% CI −2.63 to −1.19 (Welch, p<0.001) — excludes zero, so the pooled direction can be stated plainly: late-disclosed buys trailed early-disclosed buys. Medians agree: −0.20% against −1.11%, and the share beating the S&P 500 falls from 49.1% to 45.7%.
| Quartile | Delay (days) | n | Mean | Median | Beat SPY | Avg gain | Avg loss | 95% CI (mean) |
|---|---|---|---|---|---|---|---|---|
| Q1 | 0–16 | 3,659 | +0.70% | −0.20% | 49.1% | +12.10% | −10.35% | [+0.17%, +1.23%] |
| Q2 | 17–28 | 3,877 | +0.67% | −0.35% | 48.8% | +12.62% | −10.77% | [+0.14%, +1.20%] |
| Q3 | 29–41 | 3,346 | −0.16% | −1.17% | 46.1% | +12.63% | −11.17% | [−0.76%, +0.43%] |
| Q4 | 42–3,698 | 3,446 | −1.21% | −1.11% | 45.7% | +10.08% | −10.76% | [−1.70%, −0.73%] |
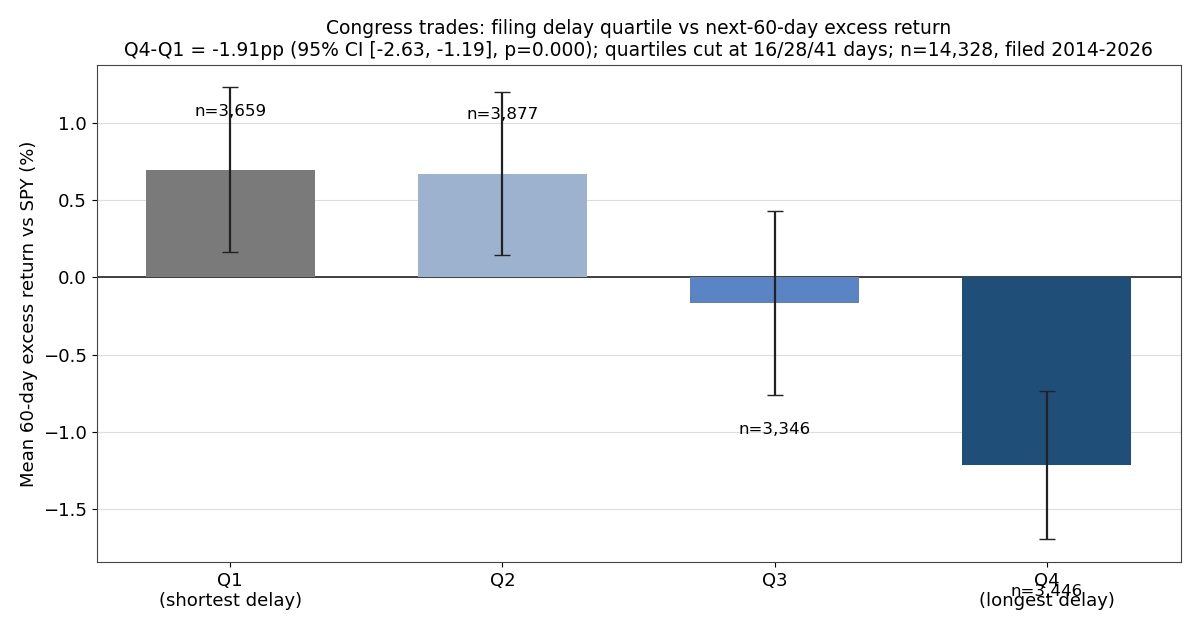
One caution belongs inside the result: the per-day slope is tiny. The rank correlation between delay and outcome is −0.044 (Spearman ρ, p<0.001), and a linear fit gives just −0.04 percentage points per extra 30 days of delay, explaining almost none of the variation (R²=0.0003). The linear slope is weak; the pattern is step-like — roughly flat across the first month, negative beyond it — not a smooth penalty growing with every late day. And the quartiles are pooled: the robustness section is where that number earns or loses its keep.
The shape of the delay effect
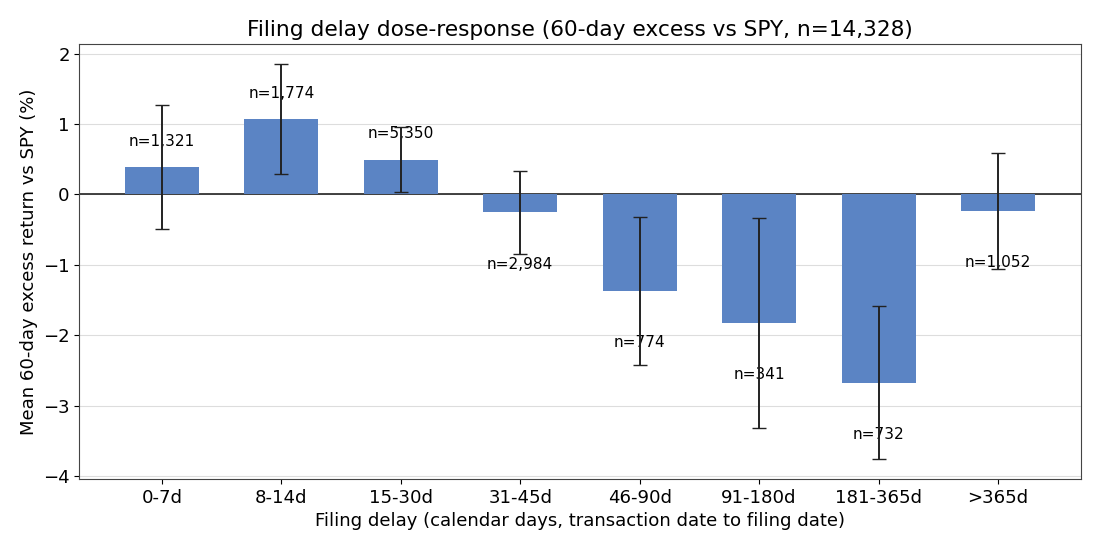
Calendar bands show where the pooled gap comes from. Buys disclosed within 30 days sit around zero to modestly positive: +0.39% at 0–7 days (n=1,321), +1.07% at 8–14 days (n=1,774), +0.50% at 15–30 days (n=5,350). Beyond a month the averages turn negative and deepen: −0.25% at 31–45 days (n=2,984), −1.37% at 46–90 days (n=774), −1.83% at 91–180 days (n=341), −2.67% at 181–365 days (n=732).
Then the pattern breaks. Buys disclosed more than a year after the trade — 1,052 of them — averaged −0.24%, back near zero, with 49.0% beating the index. One plausible reading is composition: such disclosures are disproportionately bulk or catch-up filings — bundles of old trades filed together — and a bundle's average need not behave like a single stale signal. That is an interpretation of the mix, not a measured fact. The dose-response is not monotone.
Does it hold up?
Five checks were registered in advance. Three leave the gap standing; two cut it down to size.
By chamber, the effect is a House effect. In the Senate alone, the latest quartile averaged slightly higher than the earliest: +0.21 percentage points (95% CI −1.21 to +1.63, p=0.77; n=495 vs 950) — no delay effect, either direction. In the House alone, the gap is −2.25 points (95% CI −3.07 to −1.43, p<0.001; n=2,951 vs 2,709). The pooled headline is the House result, diluted.
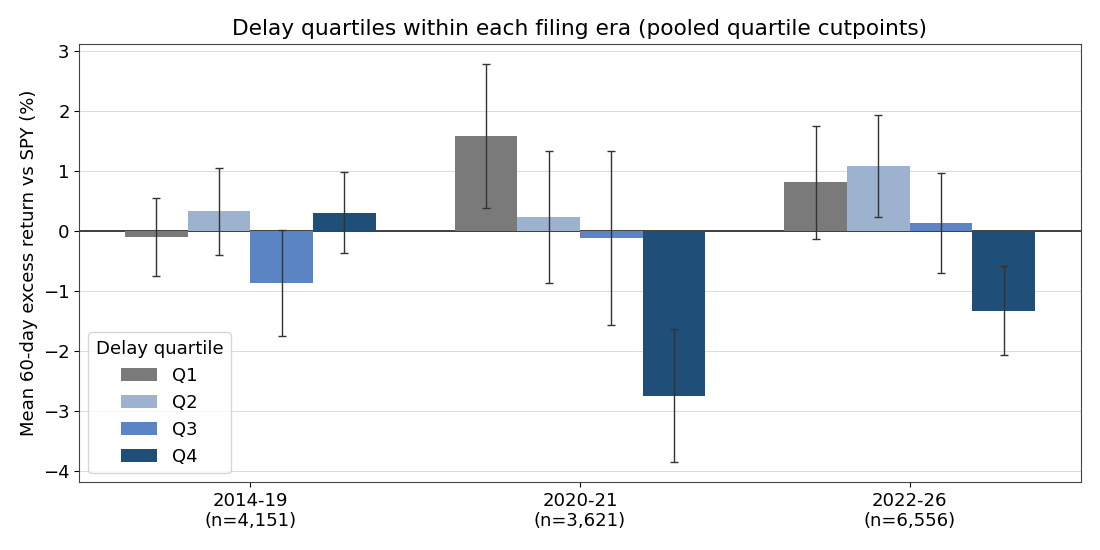
By era, the effect is recent. In 2014–19 filings there is no gap: +0.41 points (95% CI −0.52 to +1.34, p=0.39; era n=4,151). The gap appears in 2020–21, at −4.33 points (95% CI −5.96 to −2.70, p<0.001; n=3,621), and persists, smaller, in 2022–26, at −2.14 points (95% CI −3.34 to −0.94, p<0.001; n=6,556).
Concentration checks pass. Removing the two members who each supply at least 5% of the scored sample leaves −1.86 points (p<0.001); removing two event-style bulk filers leaves −2.10 (p<0.001); excluding every purchase in a filing containing a delay over 365 days — 111 filings — leaves −1.99 (p<0.001; remaining n=12,445). At other horizons: −0.50 points at 30 days (p=0.048), −1.89 at 90 days (p<0.001).
Equal weight per member weakens it. The pooled test counts every purchase once, so prolific filers count more. If each member counts once instead — average each member's buys first, then compare — the point estimate barely moves, −1.92 points, but the interval widens across zero (−4.01 to +0.18, p=0.073; 142 vs 150 members). At member level, this dataset cannot separate the gap from chance. Both statements are true at once.
Why might late disclosures trail at all? One plausible reason is staleness: a trade disclosed months later was decided on months-old information and prices, and by the time a copier can act, whatever prompted it may already be in the price — or the position already closed. We tested outcomes, not causes; nothing here measures that directly, and it says nothing about any individual filer's reasons for filing when they did.
Four trades
Individual trades cannot prove a pooled pattern. These are its extremes and middle.
| Case | Member (chamber) | Ticker | Traded | Filed | Delay | Stock, 60d | SPY, 60d | Excess |
|---|---|---|---|---|---|---|---|---|
| Best | Mast, Brian (House) | BEEM | 2020-09-15 | 2020-10-15 | 30 days | +348.84% | +9.82% | +339.02% |
| Worst | Scott, Austin (House) | FCEL | 2019-01-25 | 2019-03-06 | 40 days | −77.52% | +0.28% | −77.80% |
| Near median | Whitehouse, Sheldon (Senate) | BIIB | 2015-08-28 | 2015-09-24 | 27 days | +4.48% | +5.20% | −0.71% |
| Longest delay | Shreve, Jefferson (House) | DHR | 2015-05-08 | 2025-06-22 | 3,698 days | −1.58% | +9.84% | −11.41% |
The best and worst trades sit at delays of 30 and 40 days — the middle quartiles, not the extremes — what a weak, step-like pattern with wide individual variation looks like up close. The near-median trade, a 27-day disclosure trailing by 0.71 points, is the typical experience. The longest delay trailed by 11.41 points; it illustrates the tail of the delay distribution, and, on its own, nothing more.
Objections and limits
A fifth of the sample could not be priced. Of 18,905 purchases with a valid delay, 4,106 (21.7%) have no usable 60-day price path. Our extended price collection targeted 1,656 tickers and succeeded for 1,217; the Yahoo chart API returned 404s for a block of tickers including delisted names and some that still trade. That missingness can bias the result either way. If the unpriced names are disproportionately delisted or failed companies, their later performance was likely poor, and excluding them flatters whichever quartiles they would have landed in. If the still-listed names among them performed normally, their exclusion removes ordinary observations and could understate a quartile instead. The 21.7% hole is not random.
Measurement rates differ by era. The share of extracted purchases that could be scored is 79.7% for 2014–19, 85.9% for 2020–21 and 69.0% for 2022–26. The 2026 figure, 49.4%, is right-censoring, not data loss: recent filings have not yet had 60 trading days in which to be scored (471 purchases excluded for that reason). Era comparisons rest on differently-measured samples.
Some filings never reached extraction. Scanned-image House filings could not be machine-read: 476 documents in the 2021-and-later set, and 1,963 in the 2014–2020 backfill, heaviest in 2014–17. Their purchases are missing before any counting begins, and we cannot know whether their delay pattern matches the readable record.
Observed delay is not legal lateness. The STOCK Act's clock runs from the date the filer was notified of a transaction, and that date appears nowhere in the data. A long delay here means only that two dates on public forms are far apart — the convention of our filing-lag study. Extensions and broker notice lags are invisible, in both directions. No figure here is a finding that any rule was broken by anyone.
The quartiles mix different people and years. With pooled cut points, membership is entangled with composition: the Senate share falls from 26.0% in Q1 to 14.4% in Q4; the 2022–26 era supplies 38.2% of Q1 but 44.5% of Q4; Q2 draws 24.9% of its trades from its top three filers, against 17.9% in Q4. The chamber and era splits are the direct response — and why the headline is a pooled result. Transaction size does not explain the gap: the median amount-bracket midpoint is $8,000 in all four quartiles.
Costs are outside the measurement. Trading costs and taxes are not reflected, and amount ranges make position sizing impossible. This measures a signal's record, not a portfolio.
How to read a filing on GetCoattail
- Check both dates before the ticker. On our member pages, every disclosed trade carries its trade date and its filing date. Compute the gap: a purchase traded last week and filed this week is different information from the same ticker traded last year and filed today.
- Treat a long-delay filing as history first. Ask what has happened to the stock and its story since the trade date before treating the disclosure as a current view. Background: our filing-lag study and our Senate-vs-House test.
- Weight the member, not the pile. Prolific filers dominate pooled counts. Before concluding anything from a group of filings, check how many members it contains — the discipline our Track Record applies site-wide.
Methodology and data
Method and data box: Population — stock purchases (type P, options excluded) on House Clerk and Senate eFD Periodic Transaction Reports filed 2014-01-01 to 2026-09-30; duplicates across filings resolved to the earliest filing date (1,365 removed); 18,921 purchases in window, 16 excluded for negative delay, 14,328 scored at the 60-trading-day horizon (471 excluded for insufficient post-filing history, 4,106 for missing prices). Delay = filing date minus trade date, calendar days; quartiles cut at 16/28/41 days on the pooled scored sample. Entry = close on the first trading day after filing; returns use adjusted closes; excess = stock minus SPY over the same window; quartile differences are Welch two-sample tests with t-based 95% confidence intervals. Full signal file: signals_filing_delay.csv (all 18,921 in-window purchases with delay, quartile, per-horizon scores and exclusion status), published with this article. Cross-check: in the overlapping window of our Senate-vs-House study (filed 2021-10-01 to 2026-09-30), this study's rules reproduce Senate +1.98% (n=764) and House −0.06% (n=6,038), against that study's published +1.46% (n=817) and −0.07% (n=6,044); the differences come from deduplication and asset-type rules documented in the data report. Trading costs and taxes are not reflected. Past patterns are not a promise of future results. For education only — not investment advice.
Revision history
- v1.0 — October 10, 2026: first publication. Data as of 2026-10-09.