A defense contractor lobbies the Pentagon. A drugmaker lobbies the Medicare agency. A bank lobbies the Treasury. Sitting on the committees that oversee those agencies are members of Congress who also trade stocks — sometimes the very stocks of the companies doing the lobbying. That overlap is easy to photograph and hard to interpret: big companies lobby dozens of agencies, and the committees overseeing those agencies hold dozens of members. Some overlap would exist if trades were scattered at random. The question is whether there is more of it than randomness — and the trading volume of the members involved — would produce on its own, and whether the overlapping trades perform any differently.
We can now count it directly. Lobbying disclosures filed under the Lobbying Disclosure Act name the client, the lobbying firm, the issues, and the specific government offices contacted. We matched those disclosures, for 2021 through 2026, to the 5,528 stock purchases disclosed by the 59 members of Congress GetCoattail tracks, filed between October 2021 and September 2026 across 1,091 stocks. A purchase is lobby-linked when the member sits on a committee that oversees at least one agency the company lobbied in the same window. Committee jurisdiction over agencies is a judgment call, so we published the full agency-to-committee map with the reasoning for each line, and we counted contacts with the House, the Senate, and the White House — 71% of all agency mentions — as non-specific, because no single committee owns them.
The overlap is real — and ordinary
Of the 1,091 stocks these members bought, 354 had lobbying activity we could attribute to the company itself: 28,643 disclosure filings, reporting $4.78 billion in lobbying income and expenses over the window. Just over half of all purchases — 2,880 of 5,528 — were in those 354 stocks. And 1,404 of those purchases, 48.8%, were lobby-linked: the buyer sat on a committee overseeing an agency the company had lobbied.
That sounds like a lot until you build the baseline. For each stock, we asked what share of the members' total trading volume belongs to members on the relevant committees; summed over all purchases, chance alone — given how broadly large companies lobby and how much the linked members trade — predicts 1,385 linked purchases, or 48.1%. The observed 1,404 sits almost exactly on top of it. Shuffling committee assignments among the 59 members 2,000 times produces link shares between 43.6% and 65.7%; the observed 48.8% is unremarkable inside that range.
Microsoft shows why the baseline matters. Microsoft reported contacting 36 different government offices, which map to 26 committees; 128 of the 131 purchases of Microsoft stock were "linked." The baseline predicts 129.7. A company that lobbies everything links to almost everyone, mechanically.
Two cross-checks point the same way. First, restricting the link to lobbying filed in the year of the trade or the year before — the contemporaneous version — still yields 1,081 linked purchases (37.5%), and nothing in what follows changes. Second, in our earlier study of industry jurisdiction, 5.6% of these members' classifiable purchases fell inside the buyer's own committee turf. In lobbying stocks that share is 5.5%; in stocks with no lobbying, 5.9%. The difference (−0.4 points, 95% CI −1.9 to +1.1) is indistinguishable from zero. A third check splits lobbying stocks by whether the company also holds federal contracts: 57.6% of purchases in contract-holding companies were linked, against 54.9% expected on the same baseline; for non-contractors, 39.1% against 40.7% expected. Even where the government's money and the lobbying meet, the overlap runs at the chance rate. The members with the most linked purchases — Josh Gottheimer (173), Gilbert Cisneros (155), Kevin Hern (115), Tommy Tuberville (109), Lloyd Doggett (106) — are simply the members who trade the most.
More lobbying, more links — at the chance rate
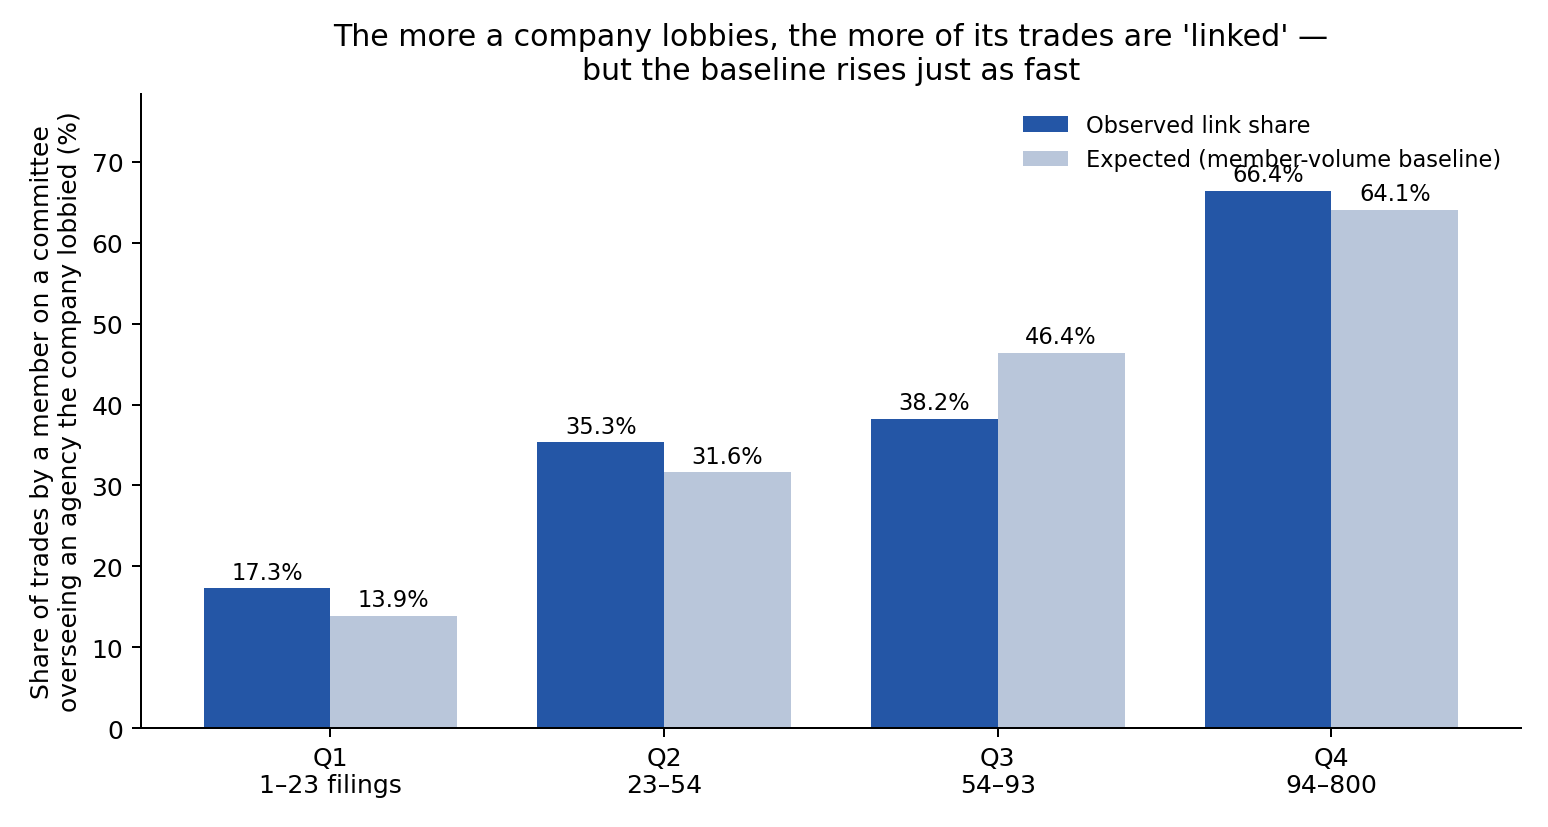
The link share climbs steeply with lobbying intensity. Among stocks at the bottom quartile of filing volume (1–23 filings), 17.3% of purchases were linked. At the top quartile (94–800 filings), 66.4% were. That gradient looks like a smoking gun until it is placed next to its baseline, which climbs just as steeply — 13.9% to 64.1% — because each additional agency a company contacts adds committees, and each committee adds potential buyers. The gap between observed and expected by quartile (+3.4, +3.7, −8.2, +2.3 points) has no consistent sign.
| Lobbying filings per stock | Stocks | Purchases | Linked | Linked share | Expected share | Observed − expected |
|---|---|---|---|---|---|---|
| 1–23 (bottom quartile) | 88 | 399 | 69 | 17.3% | 13.9% | +3.4 |
| 23–54 | 88 | 490 | 173 | 35.3% | 31.6% | +3.7 |
| 54–93 | 88 | 570 | 218 | 38.2% | 46.4% | −8.2 |
| 94–800 (top quartile) | 90 | 1,421 | 944 | 66.4% | 64.1% | +2.3 |
Table 1: Lobby-linked share of purchases, observed vs. the trading-volume baseline, by quartile of attributed lobbying filings per stock. The observed-minus-expected gap changes sign across quartiles.
Individual stocks do sit above their baselines. Johnson & Johnson drew 50 purchases, of which 35 were linked against 17.9 expected — but the linked buyers are a handful of members whose committees line up with J&J's disclosed contacts (Ways and Means members Kevin Hern and Lloyd Doggett; J&J lobbied the Medicare agency. Tommy Tuberville of Veterans' Affairs; J&J lobbied the VA). We report these concentrations as descriptions, not findings: across 354 stocks, some will sit above baseline by chance, and we did not test stock-level gaps.
The linked trades did not perform differently
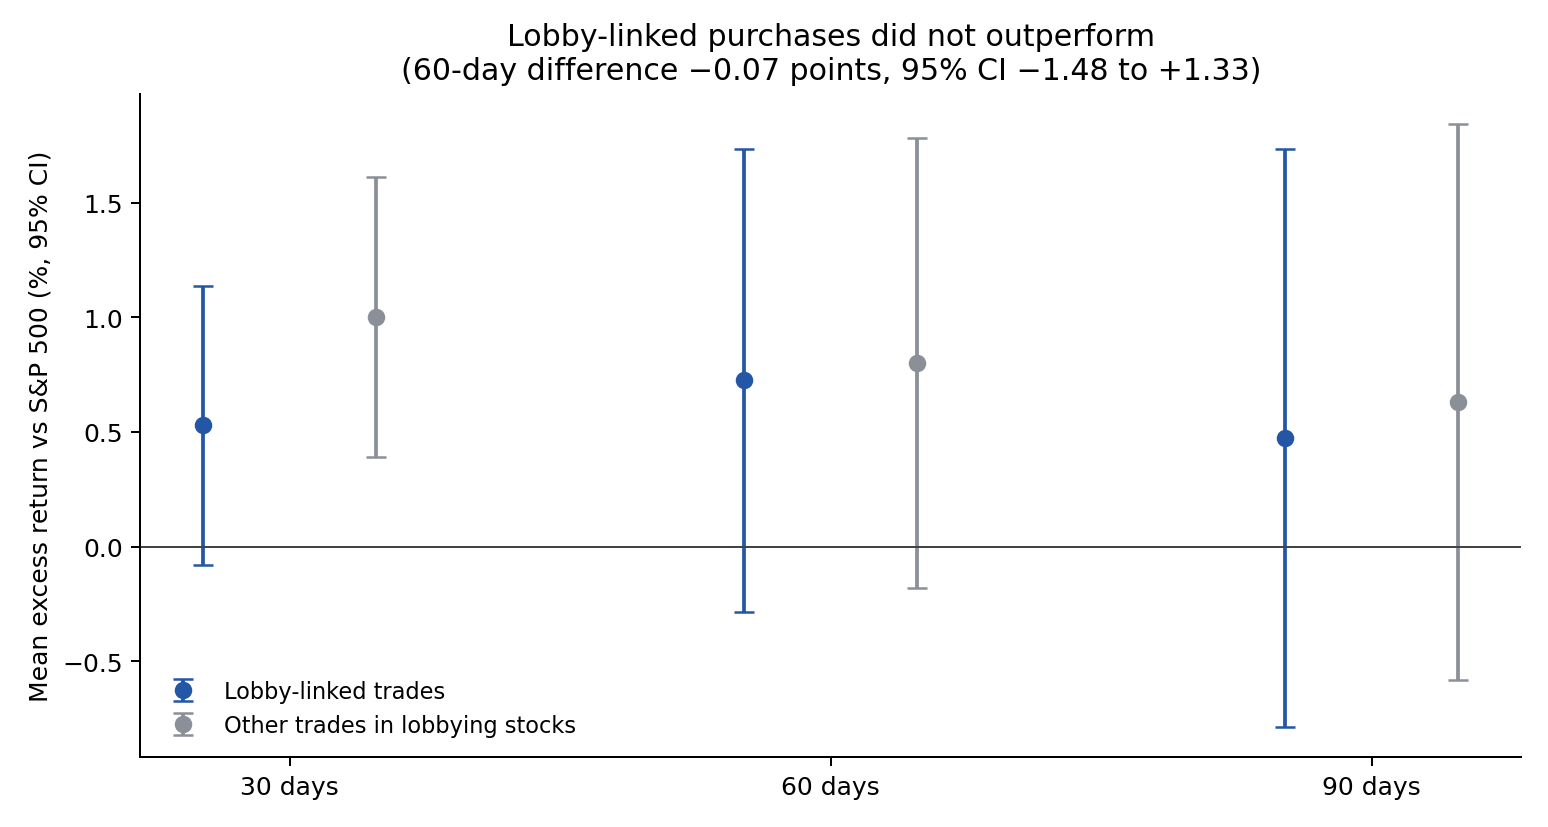
Among purchases in lobbying stocks that could be scored at 60 days, the 1,214 linked purchases averaged +0.73% against the S&P 500 (median −1.49%; 45.9% beat the index). The 1,261 non-linked purchases in the same stocks averaged +0.80% (median −0.28%; 49.6% beat the index). The difference is −0.07 points, with a 95% confidence interval of −1.48 to +1.33 — and a wider interval, −2.79 to +2.66, once standard errors are clustered by member. At 30 days the gap is −0.47 points (CI −1.33 to +0.39); at 90 days, −0.16 (CI −1.90 to +1.59). Contemporaneous links do slightly better on paper, +0.62 points, with an interval (−0.86 to +2.09) that still includes zero. The 98 purchases that were both lobby-linked and inside the buyer's industry jurisdiction averaged −0.34%, on a sample too small to conclude anything.
| Horizon after disclosure | Linked n | Linked mean | Non-linked n | Non-linked mean | Difference | 95% CI |
|---|---|---|---|---|---|---|
| 30 trading days | 1,339 | +0.53% | 1,391 | +1.00% | −0.47 | −1.33 to +0.39 |
| 60 trading days | 1,214 | +0.73% | 1,261 | +0.80% | −0.07 | −1.48 to +1.33 |
| 90 trading days | 1,175 | +0.47% | 1,207 | +0.63% | −0.16 | −1.90 to +1.59 |
Table 2: Excess return vs. the S&P 500 for lobby-linked vs. non-linked purchases in the same lobbying stocks, entry at the first close after filing. At 60 days, member-clustered errors widen the interval to −2.79 to +2.66. Every interval includes zero.
The extremes of the linked pool are both one member's trades, which itself reflects the pool: Gilbert Cisneros accounts for roughly a sixth of all purchases tracked. His best linked trade, Intel (+151.5% over 60 days after disclosure; he sits on Armed Services, and Intel lobbied the Defense Department), and his worst, Elevance Health (−46.7%; the link runs through Elevance's defense-business lobbying, not its health lobbying), bracket a median case that is more representative: Scott Franklin's purchase of Lockheed Martin (−1.5%), linked through the Science Committee because Lockheed lobbied NASA.
What could make this wrong
Three limits deserve emphasis. Name matching. Lobbying is filed under the name the client uses, not the ticker. Our normalization accepts the registrant's legal name and its service-subsidiary variants, and rejects everything else — which cost us real activity filed under brand and division names (John Deere's filings under Deere & Co; Berkshire Hathaway Energy's under Berkshire). The largest hole is Alphabet: Google lobbies as Google, our collection keyed on "Alphabet" matched nothing, and every Google purchase is therefore counted as "no lobbying." Those stocks' overlaps are understated. The agency map is judgment. Many agencies answer to several committees; we assigned each to its primary oversight committees and published the map. A different defensible map moves individual links, though the baseline moves with it. Assignments are current. We applied the 119th Congress's committee rosters to five years of trades; our earlier roster-by-roster sensitivity work on the same population did not change conclusions, but the approximation stands. We also analyze purchases only, and with about ten related tests in this package, any single "significant" number should be read accordingly.
How to read a headline about members and lobbying
When a story notes that a member who oversees an agency owns a company that lobbies it, three numbers discipline the claim: how many agencies the company lobbies (breadth creates links by itself), how much of the total trading the linked members account for (volume creates the rest), and what happened to the trades afterward (here: nothing distinguishable). On GetCoattail, each member's page lists committee assignments next to their trades, and each stock page shows the filings behind stories like this — the overlap is worth seeing, at its actual size.
Methodology and data
Purchases: PTR filings by the 59 tracked members (House 48, Senate 11), filed 2021-10-01 to 2026-09-30, deduplicated; members resolved to bioguide IDs. Entry is the closing price on the first trading day after filing; excess return is versus the S&P 500 (SPY) over the same 30/60/90 trading days; trading costs and taxes are not reflected. Lobbying: Senate LDA disclosures as collected in our pipeline (1999–2026; analysis window 2021–2026), attributed to tickers from per-ticker retrieval in checkpoint.jsonl by normalized client-name matching (tier 1: exact normalized legal name; tier 2: legal name plus service/subsidiary tokens); 28,643 of 35,592 retrieved in-window filings for traded tickers were attributed, 6,949 rejected as other companies or unaccepted name forms. Agency→committee assignments use each member's current (119th Congress) parent committees; the full mapping table, code, and the complete per-trade signal file (signals_lobbying_overlap.csv) are published with this piece. One tracked ticker (PURR) could not be retrieved and is treated as no lobbying. Past patterns are not a promise of future results. For education only — not investment advice.
Revision history
- v1.0 — October 13, 2026: first publication. Filings through 2026-09-30.