NVIDIA's quarter-end share price went from $6.59 at the end of 2020Q1 to $200.09 at the end of 2026Q2 — a 30-fold rise, split-adjusted, against +190% for the S&P 500 over the same span. We rebuilt those 26 quarters as a single panel and laid the four filing lenses this site tracks over the price: the Form 13F holdings of 83 tracked superinvestors, congressional transaction reports, insider Form 4 trades, and FINRA short interest. Then we asked the only question that matters for anyone who reads filings for an edge: did any of these lenses move before the price — or only with it, and after it?
The answer, lens after lens, is the same. The filings describe the rally in rich detail. None of them led it. Every forward-looking correlation we computed — lens changes this quarter against returns next quarter, or against the window after the data actually became public — has a 95% confidence interval that includes zero.
The superinvestor register followed the price
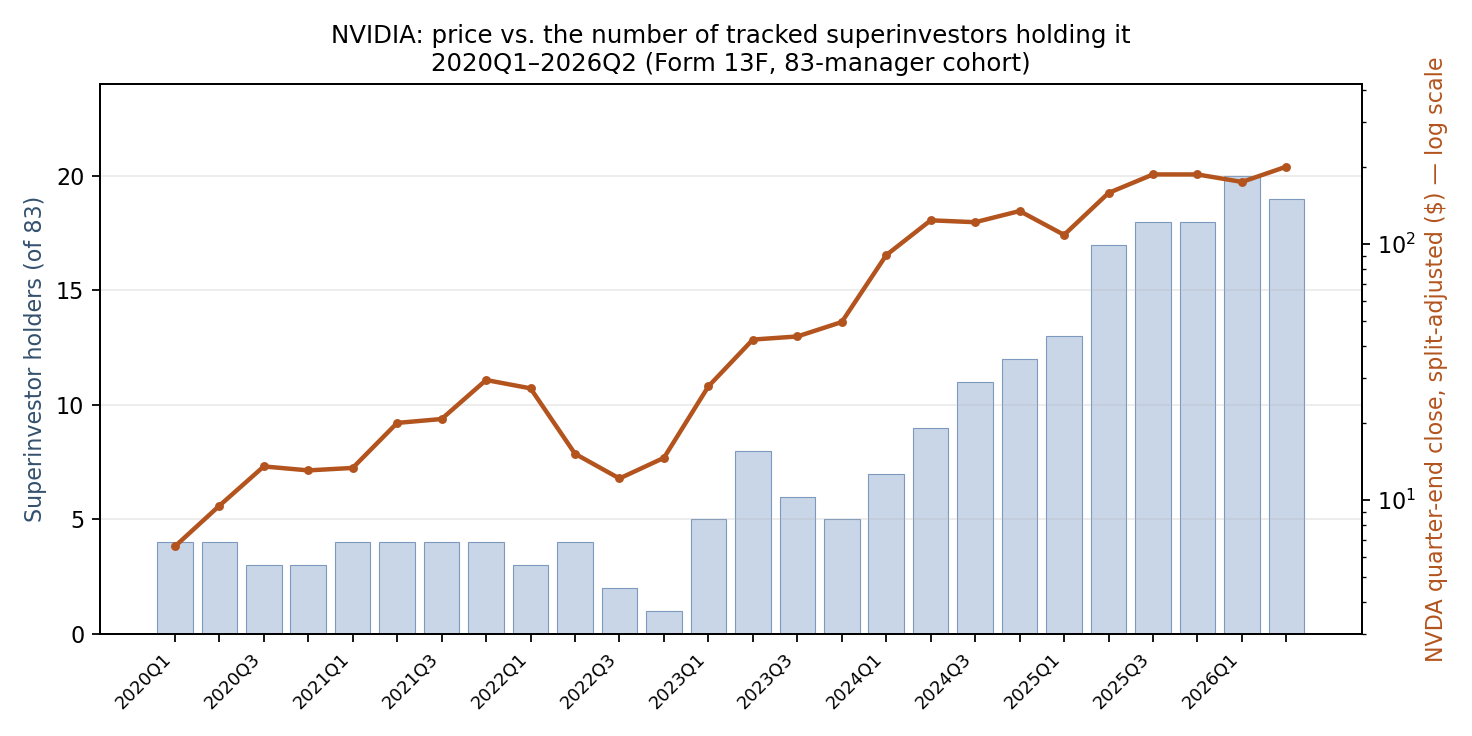
At the end of 2020Q1, 4 of the 83 managers on our tracked roster held NVIDIA. The count sat between 1 and 5 for three years while the stock multiplied, bottomed at a single holder at the end of 2022Q4, and then climbed with the AI re-rating: 5 holders in 2023Q1, 8 in 2023Q2, and a peak of 20 in 2026Q1, with 19 at the end of 2026Q2. Across the whole market, the number of 13F filers reporting NVIDIA rose from 1,656 to 5,939.
Two things are true at once here. The holder count clearly rose in the same quarters the price rose: the correlation between the quarterly change in the holder count and the same quarter's return is +0.44 (95% CI +0.05 to +0.71, n = 25). But the rank-based version of that test is weaker (Spearman +0.31, p = 0.13), the correlation disappears in the 2020–2022 half of the panel (−0.08, n = 11) and lives in the post-2023 half (+0.59, CI +0.09 to +0.85, n = 14), and it is 1 of 17 correlations we ran — at a 5% threshold, one hit is roughly what chance produces on its own, and this one (p = 0.028) does not survive a Bonferroni correction. We count it as what it is: contemporaneous co-movement, visible only in hindsight.
The tradable versions are empty. The change in the holder count against the next quarter's return is −0.00 (CI −0.40 to +0.39). The cohort's share change against next-quarter returns is +0.26 (CI −0.15 to +0.59), and against the return window that starts when the filings actually became public — our filedBy convention, quarter end plus 45 days — it is +0.25 (CI −0.17 to +0.59). All three intervals include zero. Knowing that more superinvestors owned NVIDIA at a quarter's end told you nothing usable about the quarter that followed.
| Test | Pearson r | 95% CI | n (quarters) |
|---|---|---|---|
| Superinvestor holder-count change vs. same-quarter return (descriptive) | +0.44 | [+0.05, +0.71] | 25 |
| Superinvestor holder-count change vs. next-quarter return | −0.00 | [−0.40, +0.39] | 25 |
| Superinvestor share change vs. next-quarter return | +0.26 | [−0.15, +0.59] | 25 |
| Superinvestor share change vs. post-disclosure-window return | +0.25 | [−0.17, +0.59] | 24 |
| Congress net stock buys vs. next-quarter return | −0.01 | [−0.40, +0.37] | 26 |
| Insider sale value vs. next-quarter return | −0.30 | [−0.64, +0.14] | 22 |
| Short-interest change vs. next-quarter return | −0.24 | [−0.61, +0.21] | 21 |
Confidence intervals via Fisher's z transform. The first row is contemporaneous — a 13F is published up to 45 days after the quarter it describes, so it could never have been traded on. Every forward-looking interval includes zero.
The register's own history is less flattering than the rising count suggests. Because later entrants started small, the cohort's combined stake shrank over the full period: 69.9 million split-adjusted shares in 2020Q1 against 36.3 million in 2026Q2, and from 0.41% of all 13F-reported NVIDIA shares to 0.22%. The moves were episodic, not prophetic. Vulcan Value Partners sold out entirely in 2020Q3 — a quarter NVIDIA rose 42.5% — then bought back 1.42 million shares the following spring, a re-entry that made the cohort's share count jump 359% in a quarter the stock returned +2.2%. The great institutional arrival came in 2023, after ChatGPT had already re-priced the company: between 2023Q1 and 2023Q2, Appaloosa went from 150,000 to 1,020,000 shares, Tiger Global from 43,875 to 628,575, and Lone Pine, Third Point and Viking opened new positions — chasing a stock that had already gained 90% in 2023Q1 alone. In the most recent quarter, the cohort cut its stake 18.9% while the stock rose 14.7%; the largest single reduction was H&H International, from 13.84 million shares to 6.28 million.
Congress traded it both ways
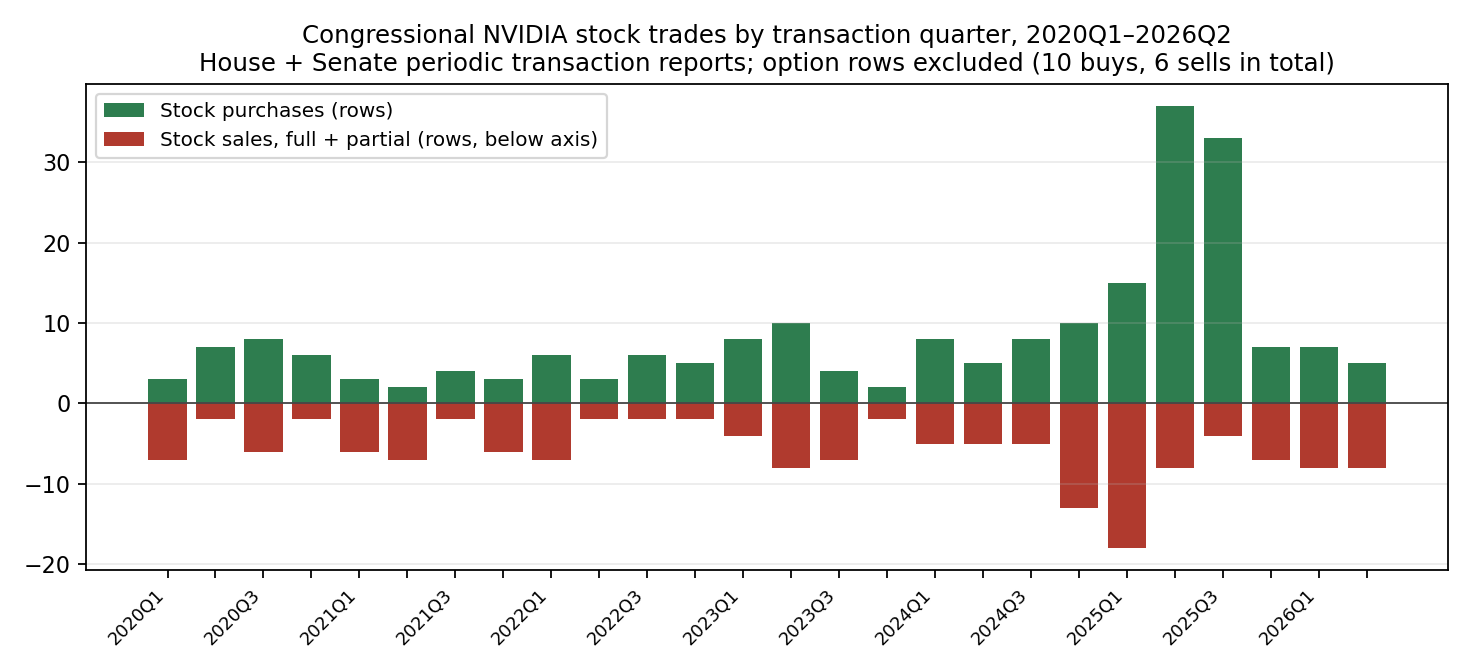
Members of Congress reported 215 stock purchases and 153 stock sales of NVIDIA across the 26 quarters, plus a small options book (10 purchases, 6 sales). Activity clustered in the dramatic quarters — 8 buys and 4 sells in 2023Q1, the +90% quarter — but it pointed both ways at once, and neither direction meant anything for what came next. Net stock buying, by count, correlates at −0.01 with the next quarter's return (CI −0.40 to +0.37, n = 26); measured by the midpoints of the disclosed amount ranges instead of counts, it is −0.05 (CI −0.43 to +0.34). In the median quarter of the panel (2023Q4, +13.8%), Congress reported exactly 2 buys and 2 sells. The congressional lens is a record of attention, not of foresight — and for 2020 in particular it is an incomplete record, because much of the House's paper-scan filing backlog from those years is still not machine-readable; the Senate side, filed electronically, is complete.
Insiders: twenty-two quarters, zero purchases
The cleanest fact in the panel needs no statistics. From 2021Q1 through 2026Q2 — 22 consecutive quarters covering the crash of 2022 and the entire AI run — NVIDIA's officers and directors reported zero open-market purchases of the stock (Form 4 transaction code P, non-derivative). Not one, in either of the two independent EDGAR batches we built this lens from. Over the same period they reported 1,843 open-market sales worth $6.44 billion, much of it under pre-arranged 10b5-1 plans.
If heavy insider selling marked tops, the panel refuses to show it: the correlation between quarterly insider sale value and the next quarter's return is −0.30, but the confidence interval is wide (−0.64 to +0.14, n = 22) and includes zero — consistent with anything from a real negative relationship to none at all. Selling was a constant of the stock's rise, present in flat quarters and vertical ones alike, which is precisely why it carried no timing information. The insider lens's message about NVIDIA is not a signal; it is an absence. The people who knew the company best never once bought it in the open market on the way up.
Short interest peaked after the fall
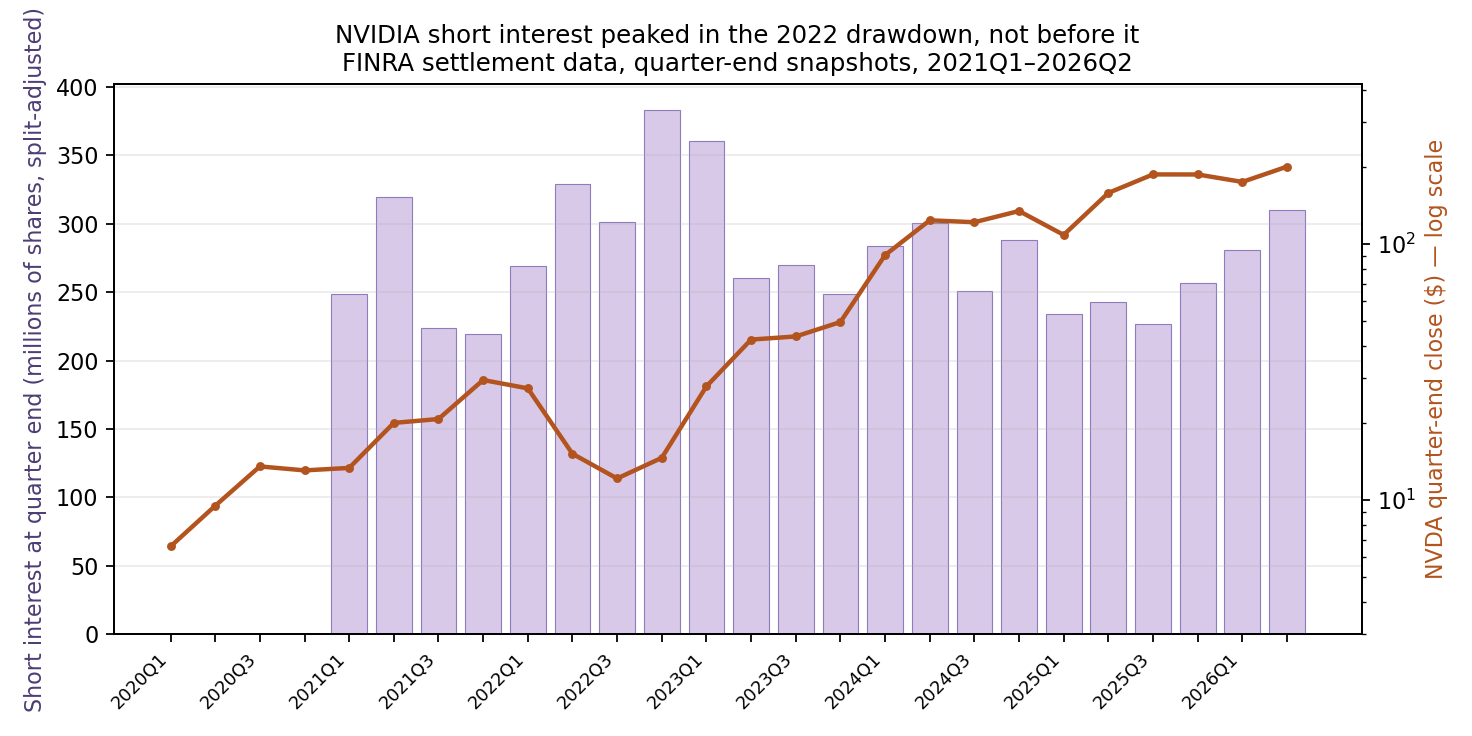
Short interest, in split-adjusted shares, sat at 248 million in 2021Q1, eased to a trough of 219 million at the end of 2021, and then climbed through the bear market to a peak of 383 million shares at the end of 2022Q4 — after the stock's worst quarter (−44.4% in 2022Q2) was already over, in the drawdown's final quarter. It stood at 310 million at the end of 2026Q2. Changes in short interest did not predict the following quarter either: −0.24 against next-quarter returns, with a confidence interval from −0.61 to +0.21 (n = 21). The shorts, like the superinvestors, were most committed after the move had happened.
What would change this conclusion
Three things. First, a second and third stock: a single case study cannot separate "NVIDIA's filings lagged" from "filings lag in general," and our cross-stock work on these same lenses is where that question gets answered. Second, a different measurement of the 13F lens — position initiations by managers with prior timing records, rather than the whole cohort's headcount; the aggregate can hide a handful of genuinely early movers (someone, after all, was the first of those 19). Third, evidence at the post-disclosure window specifically: a lens change that predicted returns in the 45 days after filings became public, at a confidence interval excluding zero, would overturn the practical version of our conclusion even if the quarter-level tests stayed null. None of the four lenses produced that here.
The full panel
All 26 quarters, as published data. Insider and short-interest lenses begin in 2021; earlier cells are marked n/a rather than zero. The complete panel, including range sums, days-to-cover and post-disclosure windows, is downloadable as nvda-quarterly-panel.csv.
| Quarter | NVDA return | SPY return | Holders (of 83) | Cohort shares (split-adj) | Congress buys/sells | Insider buys/sales | Short interest (split-adj) |
|---|---|---|---|---|---|---|---|
| 2020Q1 | — | — | 4 | 69.9M | 3/7 | n/a/n/a | n/a |
| 2020Q2 | +44.1% | +19.6% | 4 | 64.4M | 7/2 | n/a/n/a | n/a |
| 2020Q3 | +42.5% | +8.6% | 3 | 17.6M | 8/6 | n/a/n/a | n/a |
| 2020Q4 | −3.5% | +11.6% | 3 | 15.9M | 6/2 | n/a/n/a | n/a |
| 2021Q1 | +2.2% | +6.0% | 4 | 73.2M | 3/6 | 0/171 | 248M |
| 2021Q2 | +49.9% | +8.0% | 4 | 62.1M | 2/7 | 0/65 | 320M |
| 2021Q3 | +3.6% | +0.3% | 4 | 46.1M | 4/2 | 0/31 | 224M |
| 2021Q4 | +42.0% | +10.7% | 4 | 32.8M | 3/6 | 0/47 | 219M |
| 2022Q1 | −7.2% | −4.9% | 3 | 30.6M | 6/7 | 0/26 | 269M |
| 2022Q2 | −44.4% | −16.5% | 4 | 19.2M | 3/2 | 0/13 | 329M |
| 2022Q3 | −19.9% | −5.3% | 2 | 11.1M | 6/2 | 0/1 | 302M |
| 2022Q4 | +20.4% | +7.1% | 1 | 13.8M | 5/2 | 0/8 | 383M |
| 2023Q1 | +90.1% | +7.0% | 5 | 19.2M | 8/4 | 0/20 | 361M |
| 2023Q2 | +52.3% | +8.3% | 8 | 44.9M | 10/8 | 0/35 | 261M |
| 2023Q3 | +2.8% | −3.6% | 6 | 32.9M | 4/7 | 0/114 | 270M |
| 2023Q4 | +13.8% | +11.2% | 5 | 27.0M | 2/2 | 0/42 | 248M |
| 2024Q1 | +82.5% | +10.0% | 7 | 23.4M | 8/5 | 0/42 | 284M |
| 2024Q2 | +36.7% | +4.0% | 9 | 20.6M | 5/5 | 0/228 | 300M |
| 2024Q3 | −1.7% | +5.4% | 11 | 21.6M | 8/5 | 0/291 | 251M |
| 2024Q4 | +10.6% | +2.1% | 12 | 21.0M | 10/13 | 0/19 | 288M |
| 2025Q1 | −19.3% | −4.6% | 13 | 29.2M | 15/18 | 0/17 | 234M |
| 2025Q2 | +45.8% | +10.5% | 17 | 32.2M | 37/8 | 0/75 | 243M |
| 2025Q3 | +18.1% | +7.8% | 18 | 34.0M | 33/4 | 0/315 | 227M |
| 2025Q4 | −0.0% | +2.4% | 18 | 39.2M | 7/7 | 0/190 | 257M |
| 2026Q1 | −6.5% | −4.6% | 20 | 44.8M | 7/8 | 0/86 | 281M |
| 2026Q2 | +14.7% | +14.8% | 19 | 36.3M | 5/8 | 0/7 | 310M |
Methodology and limits
This is a single-stock case study: 26 quarters (25 for quarter-over-quarter changes, 22 for the insider and short-interest lenses, which begin in 2021; 2020 cells for those lenses are reported as "no data," not zero). Sources are primary: SEC Form 13F data sets (chosen filing per manager per quarter, latest amendment per report type; long share rows only, no puts or calls), House and Senate periodic transaction reports, Form 4 transactions from two EDGAR batches (2021–2024 and 2025–2026, amendment-superseded originals removed), FINRA short-interest settlement files, and split-adjusted daily closes for NVIDIA and SPY. Share counts are adjusted for the 4-for-1 (July 2021) and 10-for-1 (June 2024) splits. Congressional amounts are statutory ranges; stock and option rows are counted separately, and option amounts are never summed. Twenty-nine of the 327 matched House rows are exact in-document duplicates on date, type and amount and are counted as filed, since a periodic transaction report can list the same trade for multiple accounts. Short interest is shown in split-adjusted shares because a historical shares-outstanding series is not available to us; it is not a percentage of float. The 83-manager cohort is today's tracked roster applied retroactively — managers no longer tracked are invisible in early quarters, a survivorship limitation we flag rather than fix. Correlations are Pearson with Fisher-z 95% intervals, Spearman alongside; "no evidence" means the interval includes zero, never that an effect is proven absent. Nothing here is investment advice, and none of it describes what any named manager or member of Congress knew or intended.