GetCoattail Research — The Filing Tape #190. Vital Farms through six filing lenses, as of the latest filings. Past patterns are not a promise of future results. For education only — not investment advice.
The Hype
Vital Farms, Inc. (VITL) appears in a Zacks note dated October 23, 2026, titled "Investors Heavily Search Vital Farms, Inc. (VITL): Here is What You Need to Know" — a most-searched-stock note, not an earnings report or a contract announcement. This package cites no news event for Vital Farms: the attention claim rests on that listing plus the measured price tape, and nothing else. Zacks puts VITL's past-month return at −6.7%, against −1.2% for its S&P 500 composite over the same period and +4.3% for the Zacks Food – Miscellaneous industry.
The price tape behind the attention is a long decline. VITL closed 2025 at $31.94, fell to $11.63 by June 30, 2026 — 63.6% below its 2025 year-end close — and closed the price file on October 2 at $9.06, 22.1% below its June 30 close and 71.6% below its 2025 year-end close. The daily refresh puts the October 23 close at $9.14 — 0.9% above the October 2 close but still 21.4% below June 30 and 76.5% below the $38.86 52-week-high field. The question the filings let us ask: while the price fell by nearly three-quarters from year-end, what did the tracked holders, the broad market, the company's insiders, and Congress actually do?
The Tape
| Lens | As of | What the filings show | Direction vs prior period |
|---|---|---|---|
| Superinvestors (13F) | Jun 30, 2026 | 1 of 147 tracked managers holds; 604,960 shares ($7.04M reported). First Eagle is 100.0%. | Single holder +13.7%; no new holder, no exit |
| All institutions (13F) | Jun 30, 2026 | 229 filers hold 35,985,776 shares ($438.13M reported). | Shares −16.67%; filers −32; reported value −25.83% |
| Insiders (Form 4) | Oct 2, 2026 | 0 buys and 0 sells in 90 days; 17 buys ($0.84M) and 18 sells ($6.45M) in a year. | Quiet 90 days; net sellers over the year |
| Congress | Oct 3, 2026 | No VITL rows in the combined, House, Senate, or members files. | No transactions found in the covered disclosures |
| 13D/G | Jul 17, 2026 | Passive only: no 13D; O'Hayer at 18.08% then 16.05%; latest filing BlackRock Portfolio Management at 5.2%. | Largest holder trimmed; no new control filing |
| Short interest | Sep 15, 2026 | 10,455,625 shares short, 24.35% of shares outstanding; 9.11 days to cover. | +9.31% from prior settlement; +41.1% vs June; +11.5% year over year; 25.9% below the April peak |
Chart: Vital Farms through six filing lenses — who is actually there?
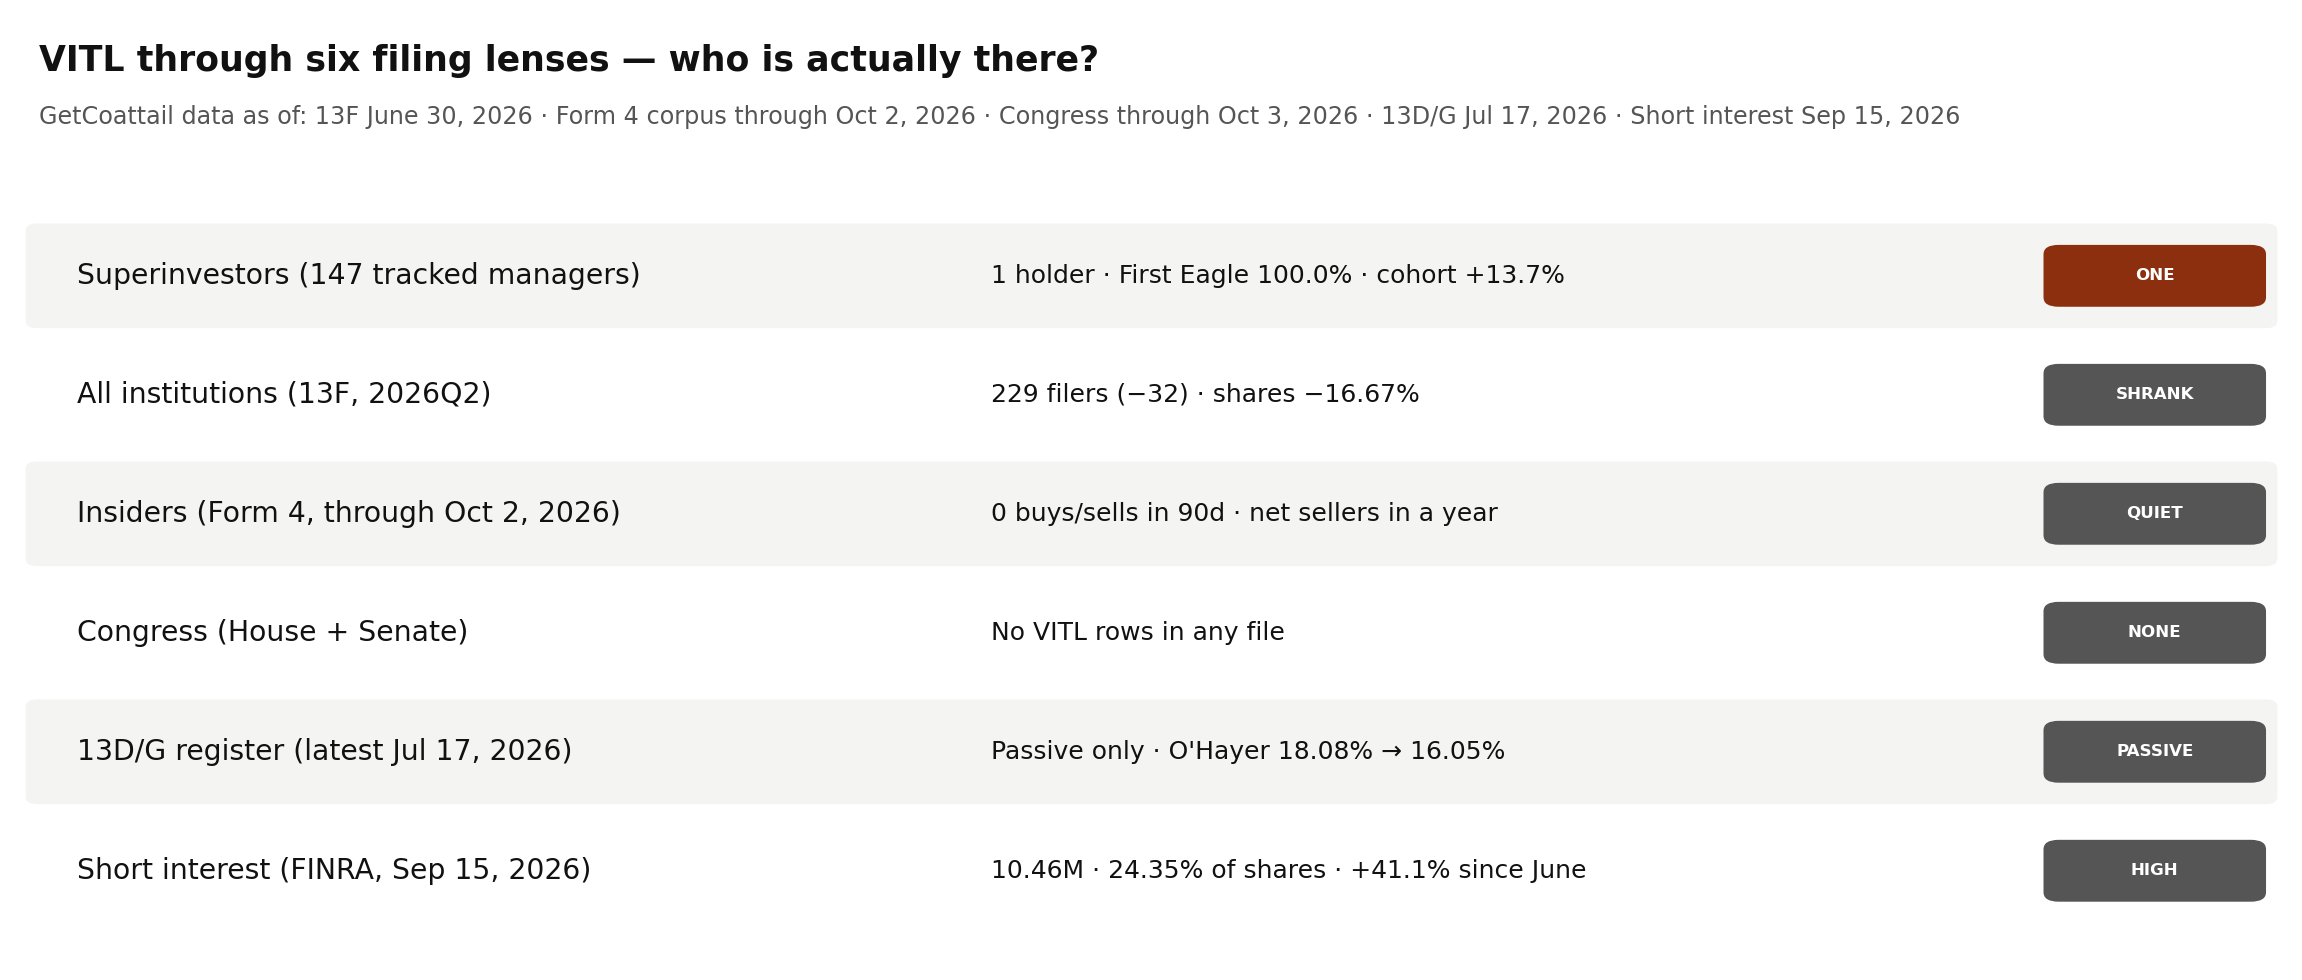
Superinvestors. The tracked register for Vital Farms is a single name. One of 147 tracked managers holds 604,960 shares — $7,035,685 reported — and that holder is the whole cohort. First Eagle Investment Management holds 604,960 shares, 100.0% of the cohort and 0.01% of its portfolio, after increasing 13.7% in Q2, from 531,960 shares, a gain of 73,000 shares. The Q1 figure is verified exactly under both pairing methods (Q2 accession 0001325447-26-000033; Q1 paired accession 0001325447-26-000018), and the holder filed on August 24, 2026. There is no second holder to dilute or confirm the position, no new holder, and no exit: the pipeline register contains exactly one VITL row in each quarter, and both quarters reconcile with residual zero. The cohort's implied price ($11.63) matches the June 30 close ($11.63) exactly. The cohort is 1.68% of the full market's reported shares and 1.41% of shares outstanding on the fundamentals record's point-in-time basis. A one-holder register cuts both ways: every tracked-manager statement about this stock is a statement about First Eagle alone.
All institutions. The broad market moved hard in the opposite direction from the tracked holder. Filers fell by 32 to 229, of which 226 are long, while reported shares fell 16.67% (−7,197,792 shares to 35,985,776). Reported value fell 25.83% to $438.13 million — faster than shares, because reported value includes option rows by definition and the June 30 close ($11.63) sits below the March 31 close ($14.12). Underneath, 220 filers entered and 252 exited, net −32. Excluding the tracked cohort, other institutions hold 35,380,816 shares. The broad register did not drift: it shrank by nearly a sixth of its shares in one quarter while its only tracked holder added.
Insiders. This lens is quiet in the recent window and net-selling over the year. In the 90 days to October 2, 2026, insiders filed 2 forms with 0 buys and 0 sells — no open-market transactions at all. Both filings are tax-withholding (code F) dispositions, not open-market trades: Holland Joseph Michael (Chief Supply Chain Officer), 412 shares at $10.12, filed September 4, 2026, and Van Hoven Reena Chauhan (Chief People Officer), 344 shares at $10.03, filed September 18, 2026. Over one year: 17 buys, 18 sells — 87,685 shares bought for $835,372.04 against 201,401 shares sold for $6,454,239.35, a net of −113,716 shares, from 12 buyers and 2 sellers. Officer buys are 6 transactions ($304,164.66); officer sells are 16 transactions. The two one-year sellers are Diez-Canseco Russell and Ohayer Matthew. Across the whole corpus: 17 buys, 75 sells — 87,685 shares bought for $835,372.04 against 1,192,860 shares sold for $49,192,572.02, from 12 buyers and 9 sellers, across 135 filings. Every buy in the corpus falls inside the one-year window; the 57 sells outside it are all older transactions. The parsed scan for issuer CIK 1579733 reproduces the aggregate exactly in every window. One gap is stated plainly: the site's insider aggregate file contains no VITL row, so no site-aggregate figure is quoted for this ticker — the lens above rests on the full-corpus aggregate and the parsed scan.
Congress. This lens is blank, with its coverage stated rather than smoothed over. The combined, House, and Senate aggregates and the members file contain no VITL rows at all — no buys, no sells, no attributed member. The members file covers House periodic transaction reports for 2026 with transactions dated on or after April 1, 2026, and the Senate file is as of October 1, 2026, so the correct statement is that no congressional transaction was found in the covered disclosures — not that no member ever traded the stock. Congress disclosures are member filings, not Form 4 insider transactions, and are never added to insider totals.
13D/G. The control register is passive-only, and its largest position has trimmed. It holds no Schedule 13D filing at all. The aggregate counts 19 filings, but the parsed issuer set contains 18 unique filings — 6 initial Schedule 13G filings and 12 amendments — and the difference is a duplicate, not a missing filing: the O'Hayer 13G/A appears under two accessions, one carrying issuer CIK 932471 instead of 1579733, so the aggregate counts it twice and the parsed set counts it once. The duplicate accounts for exactly 8,000,669 shares of the aggregate's cross-date total, and the maximum percent, the latest date, and the no-13D finding agree in both counts. The largest reported percent is Matthew O'Hayer at 18.08% (8,000,669 shares, event March 31, 2025, filed April 4, 2025), later amended to 16.05% (7,185,282 shares, filed November 13, 2025). BlackRock, Inc. reported 12.1% (5,419,901 shares, event December 31, 2025, filed January 8, 2026), later amended to 6.9% (2,964,518 shares, event June 30, 2026, filed July 8, 2026). The Vanguard Group reported 6.35% (2,845,714 shares, event December 31, 2025, filed January 30, 2026), later amended to 0 shares, 0.0% (event March 13, 2026, filed March 27, 2026). Van Berkom & Associates Inc. fell from 5.4% to 0.1% across two filings, Wasatch Advisors LP from 5.3% to 4.3%, and Wellington Management Group LLP from 5.6% to 4.5% — Wellington's three entities report the same shares and percent as one joint position and are never summed. The register's latest filing is BlackRock Portfolio Management LLC at 5.2% (2,207,669 shares, event June 30, 2026, filed July 17, 2026). No filing in the parsed set is dated after July 17, 2026. The register's cross-date totals sum reporter rows across dates and are never quoted as an economic figure.
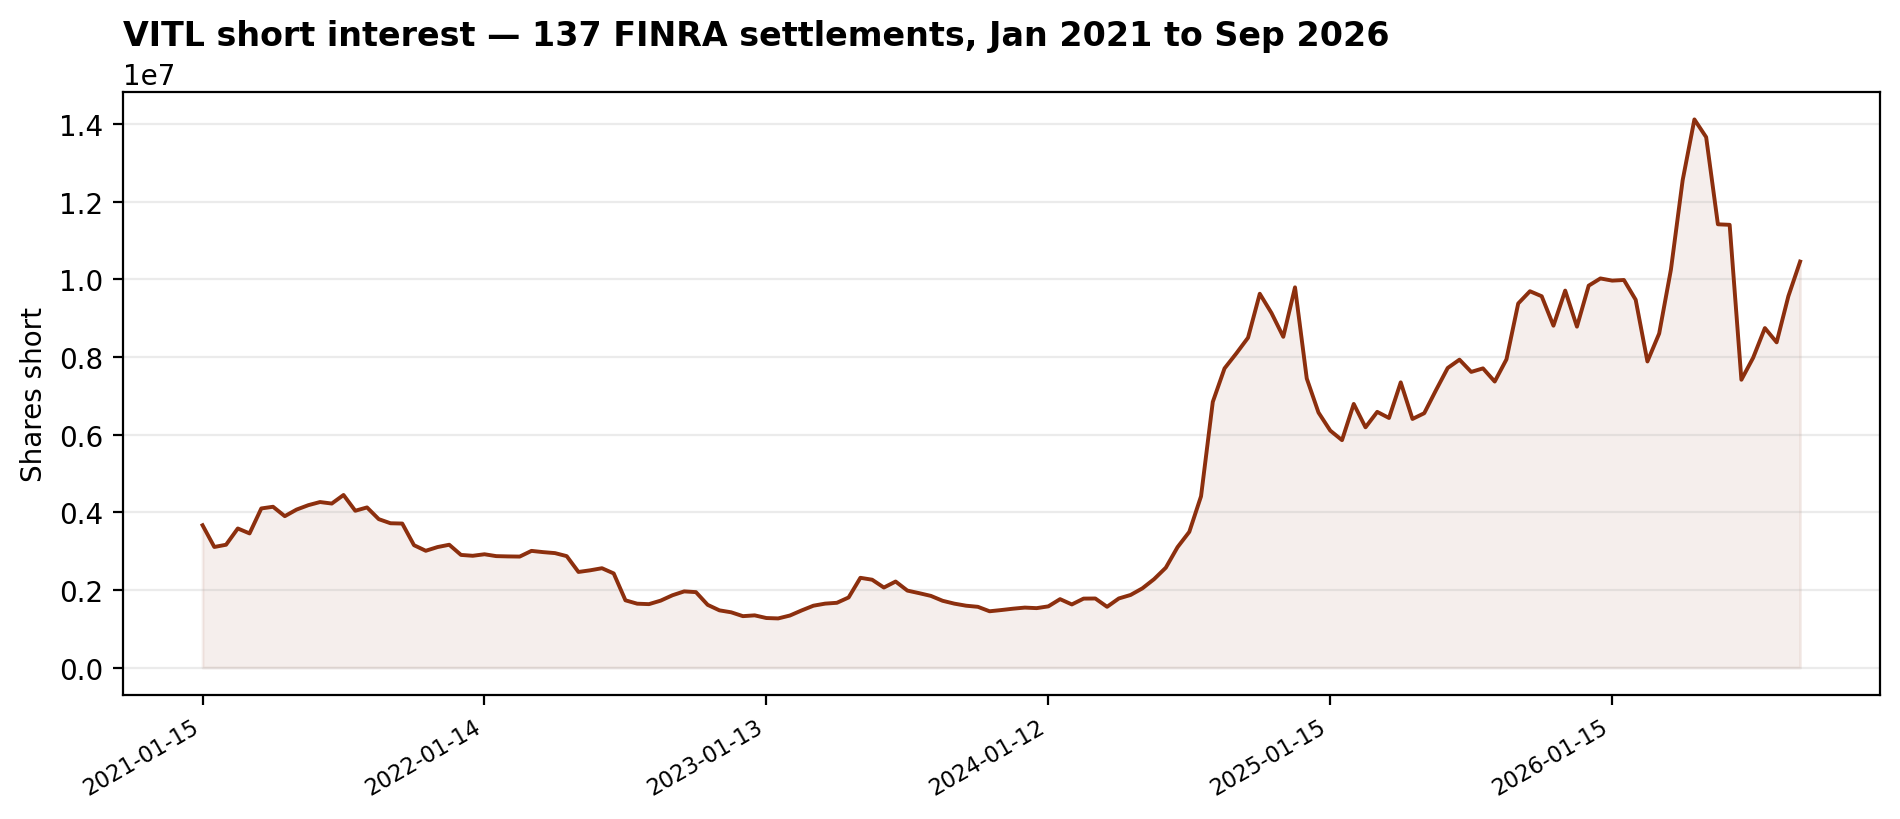
Short interest. The bear position is large, rebuilding, and still below its spring peak. FINRA short interest stood at 10,455,625 shares at September 15, 2026, with 9.11 days to cover and 24.35% of the 42,931,522 shares outstanding on the fundamentals record's point-in-time basis. That is 9.31% above the prior settlement (9,564,910 at August 31), 41.1% above June 30 (7,412,289), and 11.5% above the year-ago figure (9,375,761) — but still 25.9% below the series peak of 14,116,142 on April 30, 2026. The last five settlements trace the rebuild: 7,978,805 (July 15), 8,743,305 (July 31), 8,375,857 (August 14), 9,564,910 (August 31), 10,455,625 (September 15) — two consecutive rises into the latest settlement. The series has no step over 2× and none under 0.5×; its largest single-settlement step is ×1.551 (August 15, 2024) and its smallest is ×0.65 (June 30, 2026). Two rows carry revision flags (June 15, 2021; February 28, 2023); no row carries a stock-split flag.
Chart: VITL short interest — 137 FINRA settlements, January 2021 to September 2026.
Fundamentals context. The fundamentals record is complete on the fields quoted here: shares outstanding 42,931,522 as of August 3, 2026, on a point-in-time basis, revenue $759,444,000, net income $66,282,000 and assets $518,738,000, all for FY2025. The recorded market capitalisation is $403,556,290.42, on the record's own price_close ($9.40 as of October 6, 2026), not the October 23 close.
The Gap
The attention and the filing tape disagree about what kind of story this is. A most-searched listing puts Vital Farms in front of readers with a past-month decline of 6.7%, while the price sits 71.6% below its 2025 year-end close on the file's end. The filings show that the tracked superinvestor presence is exactly one holder adding 13.7% in Q2, that the broad market cut 16.67% of its shares in the same quarter with 252 filers exiting against 220 entering, and that the company's own insiders recorded no open-market trades at all in the 90 days to October 2 — only two tax-withholding filings — while net-selling over the year. Against that picture, Congress recorded nothing in the covered disclosures and the control register produced no activist filing and no new initial position, only a largest holder trimming from 18.08% to 16.05% and several other holders stepping down. Meanwhile short interest did not merely stay high: at 24.35% of shares outstanding it ended the series 41.1% above June and 11.5% above a year earlier, rebuilding for two straight settlements toward — but still 25.9% below — its April peak. The tape does not show a tracked crowd piling in behind the search interest; it shows one tracked buyer, a broad register shrinking fast, quiet insiders, and a large short position rebuilding.
What Would Change the Picture
Nothing above is a recommendation. It is a record. What would change it:
- 1. Q3 13F season (filings due by November 16, 2026). Watch whether First Eagle adds to its 604,960-share position at all, whether any second tracked manager opens a first Vital Farms position — the register starts Q3 from one holder, so any entry is measurable against that base — and whether the broad-market filer count rebounds from 229.
- 2. A first Form 4 filing dated after September 18, 2026, or a first open-market (P) transaction in a filing dated after October 2, 2026. Either would end a window in which the only recent insider filings are two tax-withholding dispositions; an open-market purchase would break the 90-day run of zero buys and zero sells.
- 3. A first Schedule 13D, or a first new initial Schedule 13G. Any activist filing would replace the passive-only register; an O'Hayer move from 16.05% in either direction, or a BlackRock Portfolio Management move from 5.2%, would also change the largest passive positions.
- 4. A first Congress transaction in the covered disclosures, buy or sell, would break the blank congressional picture.
- 5. Short-interest direction. A break above the April 30 series peak of 14,116,142 — or a fall back toward the June 30 level of 7,412,289 — would each tell a different story about the bear position that ended the series rebuilding but below its high.
As-of & Limits
| Lens | As of | Limit or note |
|---|---|---|
| Superinvestors (13F) | Jun 30, 2026 | 13F figures are as of June 30, 2026, the quarter-end. Funds have up to 45 days after quarter-end to file, so this is the most recent complete picture — and it is always a lagging one. Common stock only (CUSIP 92847W103); no option rows, no second class in the tracked file. The single continuing holder verifies exactly under both pairing methods; both registers reconcile with residual zero. No tracked holder is among the 3 early filers at September 30, 2026. |
| All institutions (13F) | Jun 30, 2026 | Reported value includes option rows by definition; implied price ($12.18 in Q2) is not a price check. Value fell faster than shares partly because the June close sits below the March close. |
| Insiders (Form 4) | Oct 2, 2026 | "Zero buys and zero sells in 90 days" means zero open-market (P) and zero open-market sale (S) transactions in the stated window, across the parsed corpus for issuer CIK 1579733 (135 filings, filing-date span January 15, 2025 – September 18, 2026). The 2 filings in the window are both code F tax-withholding dispositions. The site insider aggregate file has no VITL row, so no site-aggregate figure is quoted. |
| Congress | Oct 3, 2026 | No-transactions-found finding: no VITL row in the combined, House, Senate, or members files. The members file covers House PTR filings for 2026 with transactions dated on or after April 1, 2026; the Senate file is asof October 1, 2026. Congress sells are member-disclosure transactions, not Form 4 insider transactions, and are never added to insider totals. |
| 13D/G | Jul 17, 2026 | Passive-only register; no 13D exists in the parsed set. The aggregate's 19 filings include one duplicate accession (O'Hayer 13G/A under issuer CIK 932471); the parsed set holds 18 unique filings. Jointly-reported positions are not summed. Cross-date share totals sum reporter rows across dates and are not economic totals. |
| Short interest | Sep 15, 2026 | Shares-outstanding count is a point-in-time count as of August 3, 2026; the 24.35% ratio inherits that basis. The peak claim is a maximum over all 137 settlements; the latest settlement sits 25.9% below it. The series has no step over 2× and none under 0.5×. |
| Prices | Oct 23, 2026 (fresh close) | Price file ends Oct 2, 2026; the Oct 23 close ($9.14) and moves derived from it are cross-source (chart_stats) and labelled as such. The 52-week-high field ($38.86) is the chart_stats field, not a recomputed file maximum. |
| Fundamentals | FY2025 | Shares outstanding is a point-in-time DEI count as of August 3, 2026. Recorded market capitalisation uses the record's own price_close ($9.40 as of Oct 6, 2026), not the Oct 23 close, and is quoted only as the record's figure. |
| Hype source | Oct 25, 2026 (Zacks note) | Search-interest note only (Zacks, Oct 23, 2026); no news event is cited for Vital Farms in this article. Price moves are measured from the price file and chart_stats. |
Methodology & disclaimer: 13F holdings are long common shares unless stated; reported values include option rows for the all-institutions lens by definition. Short interest is FINRA twice-monthly settlements. Trading costs and taxes are not reflected in any figure. Past patterns are not a promise of future results. For education only — not investment advice.
This article describes filings and market data for education. It is not investment advice. Data: SEC EDGAR 13F (as of June 30, 2026, filed within 45 days), Form 4 corpus checked through October 2, 2026 (135 filings for issuer CIK 1579733), House/Senate disclosures through October 3, 2026, SC 13D/G parsed register through July 17, 2026, FINRA short interest at September 15, 2026 settlement. 13F covers long positions of $100M+ managers only and is always a lagging picture. Trading costs and taxes are not reflected.
Related research: Sixteen of 147: Dodge & Cox Is 40.5% of the Tracked Coupang Stake — While Short Interest Rose 363.7% in a Year · Four of 147: Berkshire Is 94.1% of the Tracked Louisiana-Pacific Stake — While Short Interest Hits Its Series Peak · Track the tape on Vital Farms' stock page and the 13F filing season hub.
Revision history: v1.0 — October 25, 2026. Initial publication. Signals and lens aggregates: vitl_lens_data.csv. Short-interest series: vitl_short_interest_series.csv.