GetCoattail Research — The Filing Tape #69. Bank of America reports third-quarter results before the open on October 14. The filings that predate that print describe a concentrated register: fifteen tracked superinvestors holding 518,625,474 shares, 93.2% of them in a single name that cut 5.9% in the second quarter, a broad market that added 627 million shares underneath, an insider record with no purchase in 158 filings, and a borrow more than a quarter below its December peak.
The Hype
Bank of America is scheduled to report third-quarter 2026 results before the open on October 14, with a call at 8:30 a.m. ET. Analysts expect earnings of $1.10 per share on revenue of $30.58 billion, according to the consensus carried by MarketBeat and Watchlist News. The bar was set in July: the second quarter printed $1.21 per share against a $1.13 consensus, on revenue of $31.6 billion, up 15% from a year earlier, with net income of $9.1 billion, up 27%. Analysts entered the print leaning positive but trimming at the edges: MarketBeat's consensus in early October was a moderate buy with an average target of $64.22, TD Cowen initiated coverage on October 8 at hold with a $60 target, and several firms lowered targets in late September and early October. The stock was third on MarketBeat's financial-stocks list for October 13, behind JPMorgan Chase and Citigroup. On our daily-close file the price rose 16.9% in the second quarter, from $48.75 at March 31 to $56.98 at June 30, then eased to $53.75 by October 2 — down 17.1% from its 252-session closing high of $64.81 on August 12, 2026, and down 2.3% year to date. The question the filings answer is who was holding the stock while it rose.
The Tape
For Bank of America — the sixty-ninth Filing Tape audit — the tape shows one holder dominating the tracked cohort, a full market adding shares, an insider purchase line that has never printed, two recorded congressional sales, a passive 5% register, and a borrow well below its peak.
| Lens | As of | What the filings show | Direction vs prior period |
|---|---|---|---|
| Superinvestors (13F) | Jun 30, 2026 | 15 long holders; 518,625,474 shares; $29,551,279,495 | Shares -5.38% vs Q1; 10 cut, 3 unchanged, 1 raised, 1 new |
| All institutions (13F) | Jun 30, 2026 | 3,614 filers; 5,322,821,652 shares | Filers +175; shares +13.37% |
| Insiders (Form 4) | Oct 2, 2026 | 0 purchases in the entire parsed record; 8 sales | Last 90 days: 0 purchases, 0 sales |
| Congress | Oct 3, 2026 | 2 recorded sale transactions; 0 purchases | House aggregate holds both; Senate has no row |
| 13D/G | Apr 29, 2026 | 5 parsed filings, all SC 13G; register maximum 8.91% (The Vanguard Group) | Berkshire chain prints twice, falling; no filing since Apr 2026 |
| Short interest (FINRA) | Sep 15, 2026 | 83,249,868 shares; 1.19% of shares outstanding | -27.5% vs series peak; -20.0% vs a year ago |
Lens 1 — the superinvestors: fifteen holders, one of them 93.2% of the position. We track 83 large, mostly long-only managers whose 13F portfolios we collect directly from SEC EDGAR. As of June 30, 2026, 15 held Bank of America long, totalling 518,625,474 shares worth $29,551,279,495, with no option rows. The largest holder is Warren Buffett's Berkshire Hathaway, with 483,394,015 shares worth $27,543,790,975, a 9.2% portfolio weight — 93.2% of the cohort's shares. The other fourteen holders combined hold 35,231,459 shares. Berkshire's label is DECREASED, -5.9%, and the cohort's labels read ten decreased, three unchanged, one increased and one new: the only increase is Bill Nygren's Oakmark Funds, up 22.1% to 23,090,903 shares, and the only new position is Ruane Cunniff LP's 3,625 shares. On the pipeline's holdings files, on the same CUSIP basis, the cohort held 548,089,037 shares across 16 rows at March 31, so the quarter removed 29,463,563 shares (-5.38%) while the price rose 16.9%. Two managers exited: Li Lu's Himalaya Capital Management (2,997,987 shares previously) and Steven Check's Check Capital Management (12,032 shares). The position's implied price, $56.98, sits exactly on the June 30 close. 13F figures are as of June 30, 2026; funds have up to 45 days to file, so this picture is complete — and always lagging.
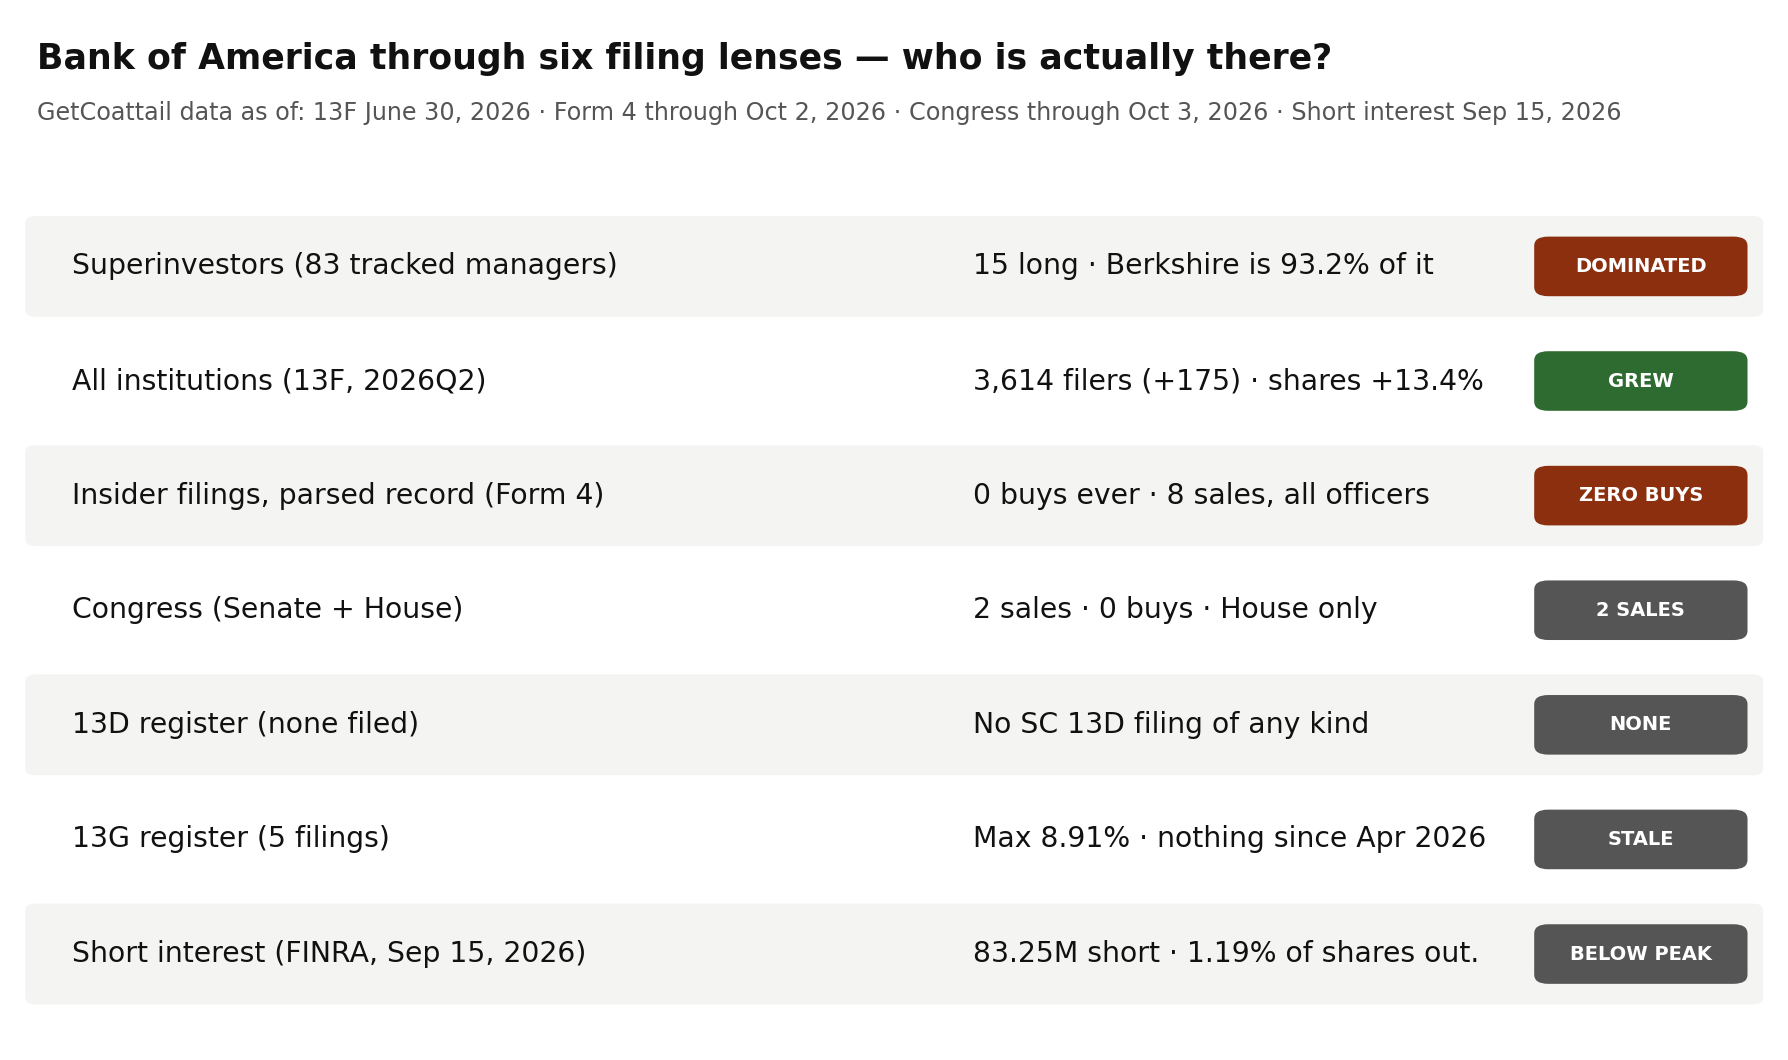
Lens 2 — institutions: 175 more filers, 627.7 million more shares. At June 30, 2026, 3,614 institutions reported positions, up 175 from 3,439 at March 31 (+5.09%), 3,601 of them long. Reported shares rose 13.37%, from 4,695,080,211 to 5,322,821,652 shares — up 627,741,441 shares in the same quarter the tracked cohort was cutting. Reported aggregate value rose 32.34% to $299,695,989,046; the aggregate includes option rows, so we headline filer and share counts and label dollars "reported" (see methodology).
Lens 3 — insiders: no purchase in the entire parsed record. The parsed Form 4 record holds 158 filings through October 2, 2026. Across the whole record, purchases total 0 transactions — in every window, for officers and non-officers alike. Sales total 8 transactions totalling 767,537 shares and $37,842,763.98, by seven sellers, all eight of them officer sales. The last year holds 78 filings with seven sales — 619,146 shares for $31,081,031.29 — and the last 90 days hold four filings with no purchase and no sale at all. What this record has never contained, at any price in the file — including the $46.72 closing low of March 13, 2026 — is an insider paying market price for a share. We assign no motives.
Lens 4 — Congress: two recorded sales, no purchases, House side only. The combined record (as of October 3, 2026) records two sale transactions and no purchase. The House aggregate (October 3, 2026) holds the same two sales; the Senate aggregate (October 1, 2026) carries no row at all. The aggregates' member and party fields for this name print empty, so this audit reports the counts the aggregates state and nothing more.
Lens 5 — the 5% register: five filings, all passive, anchored by Berkshire. Our full parse holds exactly 5 SC 13D/G filings — one SC 13G and four SC 13G/A, and no SC 13D filing of any kind — 56 reporting-person rows across 31 names as filed, most recently filed April 29, 2026, matching the site aggregate on every field. The register's maximum is The Vanguard Group at 651,058,822 shares (8.91%) as of December 31, 2025. Berkshire Hathaway Inc. prints a two-step chain: 680,233,587 shares (8.9%) as of December 31, 2024, then 568,070,012 shares (7.8%) as of September 30, 2025. The Vanguard Group prints 0 shares (0.0%) as of March 13, 2026, while Vanguard Capital Management prints a separate row of 471,311,773 shares (6.59%) as of March 31, 2026; we report them as filed and do not merge them.
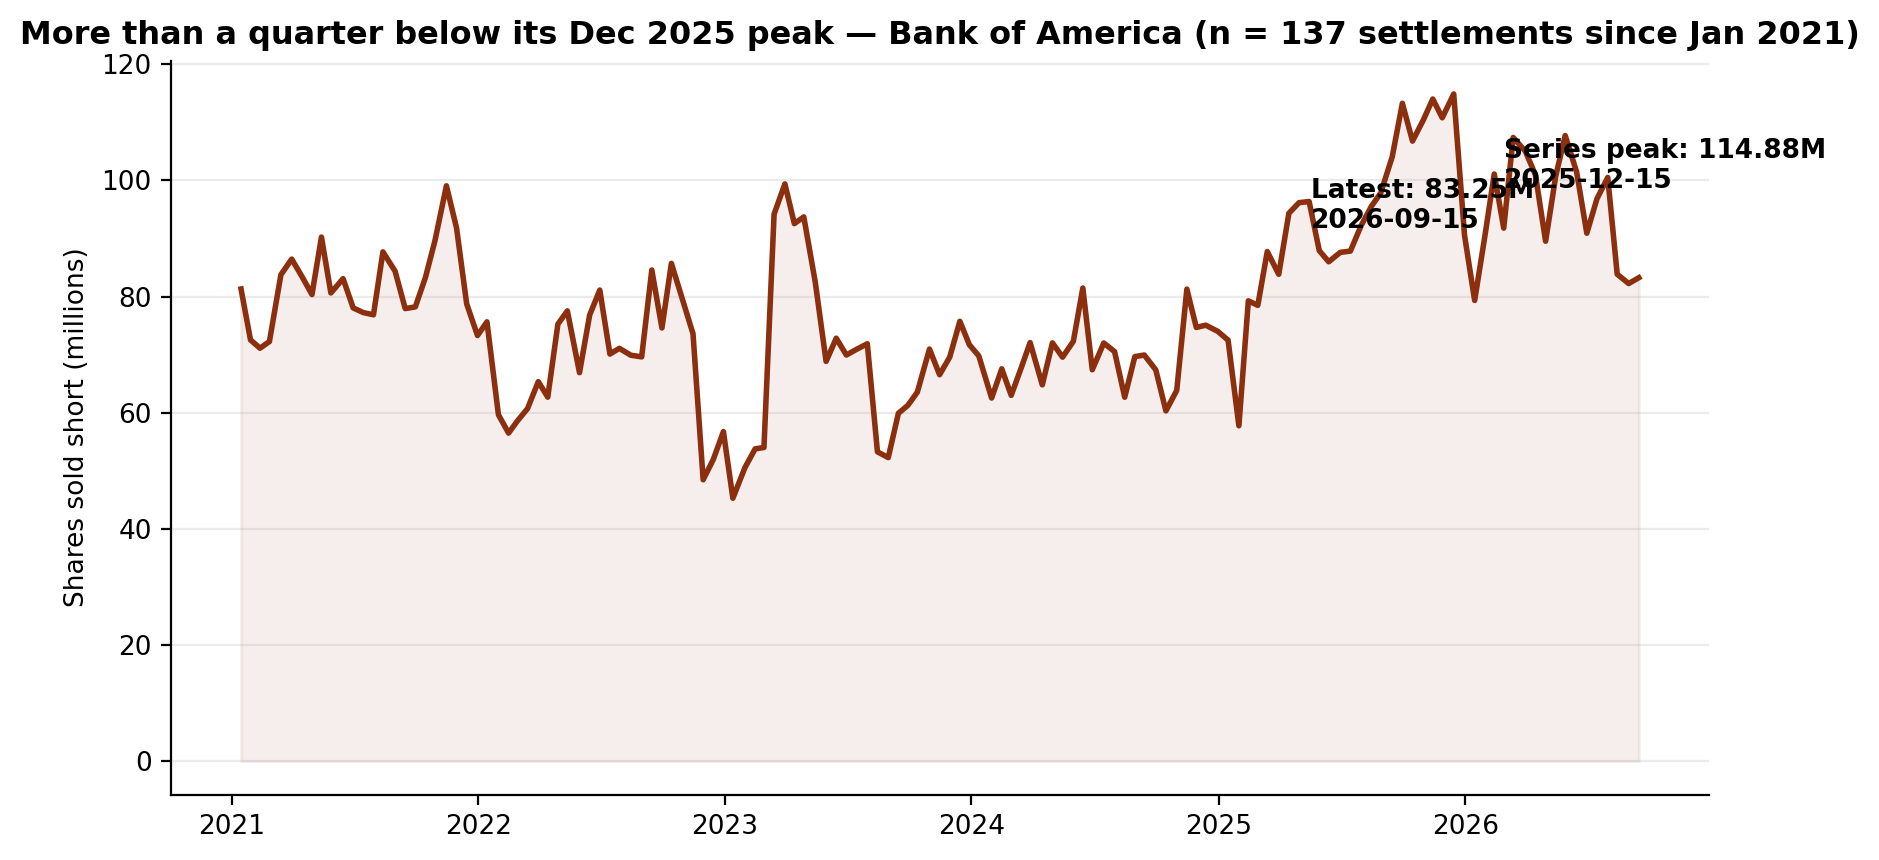
Lens 6 — short interest: 83,249,868 shares, more than a quarter below its peak. As of September 15, 2026 — the most recent of 137 FINRA settlements since January 15, 2021 — 83,249,868 shares were sold short, up 1.22% from the prior settlement's 82,250,230 shares on August 31, 2026. The series maximum is 114,878,738 shares on December 15, 2025 — verified by a maximum query over the whole series — so the latest sits 27.5% below that peak. The last five settlements read 96,837,373, 100,510,154, 83,850,746, 82,250,230 and 83,249,868: a step down in August, then a small uptick. Against the year-ago 104,086,178 shares the latest is down 20.0%; against the June 30, 2026 settlement of 90,912,451 shares it is down 8.4%. Against 6,992,748,365 shares outstanding, it is 1.19% of the share count, at 2.39 days to cover.
The Gap
The narrative describes a bank that beat second-quarter estimates — $1.21 against $1.13 expected, revenue up 15% — reporting again on October 14 with a $64.22 consensus target against a $53.75 close on October 2. The filings describe concentration at the top of the register and accumulation underneath it. The tracked superinvestors held 548,089,037 shares at March 31; at June 30 they held 518,625,474 — down 29,463,563 shares, with ten of fifteen holders cutting, two exiting, and 93.2% of what remains in Berkshire Hathaway, which itself cut 5.9% in a quarter when the price rose 16.9%. The full market moved the other way: 5,322,821,652 reported shares, up 627,741,441, across 3,614 filers. The 5% register printed five filings, all passive, none since April. Insiders recorded no purchase in 158 filings, ever, in our parse, against eight sales, all by officers. Congress records two sales and no purchases. And the borrow stands at 83,249,868 shares — 27.5% below its December 2025 peak, 20.0% below a year ago, 1.19% of the shares outstanding. One plausible reading is that the second quarter's rise was carried by the broad register while the tracked cohort — above all its dominant holder — took shares off. The record supports each clause separately; it does not say whether the broad register is early or the narrow one is right.
What Would Change the Picture
Nothing above is a recommendation. It is a record. These are the filings that would change the description:
- 1. The 2026Q3 13Fs (filing window closing mid-November 2026). The cohort held 518,625,474 shares at June 30, after cutting 5.38% in a rising quarter, and Berkshire alone held 483,394,015 of them after cutting 5.9%. Whether Berkshire rebuilds, holds or cuts again is the first thing the next register answers.
- 2. A first insider purchase, ever, in the parsed record. The record holds zero purchases across 158 filings through October 2, 2026, against eight sales. A single purchase breaks the pattern.
- 3. A new 5% filing, at any size. The register's latest filing is dated April 29, 2026. A third print in the Berkshire chain, a fresh Vanguard row — or a first SC 13D of any kind — restarts this lens.
- 4. Whether the borrow keeps easing, or rebuilds. Short interest stands at 83,249,868 shares, 27.5% below the peak of 114,878,738 and 8.4% below the June 30, 2026 settlement of 90,912,451. A reading above that June settlement reverses the recent easing; one below the August 31 reading of 82,250,230 extends it.
- 5. A first congressional purchase, in either chamber. The combined record holds two sales and no purchases, both on the House side, and the Senate aggregate has no row. A single recorded purchase — or any Senate row — gives this lens a new entry.
Until one of those prints, the record describes a stock held by fifteen of our 83 tracked superinvestors — 518,625,474 shares, 93.2% in one holder that trimmed 5.9% in the quarter its price rose 16.9% — whose insiders have recorded no purchase in the parsed record, whose 5% register has printed nothing since April, and whose borrow stands at 1.19% of the shares outstanding.
As-of & Limits
The lenses rest on different clocks, none live: 13F is a June 30, 2026 snapshot published up to 45 days later; Form 4 runs through October 2, 2026; Congress through October 3, 2026 (Senate October 1); 13D/G through the April 29, 2026 filing; short interest through September 15, 2026; prices end October 2, 2026. Three limits are specific to this name: the site's 90-day insider aggregate carries no row, so Lens 3 rests entirely on the full parse; the congressional aggregates print empty member and party fields, so Lens 4 reports counts only; and the full-market aggregate's reported value implies $56.30 per share against the $56.98 close, so this audit headlines filer and share counts. The October 14 earnings postdate every filing lens here.
Related reading: Eight of 83: The Superinvestors Cut Citigroup 15.0% While the Price Rose 23.4%. Its Insiders Have Never Bought a Share. — Filing Tape #68; One of 83: The Only Superinvestor in PPL Is Brand New. Its Insiders Have Never Bought a Share. — Filing Tape #67; Two of 83: The Superinvestors Cut Reddit 18.9% in Q2. No Officer Has Ever Bought a Share. — Filing Tape #66. Bank of America's own page: Bank of America Corp (BAC) on GetCoattail.
Methodology and data notes
- Superinvestor lens: 83 managers collected directly from SEC EDGAR Form 13F (managers_13f collection), positions as of June 30, 2026; Bank of America identified by CUSIP 060505104. Fifteen distinct managers hold a long position totalling 518,625,474 shares; there are no option rows for this name in the collection. The direction count on the collection's labels, across the long rows, is ten DECREASED (Arnold Van Den Berg - Century Management, Christopher Davis - Davis Advisors, David Katz - Matrix Asset Advisors, Dodge & Cox Funds, Harry Burn - Sound Shore, John Rogers - Ariel Investments, Mairs & Power Funds, Richard Pzena - Pzena Investment Management, Tweedy Browne, Warren Buffett - Berkshire Hathaway), three UNCHANGED (Francis Chou - Chou Associates, Glenn Greenberg - Brave Warrior Advisors, Kahn Brothers Group), one INCREASED (Bill Nygren - Oakmark Funds) and one NEW (Ruane Cunniff LP); the collection's exit list contains two Bank of America rows (Li Lu - Himalaya Capital Management, 2,997,987 shares previously; Steven Check - Check Capital Management, 12,032 shares previously). Quarter-to-quarter cohort totals (548,089,037 long shares at March 31; 518,625,474 long shares at June 30, a change of -29,463,563 shares or -5.38%) are from the site pipeline's holdings files on the same CUSIP basis in both quarters, and the pipeline's second-quarter totals match the EDGAR collection exactly on both shares and value (differences of 0 shares and $0). Berkshire Hathaway's share of the cohort is 93.2% = 483,394,015 / 518,625,474.
- Full-market lens: SEC Form 13F Data Sets full-market aggregation. The primary table is the full13f collection's by-ticker file (holders = distinct filers reporting the CUSIP; 3,601 reported long positions out of 3,614 filers). Bank of America reports under a single CUSIP, 060505104, and the backfill fixtures' by-CUSIP row matches the by-ticker row exactly on holders, shares, reported value, prior holders and prior value. The by-ticker file's entered/exited fields (2,154 and 1,979, a net of +175 that matches the change in holder count) are gross flows, so this audit headlines the net change. Reported-value caution: the aggregate value ($299,695,989,046 over 5,322,821,652 shares) implies $56.30 per share against a June 30, 2026 close of $56.98 in our price file, a gap of -1.2% — printed here as found. The aggregate sums the VALUE of every information-table row — including put and call option rows — while the share count covers long common-stock rows only, so we headline filer and share counts and label dollar values "reported."
- Insider lens: full-parse Form 4 aggregation (agg_by_ticker), record as of October 2, 2026 (158 filings). Sale and purchase counts are transaction-code counts (S and P) in non-derivative rows; grants and exercises are not counted as purchases, and one filing can contain many transaction rows. Purchase transactions total 0 across the parsed record (0 shares, $0, zero buyers) and officer purchase transactions total 0 in the 90-day window, the last year and the full record alike (officerBuyTx 0 and officerBuyValUsd $0 in each). Sale transactions total 8 across the record (767,537 shares, $37,842,763.98, seven sellers, all eight recorded as officer sales); the last year holds seven (619,146 shares, $31,081,031.29, seven sellers, all officer sales) alongside no purchases, and the 90-day window holds 0 sales and no purchases across four filings. The site's insider aggregate (compiled as of October 13, 2026, 90-day window) carries no Bank of America row at all, so there is no site figure to reconcile against the full parse for this name; this audit prints the full parse as the record. No field of the full-parse aggregate had to be excluded: its sale-value totals imply $50.20 per share for the one-year window and $49.30 across the full record, each inside the traded price range of its window on our price file ($46.72 to $64.81 for the one-year window's dates, and $25.17 to $64.81 across the price file), so all value totals are cited as figures in this article.
- 13D/G lens: full-parse SC 13D/G parsed filings (5 filings matching issuer CIK 70858 on CUSIP 060505104, 56 reporting-person rows across 31 names as filed: one SC 13G filing and four SC 13G/A amendments, no SC 13D filing), filings through April 29, 2026. The site aggregation's by-ticker row for Bank of America (5 filings, 0 D-filings, 5 G-filings, 4 amendments, 31 reporters, latest date April 29, 2026, maximum 8.91% and 6,506,427,864 reported shares) matches the parsed filings on every field. The parsed reporting-person rows sum to 6,506,427,864 shares, but that total sums reporting-person rows across different dates — including parent and subsidiary rows inside the Berkshire filings that describe the same underlying position — so it is not used as a stake figure in the article. The Vanguard Group's row (651,058,822 shares at 8.91% as of December 31, 2025, filed January 30, 2026, SC 13G/A — the register maximum), Berkshire Hathaway Inc.'s two rows (680,233,587 shares at 8.9% as of December 31, 2024, filed February 14, 2025; 568,070,012 shares at 7.8% as of September 30, 2025, filed November 14, 2025), The Vanguard Group's second row (0 shares at 0.0% as of March 13, 2026, filed March 26, 2026, SC 13G/A) and Vanguard Capital Management's row (471,311,773 shares at 6.59% as of March 31, 2026, filed April 29, 2026, SC 13G) are reported as filed, under the names exactly as they appear. The two Vanguard-named rows are separate reporting persons as filed and are not merged in this audit. The parsed coverage for this issuer holds these 5 filings; a 5% holder that has not filed in the covered window would not appear here.
- Congress lens: Senate PTR archive and House PTR archive as maintained on this site. The combined record (as of October 3, 2026) and the House aggregate (as of October 3, 2026) each record two sale transactions and no purchase for this ticker, and the Senate aggregate (as of October 1, 2026) carries no Bank of America row at all. The combined and House rows print a member count of 0 and an empty party list, so this audit reports the transaction counts only and does not reconstruct individual filers beyond what the aggregates state.
- Short interest lens: FINRA Equity Short Interest files (biweekly settlement dates), collected directly from FINRA's public distribution. The published series covers 137 settlements from January 15, 2021 (81,307,601 shares) to September 15, 2026. The latest reading is 83,249,868 shares on September 15, 2026, up 1.22% from the prior settlement (82,250,230 on August 31, 2026), which had fallen from 83,850,746 on August 14, 2026, following 100,510,154 on July 31 and 96,837,373 on July 15 — the last five settlements step down in August and tick up at the latest print rather than trending in a straight line. The series maximum is 114,878,738 shares on December 15, 2025 (verified by a maximum query over the series, not read off the latest row), so the latest reading sits 27.5% below the peak. The year-ago settlement (September 15, 2025) printed 104,086,178 shares, so the latest reading sits 20.0% below a year ago. The series minimum is 45,282,127 shares on January 13, 2023. The June 30, 2026 settlement printed 90,912,451 shares, so the latest reading sits 8.4% below the 13F snapshot date's borrow. FINRA publishes each settlement about two weeks after the fact, so the October price action is not yet in this series. The share-count ratio (1.19%) uses the fundamentals file's shares-outstanding figure below.
- Fundamentals note: our fundamentals collection carries Bank of America's revenue of $113,097,000,000, net income of $30,509,000,000 and assets of $3,411,738,000,000, each labelled fiscal 2025 in the file. The file is marked ok for this name, with no missing fields: shares outstanding of 6,992,748,365 (as of July 30, 2026 in the file, sourced in the file to a dei share count) and a file-computed market value of $378,237,760,129.86. The file's price for the name is $54.09 as of October 6, 2026; our daily-close file ends October 2, 2026 at $53.75, and we keep the two files' figures separate rather than blending them.
- Prices: our own daily-close file for Bank of America through October 2, 2026 ($53.75 close, -2.3% year to date on that file; 252-session closing high $64.81 on August 12, 2026, so the last close sits 17.1% below it; 252-session closing low $46.72 on March 13, 2026; closes of $48.75 at March 31, 2026 and $56.98 at June 30, 2026, a second-quarter change of +16.9%; change from June 30 to October 2 of -5.7%; change from the 252-session low of +15.0%; change from the September 30, 2025 close of $51.59 of +4.2%). The series in our price file begins June 1, 2021 at $42.92 and holds 1,342 rows.
- Market context sources: MarketBeat financial-stocks list for October 13, 2026, as carried by Stock Observer (Bank of America ranked third, behind JPMorgan Chase and Citigroup; checked October 14, 2026); third-quarter 2026 earnings scheduled before the open on October 14, 2026 with an 8:30 a.m. ET call and a consensus of $1.10 per share on $30.58 billion of revenue, as reported by Watchlist News on October 13, 2026 and cross-checked against MarketBeat's earnings calendar, checked October 14, 2026; second-quarter 2026 earnings of $1.21 per share against a $1.13 consensus and revenue of $31.6 billion, up 15% year over year, with net income of $9.1 billion, as reported on the company's July 14, 2026 earnings call and cross-checked against multiple July 2026 reports of the same print, checked October 14, 2026; the MarketBeat consensus (moderate buy, average target $64.22) and the TD Cowen hold initiation with a $60 target on October 8, 2026, as carried by MarketBeat-derived reports in October 2026, checked October 14, 2026. Figures we could not confirm against two sources were left out; the external items above are reported speech from those outlets, not GetCoattail measurements.
- Bank of America is in the GetCoattail stock-page universe: Bank of America Corp (BAC) stock page. Series data: bac_lens_data.csv · bac_short_interest_series.csv. Earlier audits: Citigroup · PPL.
Past patterns are not a promise of future results. For education only — not investment advice.
This article describes public filings as of the dates stated. It is not investment advice and makes no recommendation. Filings lag reality: 13F positions are as of June 30, 2026, and later trading is not yet public.
Revision history
- v1.0 — October 14, 2026: first publication.