GetCoattail Research — a filings audit of Insmed Inc. (INSM) through six filing lenses, as of the latest filings. Past patterns are not a promise of future results. For education only — not investment advice.
The Hype
Insmed Inc. (INSM) is a Nasdaq-listed biopharmaceutical company (SIC 2834) whose portfolio centers on BRINSUPRI (brensocatib) for non-cystic fibrosis bronchiectasis and ARIKAYCE for refractory MAC lung disease. FY2025 filings show revenue of $606,423,000, a net loss of $1,276,775,000, and total assets of $2,264,558,000; shares outstanding are 218,381,503 (July 31, 2026), about $24.6 billion at the latest close.
The price file tells a rebound story. INSM closed at $112.58 on October 30, 2026 — up 3.67% over 21 trading days (from $108.59 on October 1), up 14.35% over 63 trading days (from $98.45 on August 3), up 5.59% since June 30 ($106.62), but down 35.31% year to date (from $174.04 on December 31, 2025), and down 42.03% over one year (from $194.22 on October 30, 2025). The 252-trading-day range to October 30 runs $91.88 (June 10, 2026) to $211.41 (December 1, 2025): the latest close sits $20.70 above the low. Volume on October 30 was 5,184,139 shares (21-day average 3,763,954).
Against that tape, the company announced the Japan launch of BRINSUPRI 25 mg tablets on October 19, 2026 (company news release). The question is what the filings recorded while the price rebounded from near its 252-day low: did the tracked funds, the broad market, insiders, Congress, or the control register move with the slide, against it, or not at all?
The Tape
| Lens | As of | What the filings show | Direction vs prior period |
|---|---|---|---|
| Superinvestors (13F) | Jun 30, 2026 | 6 of 147 tracked managers hold; 17,866,711 shares ($1,904,948,727). Baker Bros. is 49.2%. | NEW 1 · INCREASED 3 · UNCHANGED 1 · DECREASED 1; 1 exit (Axiom) |
| All institutions (13F) | Jun 30, 2026 | 666 filers hold 223,141,214 shares ($23,482,925,885). | Shares +14.87%; filers +3 net (604 entered, 601 exited) |
| Insiders (Form 4) | Oct 2, 2026 | 0 buys, 12 sells in 90 days; 330,724 shares, $42,941,204.03. | Same 5 sales in the site aggregate as of Oct 31, 2026; year window: 0 buys, 169 sells |
| Congress | Oct 3, 2026 | 1 member: 0 purchases, 1 sale; Senate: none. | Sale Jun 10, 2026, $1,001–$15,000, filed Jul 7 (27 days) |
| 13D/G | Aug 14, 2026 | 16 filings in the site collection, all 13G-family; 0 Schedule 13D; max 10.18%. | 13 amendments; 365,479,230.2 shares reported in total (reporter-row sum, not ownership) |
| Short interest | Sep 15, 2026 | 10,802,070 shares short, 4.95% of shares outstanding, 5.27 days to cover; fails 0. | Short below the Jun 30 level of 16,030,053; fails 0 on every settlement since Jun 30 |
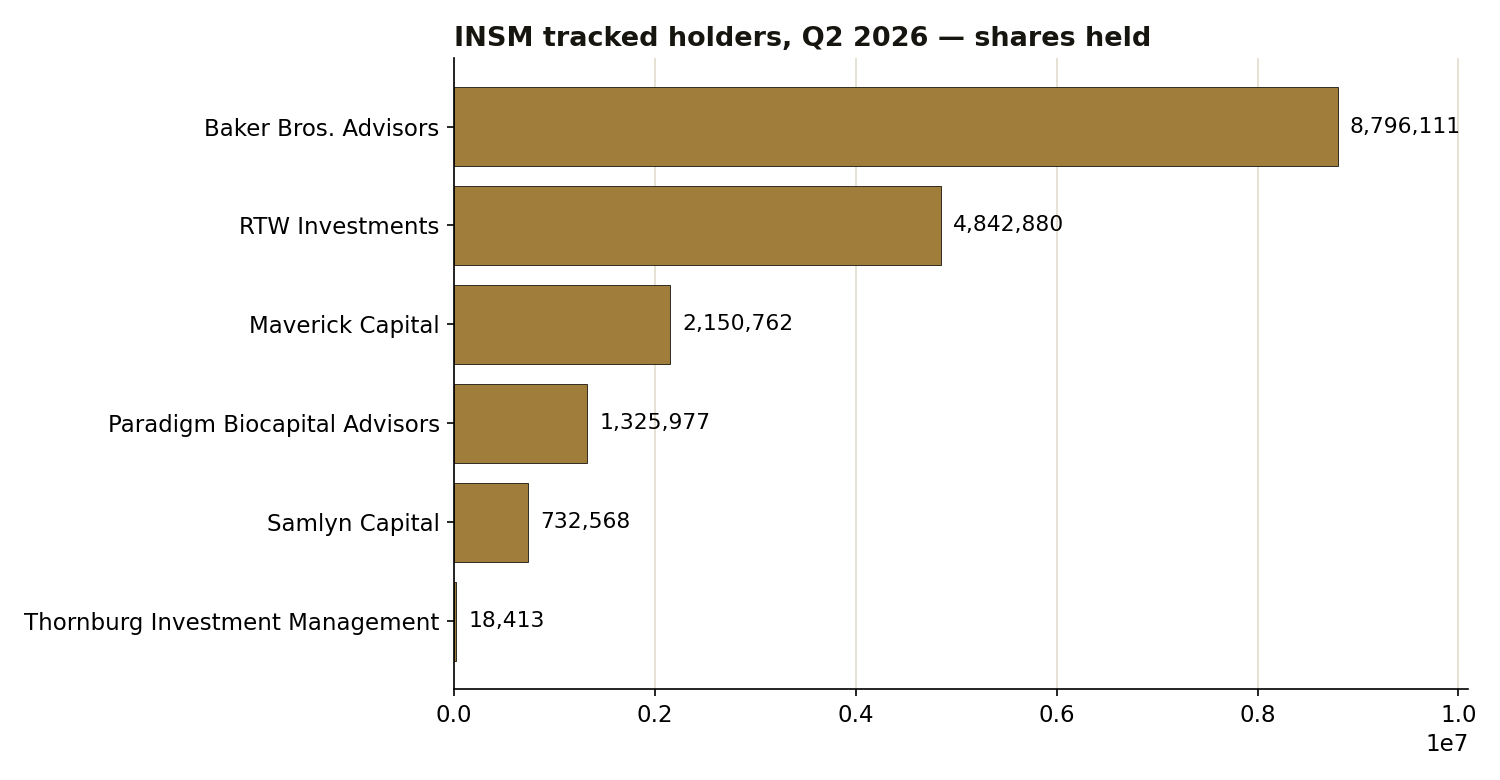
Superinvestors. Six of 147 tracked managers hold 17,866,711 shares — $1,904,948,727 reported — and one fund is nearly half of it. Baker Bros. Advisors holds 8,796,111 shares (49.2% of the tracked stake, 4.7% of its portfolio), INCREASED +18.5%, filed August 14, 2026. RTW Investments holds 4,842,880 shares (27.1%, 4.41% of its portfolio), UNCHANGED, filed August 14, 2026. Maverick Capital (Lee Ainslie) is the one NEW holder with 2,150,762 shares (12.0%, 2.03% of its portfolio), filed August 14, 2026. Paradigm Biocapital Advisors holds 1,325,977 shares (7.4%, 2.65% of its portfolio), INCREASED +5.7%, filed August 14, 2026. Samlyn Capital holds 732,568 shares (4.1%, 1.27% of its portfolio), INCREASED +75.6%, filed August 14, 2026. Thornburg Investment Management holds 18,413 shares (0.1%, 0.02% of its portfolio), DECREASED −52.0%, filed August 13, 2026. One prior-quarter holder exited in Q2: Axiom Investors, prior-quarter position recorded as 239,447 shares ($39,154,373). The tracked stake is 8.18% of shares outstanding and 8.0% of all institutions' reported shares. Counting notes: the stock page links 7 fund pages because exited Axiom is still linked — Q2 holders are 6, not 7 — and the denominator is 147 funds with usable Q2 data, not the 149-fund roster. The Q2 file gives direction labels and rounded change percentages only, so no Q1 share count per holder is stated here.
All institutions. The broad market added shares while its reported value fell. Filers rose by 3 net to 666, of which 663 are long, while reported shares rose 14.87% (from 194,250,934 to 223,141,214) and reported value fell to $23,482,925,885 (from $30,709,821,221). Behind the net +3, 604 filers entered and 601 exited. Value fell while shares rose because the price fell — a price effect, not a data error. The Q2 snapshot ends June 30, before the rebound to October 30, so the two are not read as one move.
Insiders. This lens is one-sided in every window the data reaches. In the 90 days to October 2, 2026, there are 12 open-market sales and 0 open-market buys: 5 sellers, 330,724 shares, $42,941,204.03, recomputed trade by trade from 7 parsed Form 4 filings. The sales are Flammer Martina M.D. (officer, Chief Medical Officer, direct) on July 6, 2026: 4,854 shares at $109.02 ($529,183.08) and 7,448 shares at $110.60 ($823,748.80); Lewis William (officer, Chair and CEO, also a director, direct) on July 9: 5,005 shares at $116.55 ($583,332.75), 2,335 shares at $117.62 ($274,642.70), and 3,359 shares at $118.52 ($398,108.68); Lewis again on July 23: 4,828 shares at $105.62 ($509,933.36) and 5,872 shares at $106.43 ($624,956.96); Flammer again on August 6: 8,895 shares at $127.00 ($1,129,665.00) and 18,278 shares at $129.40 ($2,365,173.20); Adsett Roger (officer, Chief Operating Officer, direct) on August 10: 239,850 shares at $133.27 ($31,964,809.50) — 74.4% of the window's sale value in a single trade; Sharoky Melvin MD (director, indirect) on August 17: 5,000 shares at $127.53 ($637,650.00); and Brennan David R (director, direct) on September 9: 25,000 shares at $124.00 ($3,100,000.00). M-code rows in the same 7 filings (option exercises at $13.67–$30.46) are not open-market buys and are excluded from every buy count. The site aggregate as of October 31, 2026 shows the same 5 sales in its 90-day window (4 sellers, $39,197,297.70): its window starts around July 29, so the July rows fall outside it, and its 5 rows are the August 6 – September 9 subset, re-summed exactly. The wider windows are also buy-free: the year window holds 169 sales (1,097,136 shares, $167,122,952.93, 10 sellers, 0 buys); the corpus aggregate holds 369 sales (2,908,996 shares, $340,421,990.21, 12 sellers) with exactly 2 buys, both May 2025 — Desjardins Clarissa (director, indirect), 1,895 shares at $66.87 on May 20, 2025 ($126,718.65) and 1,130 shares at $66.35 on May 21 ($74,975.50), totaling 3,025 shares ($201,694.15). Those buys fall outside the year window and are stated so "insiders never bought" is never written from this article.
Congress. One sale, no purchases, nothing from the Senate. Combined House/Senate data as of October 3, 2026: 0 purchases, 1 sale; no Senate row, so the sale is House-side. Rep. Josh Gottheimer (Democrat, U.S. House) reported a sale (partial) of Insmed common stock, transacted June 10, 2026, notified July 7, 2026, amount $1,001–$15,000, House PTR Filing ID #20034938, filed July 7 — 27 days after the trade, inside the 45-day STOCK Act window, so not described as late. The owner code is JT (joint) as printed in the PTR text row. Member page, PTR PDF, and staging row agree on member, ticker, type, date, and amount.
13D/G. The control register is passive — index holders, no activist. In the site's 13D/G collection, 16 filings match CUSIP 457669307: 0 Schedule 13D, 16 Schedule 13G-family filings, 13 amendments, 10 reporters, latest filing August 14, 2026, maximum reported stake 10.18%. The 28 reporter rows sum to 365,479,230.2 shares — a reporter-row sum, never shares owned: joint filings count the same position more than once, and amendments across time are all included. Key rows: The Vanguard Group — SC 13G/A, event December 31, 2024, filed January 8, 2025, 18,218,973 shares, 10.18% (the maximum); latest filings, both August 14, 2026: JPMorgan Chase & Co. — SC 13G/A, event June 30, 2026, 10,365,622 shares, 4.7%, and Darwin Global Management, Ltd. — SC 13G/A, event June 30, 2026, 6,431,163 shares, 3.0%. A 17th parsed file (JPMorgan SC 13G/A, filed September 4, 2025) has no reporter rows and is excluded and documented here, not silently dropped. Phrasing is collection-scoped on purpose: exhaustiveness for 2025 was not established, so no claim that only 16 such filings exist is made. A separate older corpus (31 rows, January 29, 2021 to November 14, 2024; max 12.9%) is never merged into this series, and its blank share counts mean its shares are never summed.
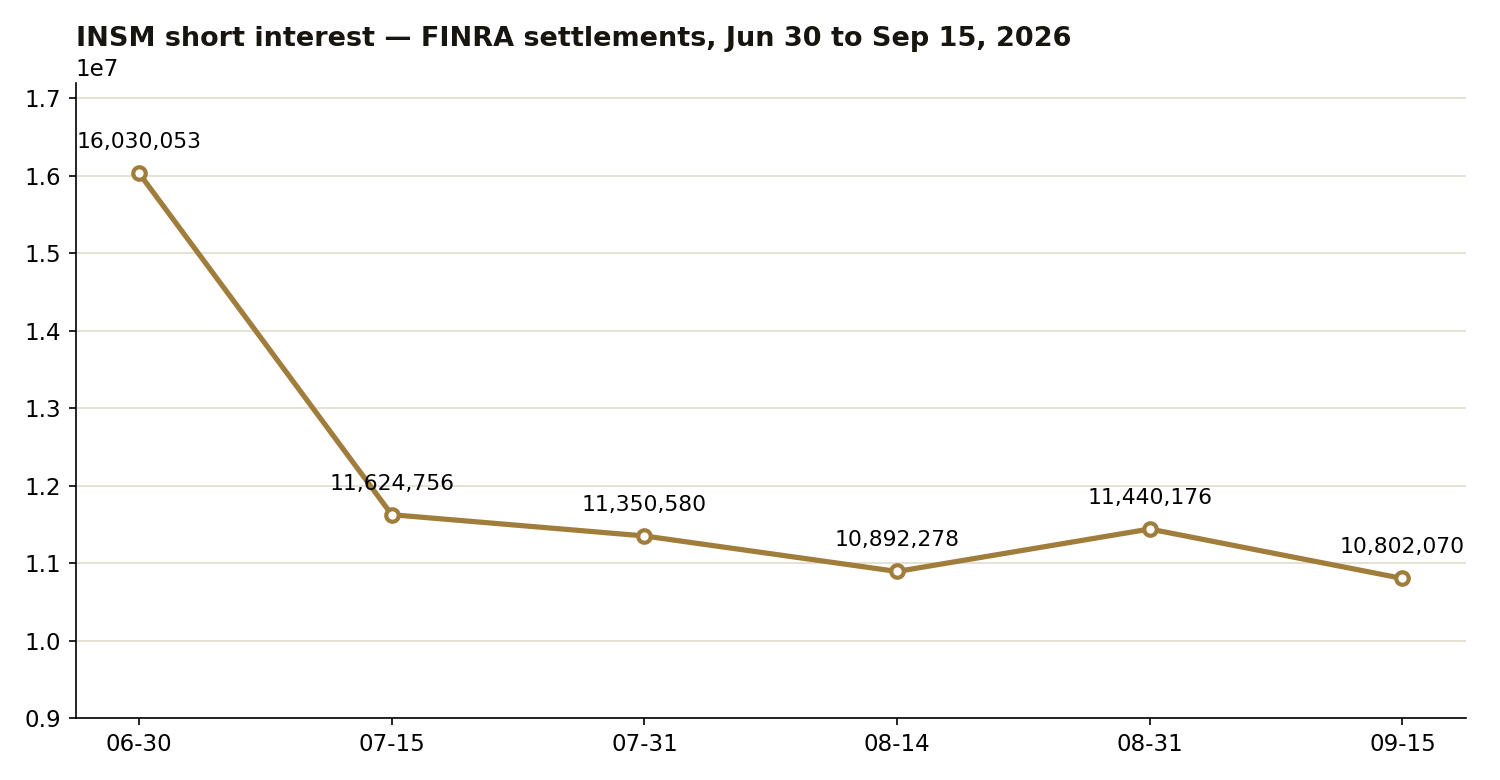
Short interest. The bear trade is shrinking and the fails footprint is zero. FINRA short interest: 10,802,070 shares at September 15, 2026, 5.27 days to cover, 4.95% of shares outstanding (218,381,503 as reported July 31, 2026, the stock page's base). Series: 16,030,053 (June 30), 11,624,756 (July 15), 11,350,580 (July 31), 10,892,278 (August 14), 11,440,176 (August 31), 10,802,070 (September 15) — down 32.6% from June 30, with a small August 31 bounce. Fails-to-deliver: 0 on every settlement, June 30 through September 15. No squeeze footprint in this lens.
Prices and fundamentals. Last close: $112.58 on October 30, 2026 (open $113.60, high $116.37, low $111.97, volume 5,184,139; 21-day average 3,763,954). Changes: +3.67% over 21 trading days (from $108.59, October 1), +14.35% over 63 (from $98.45, August 3), +5.59% since June 30 ($106.62), −31.15% since March 31 ($163.52), −35.31% year to date (from $174.04, December 31, 2025), −42.03% over one year (from $194.22, October 30, 2025). Closes are split-adjusted Yahoo bars as used by the site, not dividend-adjusted total return. Supplementary page context: the stock page's recent 8-K block lists October 20 and October 5, 2026 (Items 5.02, 7.01, 9.01) and August 6, 2026 (Items 2.02, 9.01).
The Gap
The price rebound and the filing tape do not tell the same story, and the difference is in the windows. The broad base added 14.87% in shares during Q2, but that snapshot ends June 30 — before the 5.59% rise to October 30 — so it cannot explain the rebound, and the tracked book inside it is split: 1 new, 3 adding, 1 unchanged, 1 trimming, 1 exited. No net tracked direction is claimed: Q1 share counts per holder are not in the data. What the tape shows, in every window, is one-sided insider action: 0 buys against 12 sales in 90 days, 0 against 169 in the year window, and only 2 buys — both May 2025, $201,694.15 — against 369 sales in the corpus. Against $42,941,204.03 of 90-day insider sales, the single Congress sale sits in the $1,001–$15,000 range — a different scale, and a range, not an amount. The control register adds no activist pressure: 0 Schedule 13D filings; largest stake a 10.18% Vanguard 13G. The short lens adds no squeeze setup: short interest fell 32.6% from June 30 even as the price rose 5.59% after June 30, days to cover 5.27, fails zero throughout. One plausible reading is that the tape shows drift, not conviction — a split tracked book, insiders selling without buying, a token-size Congress sale, passive control holders, and a shrinking short position. The record does not show a coordinated buy, and it does not show a crowded short either.
What Would Change the Picture
Nothing above is a recommendation. It is a record. What would change it:
- Q3 13F season (filings due by November 16, 2026). Watch whether Baker Bros. adds again after +18.5%, Maverick builds on its NEW position, Thornburg exits after −52.0%, Axiom returns after its Q2 exit, or any new tracked holder appears.
- A first open-market insider buy in any window would break a buy-free record spanning the 90-day and year windows; a sixth 90-day seller would widen a five-name seller list.
- A Congress purchase, a second member, or a first Senate transaction would change a lens holding one House sale and no Senate row.
- A first Schedule 13D filing, or a 13G above 10.18%, would change a control register with no activist filing and a 10.18% Vanguard maximum.
- Short-interest direction. A rise back above the June 30 level of 16,030,053 shares, or fails above 0 after six straight zero settlements, would each give the short lens something new.
As-of & Limits
| Lens | As of | Limit or note |
|---|---|---|
| Superinvestors (13F) | Jun 30, 2026 | 13F figures are as of June 30, 2026, the quarter-end. Funds have up to 45 days after quarter-end to file, so this is the most recent complete picture — and it is always a lagging one. Single CUSIP 457669307. Denominator 147 = funds with usable Q2 data (roster 149); the stock page links 7 fund pages because exited Axiom is still linked. Q1 share counts per holder are not in any workspace file found, so direction labels and rounded change percentages only are stated; no Q1 share count is backed out from a rounded percentage. Q3 filings are due by November 16, 2026 and are not in this article. |
| All institutions (13F) | Jun 30, 2026 | By-ticker row is the SEC 13F dataset row for INSM; it matches the stock page's all-institutions panel exactly. Reported value fell while shares rose because the price fell. |
| Insiders (Form 4) | Oct 2, 2026 | This lens counts only P and S codes. In 90 days: 7 filings, 0 buys, 12 sells (330,724 shares, $42,941,204.03); in the year window: 75 filings, 0 buys, 169 sells (1,097,136 shares, $167,122,952.93); in the corpus aggregate: 163 filings, 2 buys, 369 sells (2,908,996 shares, $340,421,990.21). Year and corpus figures are aggregates except for the two May 2025 buys, which are enumerated; no seller beyond the five named above is named from the aggregates. M-code rows in the 7 filings are option exercises, not open-market buys. The site aggregate as of October 31, 2026 shows the same 5 sales in its 90-day window; a writer publishing later must re-check the window. |
| Congress | Oct 3, 2026 | One member (Gottheimer, Josh, D): 0 purchases, 1 sale; Senate: no INSM row. Reported as member-disclosure aggregates, not Form 4 insider transactions, and never added to insider totals. Amounts are disclosure ranges as filed. The owner code JT (joint) is as printed in the PTR text row. |
| 13D/G | Aug 14, 2026 | Collection-scoped phrasing: in the site's 13D/G collection, 16 filings match CUSIP 457669307. Whether the collection is exhaustive for 2025 was not established, so no claim that only 16 such filings exist is made. The 28-row total (365,479,230.2) sums reporter rows and double-counts joint reporters; it is never presented as shares owned. The 2021–2024 corpus (31 rows) is a separate collection with different windows and methods and is never merged into the collection series. One parsed file with no reporter rows is excluded and documented. |
| Short interest | Sep 15, 2026 | Shares-outstanding count is as of July 31, 2026. Fails are SEC semi-monthly prints; the series is reported as settlements, not as a signal. |
| Prices | Oct 30, 2026 | Price file: daily-refresh cache (fetchedFor October 30, 2026; 501 bars, October 31, 2024 to October 30, 2026). Closes are split-adjusted Yahoo bars as used by the site, not dividend-adjusted total return. The article's price as-of date is October 30, 2026; a writer publishing later must refresh the price file and recompute the price context. |
| Fundamentals | FY2025 | Issuer CIK 1104506. FY2025 revenue, net income, and total assets collected October 7, 2026 from SEC EDGAR company filings. Market capitalisation of about $24.6 billion is computed at the October 30, 2026 close of $112.58. |
Methodology & disclaimer: 13F holdings are long shares unless stated; reported values include option rows for the all-institutions lens by definition. Short interest is FINRA twice-monthly settlements. Trading costs and taxes are not reflected in any figure. Past patterns are not a promise of future results. For education only — not investment advice.
This article describes filings and market data for education. It is not investment advice. Data: SEC EDGAR 13F (as of June 30, 2026, filed within 45 days), Form 4 aggregates checked through October 2, 2026 (and site aggregate as of October 31, 2026), House/Senate disclosures through October 3, 2026, SC 13D/G collection through August 14, 2026, FINRA short interest at September 15, 2026 settlement. 13F covers long positions of $100M+ managers only and is always a lagging picture. Trading costs and taxes are not reflected.
Related research: Ten of 147: Coatue Is 38.3% of the Tracked Equinix Stake — and Insiders Sold $4.88M With Zero Buys in 90 Days · Seventeen of 147: Eagle Is 39.8% of the Tracked MercadoLibre Stake — and the Cohort Grew 11.8% While the Price Slipped 1.8% in Q2 · Track the tape on INSM's stock page and the 13F filing season hub.
Revision history: v1.0 — November 1, 2026. Initial publication. Signals and lens aggregates: insm_13f_holders_q2.csv. Insider trades: insm_insider_form4_w90.csv. Short-interest series: insm_short_interest_ftd.csv. 13D/G rows: insm_scdg_13dg.csv.