GetCoattail Research — The Filing Tape #130. KLA surfaced on a most-viewed tickers list this week after a quarter in which its price more than doubled, and the filings carry a labelling trap: 7 of the 147 superinvestors held the stock at June 30, 2026, totalling 4,779,953 shares, and every continuing holder is labelled INCREASED — but a 10-for-1 split sits between the two quarters being compared, and split-adjusted, the six verified continuing holders grew a combined 1.3%, with three of the six actually cutting. Insiders have never bought a share in the parsed record, and short interest has fallen 42.2% from the split settlement's print.
The Hype
KLA's attention this week is a screen story with a violent price path behind it. The stock appeared on MarketCrunch AI's "Today's Most-Viewed Stocks & ETFs" list for October 19, 2026 — a live ranking of the tickers its users research most — where KLA Corp sat in the table's top ten, behind Alphabet's Class C line, UiPath, Solidion, Theriva, Trump Media and Delek Logistics. MarketCrunch AI Our price file shows why a screen would surface it: the stock rose 104.9% in the second quarter alone, from $147.241 on March 31 to $301.71 on June 30 — a close that is also the highest of the last 252 sessions — and then fell back to $206.89 by October 2, down 31.4% from the June 30 close, though still up 70.3% year to date. A doubling, a round trip of a third, and a most-viewed listing: the question the filings can answer is who was actually holding, and actually adding, while that happened.
The Tape
For KLA — the one hundred and thirtieth Filing Tape audit — the tape shows seven June holders whose increase labels were mostly written by a stock split, a verified cohort up 1.3% once the split is removed, a full market that genuinely added filers, an insider record with no purchase against 38 sales, one House member on both sides of the register, a two-filing passive 5% register, and a borrow down 42.2% from its split-settlement peak.
| Lens | As of | What the filings show | Direction vs prior period |
|---|---|---|---|
| Superinvestors (13F) | Jun 30, 2026 | 7 holders of 147 tracked managers hold 4,779,953 shares; top holder is 45.4% of the tracked stake | Labels: 6 INCREASED, 1 NEW; verified continuing cohort +1.3% split-adjusted vs Q1; one exit |
| All institutions (13F) | Jun 30, 2026 | 2,498 filers; 1,183,981,366 shares; reported value $365,802,487,032 | Filers +445; shares +17.84% split-adjusted; reported value +156.34% |
| Insiders (Form 4) | Oct 2, 2026 | No purchase in the full parsed record; 38 sales across 100 filings | Last 90 days: 0 purchases, 15 sales; last year: 0 purchases, 22 sales |
| Congress | Oct 3, 2026 | One House member: 1 recorded purchase and 1 recorded sale; no Senate row | Latest recorded purchase Jul 1, 2026 |
| 13D/G | Apr 30, 2026 | 2 parsed filings (0 SC 13D family, 2 SC 13G family); register maximum 7.49% | Latest filing Apr 30, 2026 prints Vanguard Capital Management at 7.49%, as of Mar 31, 2026 |
| Short interest (FINRA) | Sep 15, 2026 | 23,554,039 shares; 1.80% of shares outstanding; 2.50 days to cover | 42.2% below the series peak set Jun 15, 2026; down 31.5% from Jun 30, 2026; down 36.8% split-adjusted from a year ago |
Lens 1 — the superinvestors: seven June holders, six "increases" that a split wrote, a verified cohort up 1.3%. We track 149 managers whose 13F portfolios we collect from SEC EDGAR — 147 are in the collection (144 at a June 30 period-end, 3 early filers at September 30, none of them holding this name, so there is no period split) — and the June 30, 2026 register for the common stock (CUSIP 482480100) is 7 distinct managers holding 4,779,953 shares worth $1,440,457,753, long only, with no option rows and no debt rows: as filed, 6 are labelled INCREASED and 1 is NEW, with one exit. Those labels compare share counts across a 10-for-1 split, and this audit restates every comparison on a split-adjusted basis (methodology). PineStone Asset Management is the largest holder: 2,169,700 shares worth $654,620,187 — 45.4% of the tracked stake — at a 4.04% portfolio weight, labelled INCREASED +1927.0% (filed July 13, 2026); split-adjusted, PineStone genuinely doubled, +102.7%. The second holder, Winslow Capital Management, holds 1,524,800 shares (31.9%, at a 1.58% weight), so the top two hold 77.3% — 3,694,500 shares — between them; Winslow's +848.4% label is a split-adjusted cut of 5.2%. The remaining holders are Jensen Investment Management (790,391 shares, at a 5.78% weight), Guinness Asset Management (250,753 shares, at a 1.25% weight), Torray Funds (36,890 shares, at a 1.50% weight), Lee Ainslie - Maverick Capital (5,599 shares, the one NEW holder, at a 0.01% weight) and Bristol (John W. Bristol & Co.) (1,820 shares, at a 0.01% weight). The labels invert for most of the register once the split is removed: Jensen's +377.2% label is a split-adjusted cut of 52.3% — the largest holder-level reduction in the cohort — Guinness's +653.1% is a cut of 24.7%, Torray's +737.5% is a cut of 16.3%, and Bristol's +900.0% is exactly the split itself, a split-adjusted change of 0.0%. The change verifies row by row for all six continuing holders under two register methods that agree exactly (methodology): as filed, those six held 471,334 shares at March 31 and 4,774,354 at June 30 (+912.9% as filed); split-adjusted, 4,713,340 shares at March 31 and 4,774,354 at June 30 (+61,014 shares, +1.3%). The full register reconciles with no residual: 482,334 as-filed shares at March 31 (the verified 471,334, plus the 11,000 pre-split shares of the quarter's one exit, Daniel Loeb - Third Point) moving to 4,779,953 at June 30 — a split-adjusted register change of -0.9%, against the +891.0% the raw counts print. Six of the seven rows imply $301.71, the June 30 close; Guinness implies $294.92, and the cohort's blended implied price is $301.35 (-0.12% against the close). 13F figures are as of June 30, 2026, published up to 45 days later.
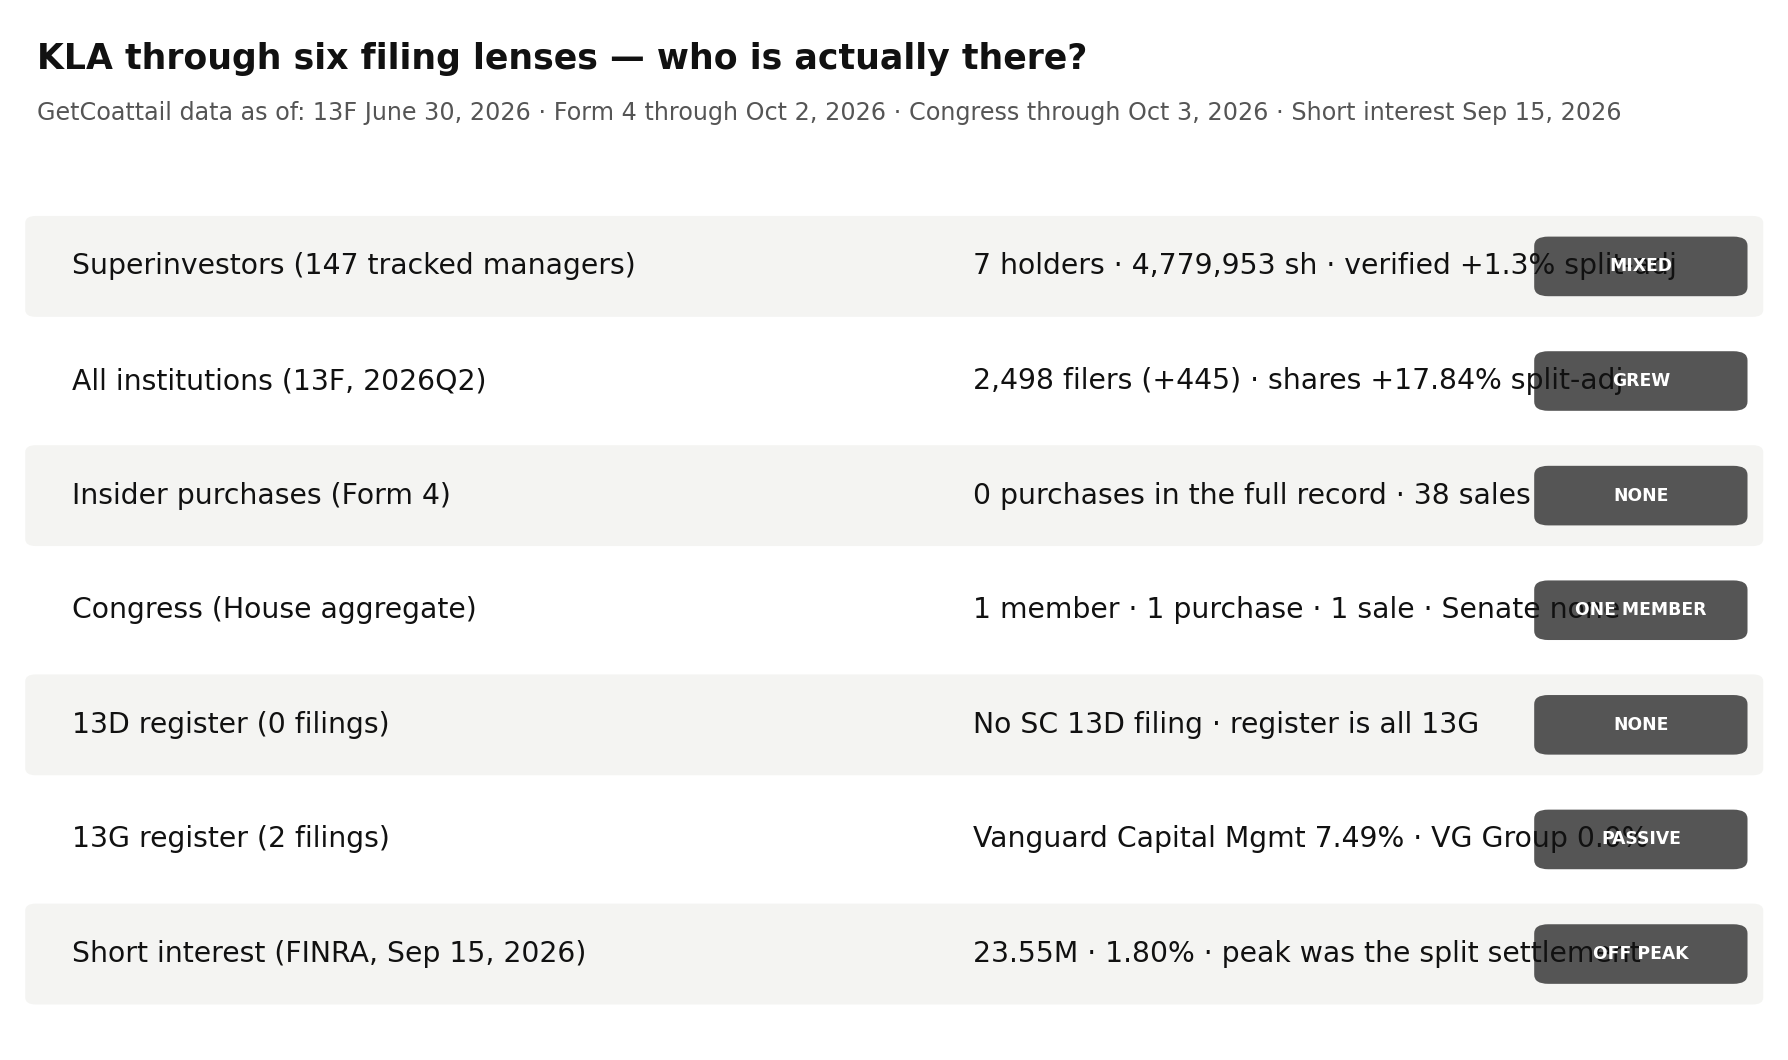
Lens 2 — institutions: 445 more filers, and a share count that survives the split adjustment. At June 30, 2026, 2,498 institutions reported positions, up 445 from 2,053 at March 31 (+21.68%); 2,481 are long. Reported shares are printed as 1,183,981,366 against an as-filed 100,476,416 a quarter earlier — the +1,078.37% that comparison prints is the split, not buying; split-adjusted, shares rose 17.84%, from 1,004,764,160 to 1,183,981,366 (+179,217,206 shares). Reported value rose 156.34% to $365,802,487,032, labelled "reported" because the aggregate includes option rows (methodology), in a quarter when the price itself rose 104.9%. Flow counts agree: 1,912 entered, 1,467 exited, net +445, and the by-CUSIP row matches the by-ticker row on every field. The reported value implies $308.96 against a June 30 close of $301.71 (+2.40%).
Lens 3 — insiders: no purchase in the entire parsed record, against 38 sales. The parsed Form 4 record holds 100 filings through October 2, 2026, and it contains no purchase transaction at all: the buy count is zero in the 90-day window, in the one-year window and across the full record. Sales run the other way. The last 90 days — entirely after the split — hold 15 sales: 362,342 shares for $72,763,766.75, by 6 sellers, every one of the 15 an officer sale. The one-year window holds 22 sales for $112,325,524.87 (7 sellers), and the full record holds 38 sales for $166,661,497.65 (7 sellers, 37 of them officer sales); share counts for the two longer windows mix pre- and post-split share scales, so this audit cites counts and dollar totals there, and shares only for the 90-day window (methodology). The 90-day sales imply $200.82 per share, inside that window's close range on our price file.
Lens 4 — Congress: one House member, on both sides. The combined record (as of October 3, 2026) and the House aggregate (as of October 3, 2026) each carry the same single row: one member, recorded with 1 purchase and 1 sale, the latest purchase dated July 1, 2026. The Senate aggregate (as of October 1, 2026) carries no row. The aggregates record counts and dates, not amounts, so that is the whole of this lens: one House member has traded this name in both directions, and no senator has a recorded transaction.
Lens 5 — the 5% register: 2 filings, every one of them passive, maximum 7.49%. Our full parse holds 2 SC 13D/G filings matching the site aggregate — 0 SC 13D family and 2 SC 13G family (1 SC 13G, 1 SC 13G/A); 1 amendment, 2 reporter names across 2 reporter rows. The maximum is 7.49%: Vanguard Capital Management printed 9,822,421 shares at 7.49% as of March 31, 2026 (filed April 30, 2026, SC 13G) — the register's latest filing. The other print is The Vanguard Group at 0 shares and 0.0% as of March 13, 2026 (filed March 27, 2026, SC 13G/A). Both reference dates precede the split, so the share counts are as-filed, pre-split scale; the percentages are unaffected by the split.
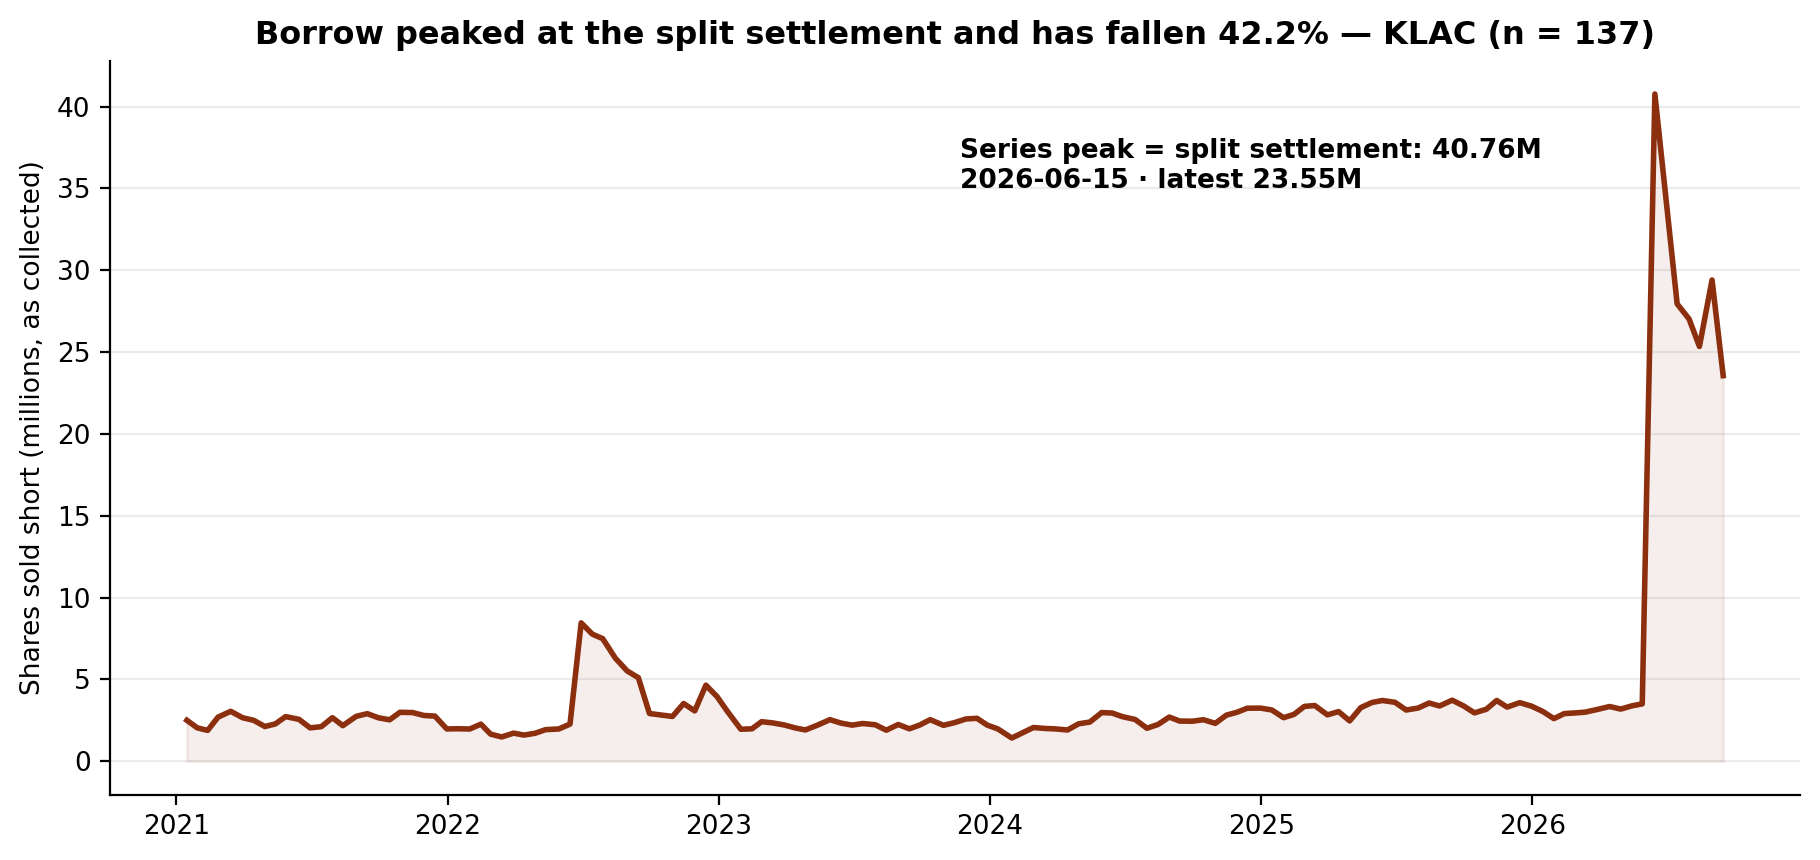
Lens 6 — short interest: the peak is the split settlement itself, and the borrow has since fallen 42.2%. The latest FINRA settlement, September 15, 2026, records 23,554,039 shares sold short — 1.80% of the 1,306,546,783 shares outstanding — at 2.50 days to cover, down 19.89% from the prior settlement. The series peak is 40,762,347 shares on June 15, 2026 — the first settlement after the split, and the row FINRA itself flags with its split marker — across all 137 settlements in the series, which begins January 15, 2021; the latest reading sits 42.2% below it. Against June 30, 2026 (34,375,617) the latest is down 31.5%, and against a split-adjusted year-ago reading (37,278,430, restated from 3,727,843 pre-split shares on September 15, 2025) down 36.8%; the +531.8% the raw counts print for that year is the split, and this audit does not cite it. The recent path, all of it post-split, runs 34,375,617 (June 30), 27,939,763 (July 15), 27,024,003 (July 31), 25,337,831 (August 14), 29,401,138 (August 31) and 23,554,039 (September 15) — four falls and one rise across the six settlements. The series is published as collected, including one older step this audit cannot explain (methodology).
The Gap
The narrative arriving this week is a momentum story: a most-viewed listing on a stock that doubled in a quarter. The June tape backs the breadth and contradicts the labels. The full market did add — 445 more filers, and 17.84% more shares even after the split is stripped out — in a quarter when the price rose 104.9%. But the tracked cohort's own register, split-adjusted, shrank 0.9%: of the six continuing holders, only PineStone genuinely added (+102.7% split-adjusted), one stood exactly still, and four cut, Jensen by half. Every one of the six is labelled INCREASED in the filings, because the labels divide post-split shares by pre-split shares. Inside the company, the record holds no purchase ever against 38 sales, $72,763,766.75 of them in the last 90 days. The 5% register holds two passive prints, its maximum a 7.49% Vanguard entity print from before the split. And the borrow has been unwinding since the split settlement itself: down 42.2% from that print and 36.8% below its split-adjusted year-ago level. One plausible reading is that the quarter's doubling was met by the broad market and by one tracked holder, while the rest of the tracked register, the insiders and the shorts all leaned the other way — and that anyone reading the change labels without the split would see the opposite of what the continuing holders did.
What Would Change the Picture
Nothing above is a recommendation. These filings would change it:
- 1. The 2026Q3 13F season (filing window closing mid-November 2026). All six continuing June holders verify, and their split-adjusted baseline is +1.3% between them. Whether PineStone's doubled 2,169,700-share stake — 45.4% of the tracked total — is held or added to, and whether Jensen's halved position rebuilds, decides whether this lens stays a one-holder story.
- 2. A first insider purchase in the record. The record holds 0 purchases in 100 filings — and 38 sales, the last 15 of them in 90 days totalling $72,763,766.75. A first recorded purchase, at any size, would change this lens.
- 3. A second Congress row, or a Senate row. One House member accounts for the entire Congress lens, with one purchase and one sale. A transaction from any other member — or a first Senate row — would change this lens.
- 4. A first SC 13D filing, or a new 5% print above 7.49%. Both filings in this register are 13G-family filings. A first activist-form filing, or any print above Vanguard Capital Management's 7.49% maximum, would change this lens.
- 5. Short interest to a new post-split high, or below the June trough path. The borrow stands at 23,554,039 shares, 42.2% below the split settlement's 40,762,347 print, at 1.80% of the share count. A reading above 40,762,347 would set a new post-split record; a continued fall would extend a five-month unwind.
Related reading: Eight of 147: Chris Hohn - TCI's New Position Is 36.9% of the Tracked Vulcan Materials Stake, and the Verified Cohort Grew 5.7% in a Quarter When the Price Rose 8.3% — Filing Tape #129; Twelve of 147: Oakmark Holds 55.6% of the Tracked Equifax Stake, and the Verified Cohort Fell 4.2% in a Quarter When the Price Fell 11.9% — Filing Tape #128. KLA's own page: KLA (KLAC) on GetCoattail.
Methodology and data notes
- As-of & limits: The lenses rest on different clocks, none live: 13F is a June 30, 2026 snapshot published up to 45 days later; Form 4 runs through October 2, 2026; Congress aggregates run through October 3, 2026 (Senate through October 1, 2026); 13D/G through April 30, 2026; short interest through September 15, 2026; the price file ends October 2, 2026. Seven limits are specific to this audit. First, the roster expanded before the recent audits — from 85 managers (83 filing) to 149 (147 filing) — so "of 147" counts are not comparable to earlier pieces' "of 83" figures. Second, this name carries no period split: all seven tracked holders sit on a June 30, 2026 period-end and none of the three September 30, 2026 early filers holds this name, so every tracked figure here is a single-date figure. Third, a 10-for-1 stock split sits between the two 13F quarters compared here, and it contaminates every share-count comparison that crosses it: the filings' own change labels, the register change (+891.0% as filed), the full-market share change (+1,078.37% as filed) and the raw short-interest year comparison (+531.8%). The split is established from inside our own files — one holder's label is exactly +900.0% on an unchanged position, FINRA flags the June 15, 2026 settlement row with its split marker, and the first-quarter cohort's implied price of $1,470.8 per pre-split share restates to $147.08 — 0.11% below the split-adjusted March 31 close of $147.241 on our (fully split-adjusted) price file. Every cross-quarter share comparison in this audit is therefore stated split-adjusted (first-quarter counts × 10), with the as-filed figure given alongside wherever the raw print is itself the story; dollar values, percentages of a single date, and filer counts are unaffected and are cited as filed. Fourth, Form 4 windows that span the split (one year, full record) mix pre- and post-split share scales in their share totals, so for those windows this audit cites transaction counts and dollar totals only; the 90-day window is entirely post-split and its shares and implied price are cited. Fifth, the site's insider aggregate disagrees with the full parse on the 90-day window for this name — 13 sales and $65,351,812.82 on the site against 15 sales and $72,763,766.75 in the full parse, with the same zero purchases and the same 6 sellers — so the full parse is the basis here and the disagreement is stated rather than smoothed over. Sixth, the short-interest series contains one step this audit cannot explain: a 3.728x rise at the June 30, 2022 settlement (2,266,919 to 8,451,185 shares) with no split or revision flag; the series is published as collected, and no conclusion in this audit rests on that segment. Seventh, our price file begins June 1, 2021, so every price statement in this audit is mechanical, a date and a close from that file. The MarketCrunch AI most-viewed listing (dated October 19, 2026) postdates the 13F snapshot and the short-interest series; it is known to this audit only from outside coverage, not from our own files, and none of its figures are cited here beyond the listing itself, reported as screen content in The Hype; every price figure here is from our own price file.
- Market context sources: the MarketCrunch AI "Today's Most-Viewed Stocks & ETFs" list (accessed October 19, 2026), on which KLA Corp appeared in the top ten for October 19, 2026, behind GOOG, PATH, STI, TOVX, DJT and DKL in that table's order, with NBIS and AAPL also in the table. Figures we could not confirm were left out; the external items above are reported speech from that outlet, not GetCoattail measurements.
- KLA is in the GetCoattail stock-page universe: KLA (KLAC) stock page. Series data: klac_lens_data.csv · klac_short_interest_series.csv. Earlier audits: Vulcan Materials · Equifax.
Past patterns are not a promise of future results. For education only — not investment advice.
This article describes public filings as of the dates stated. It is not investment advice and makes no recommendation. Filings lag reality: 13F positions are as of June 30, 2026, and later trading is not yet public.
Revision history: v1.0 — October 19, 2026: first publication.