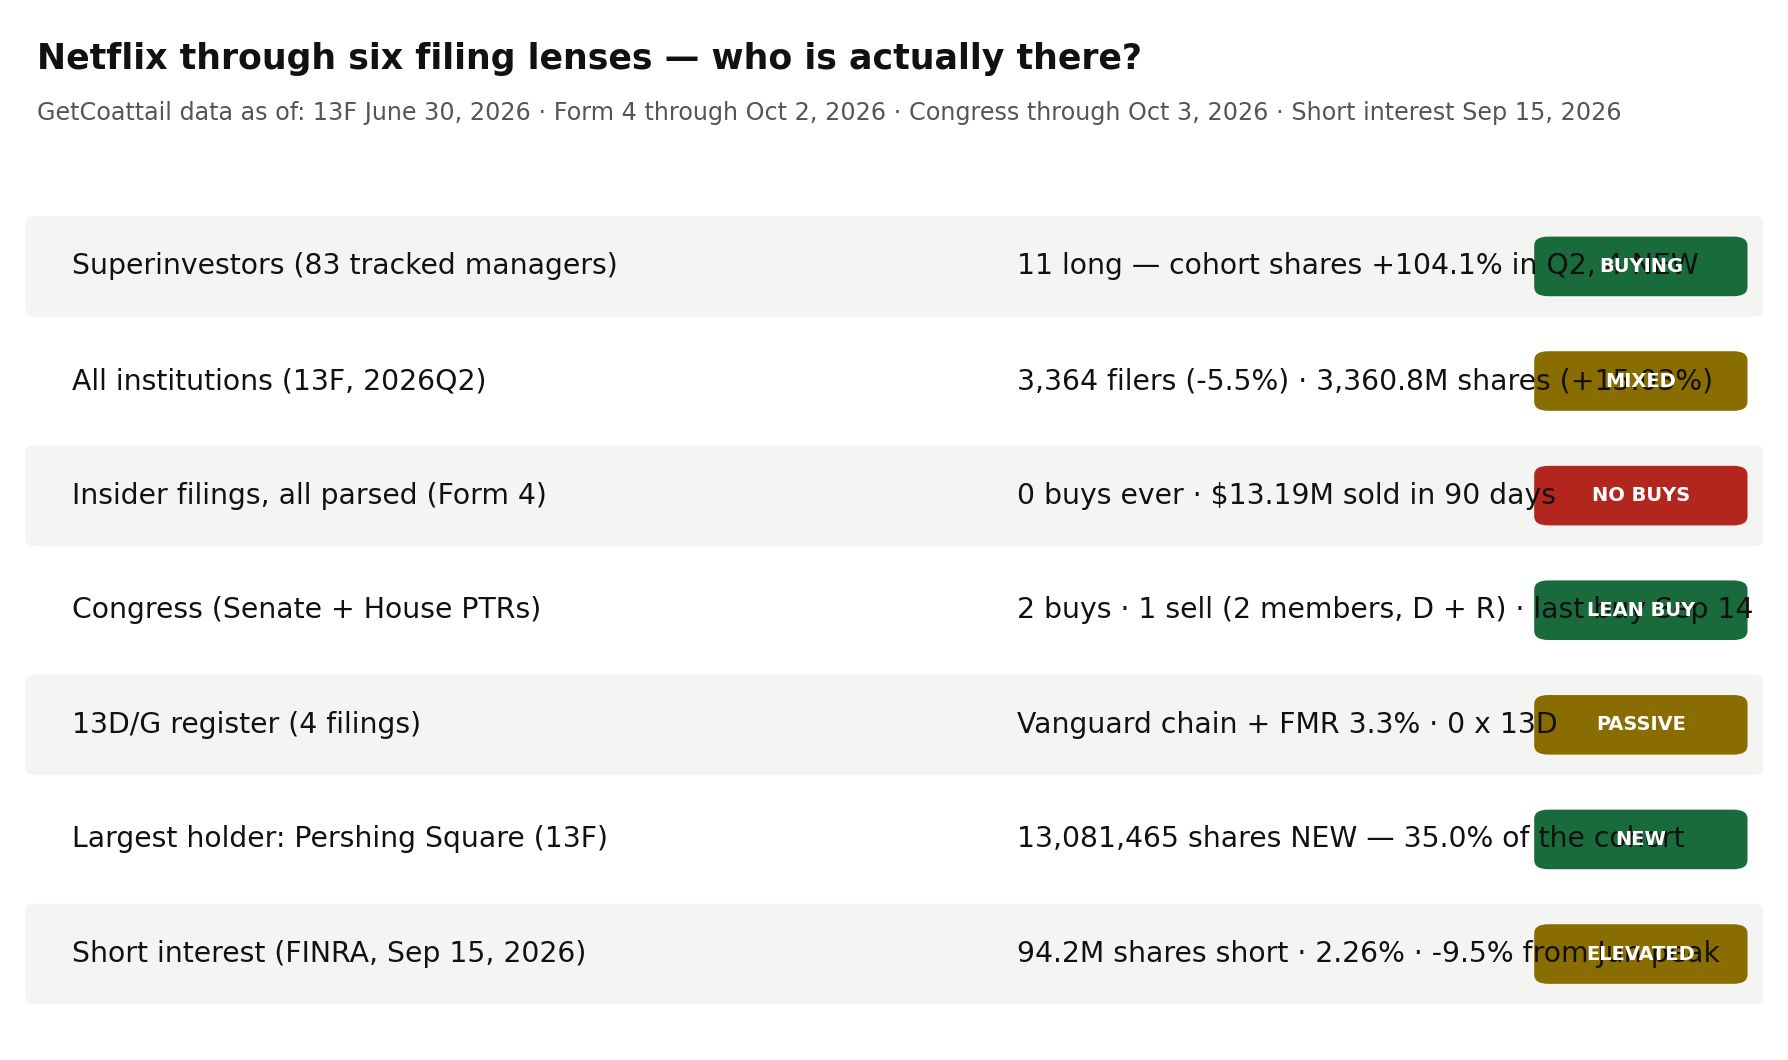
GetCoattail Research — Netflix has fallen about 19% in 30 days and sits near its 52-week low ahead of third-quarter results on October 20, with analysts debating slowing growth and softer engagement. We ran it through every filing lens we maintain. In the second quarter — while the price fell 25.7% — the tracked superinvestors more than doubled their share count, and four of them were buying for the first time.
Start with the narrative, because at the moment it is mostly a falling price. Netflix reported second-quarter 2026 revenue of $12.56 billion, up 13.4% year over year, with diluted earnings per share of $0.80 against a $0.79 consensus estimate, operating income of $4.2 billion and an operating margin of 33.4%. Growth is decelerating: third-quarter guidance is $12.86 billion, up 12%, and full-year revenue guidance stands at $51.0 billion to $51.4 billion. The stock has fallen roughly 19% over 30 days and about 28% this year in quote-provider figures, trading just above its 52-week low of $65.08 against a high of $124.86. Analysts are split in public: MarketBeat's October 2 compilation put the consensus average target at $95.27 across 55 analysts, Deutsche Bank upgraded the stock to Buy on September 29 while cutting its target to $95, and at least one firm sits at $57 with an Underweight rating. Third-quarter results arrive October 20.
Now the filings. GetCoattail tracks the investors best placed to know any company: superinvestors, institutions, insiders, Congress, and 5% holders. For Netflix — the fourteenth Filing Tape audit, after IREN, CoreWeave, Micron, NVIDIA, Tesla, AMD, Apple, Amazon, Meta, Oracle, Dell, Bloom Energy and Palantir — the lenses point in opposite directions, and the disagreement itself is the finding.
Lens 1: the superinvestors — eleven holders, and the cohort doubled
We track 83 large, mostly long-only managers whose 13F portfolios we collect directly from SEC EDGAR. As of June 30, 2026, eleven held Netflix in long common-stock positions — every reported row is a long position, with no option rows in the count. Their combined position is 37,355,486 shares worth $2,667,181,715. On a like-for-like pipeline basis the cohort more than doubled in the second quarter, rising from 18,299,675 shares across eight holders at March 31 to 37,355,486 shares across eleven at June 30 — up 104.1% — in a quarter when the share price fell from $96.15 to $71.40 in our price file, down 25.7%. The pipeline and EDGAR-collection second-quarter totals agree exactly, at 37,355,486 shares.
The direction counts are the story. Of the eleven holders, four were new, two increased, three were unchanged and two decreased. The new positions alone — 20,259,010 shares — are 54.2% of the entire cohort. The largest holder is new: Pershing Square's Bill Ackman reported 13,081,465 shares worth $934,016,601, a 4.8% portfolio weight, as a new position — 35.0% of the cohort by itself. Terry Smith's Fundsmith also opened new, with 6,990,345 shares worth $499,110,633 at a 3.66% weight. Among continuing holders, Bill Nygren's Oakmark increased 11.7% to 11,014,943 shares, and Thomas Russo's Gardner Russo & Quinn increased 1.8% to 5,710,088 shares. The two decreases were small: Greenlea Lane cut 1.3% and Polen Capital cut 18.2% from a 68,139-share base. The top two holders — Ackman and Oakmark — together are 64.5% of the cohort.
Lens 2: institutions — fewer filers, 15.03% more shares
Zoom out to the whole 13F market and the register moved the same way, in quieter proportions. At June 30, 2026, 3,364 institutions reported positions in Netflix, down from 3,558 at March 31 — a 5.5% fall — and 3,347 of them reported long positions. Yet reported share counts rose 15.03%, from 2,921,675,420 to 3,360,815,529 shares, with 1,925 filers entering and 2,119 exiting. The dataset's reported aggregate value fell 14.6% to $254,383,826,487, because the price fell faster than the share count rose; the aggregate includes option rows, so we treat filer and share counts as the reliable series and the dollar figure as reported (see methodology). Fewer names on the register, holding more shares in aggregate, into a falling price.
Lens 3: the 5% register — four filings, all passive, one reporting name changes
Four SC 13D/G filings cover Netflix — zero 13D filings and four 13G filings, from four reporting names, the most recent filed August 6, 2026. The largest current row belongs to Vanguard Capital Management, which filed a new 13G reporting 316,347,733 shares (7.49%) as of March 31, 2026. Alongside it, The Vanguard Group reported 0 shares (0.0%) as of March 13, 2026 — the same sequence of reporting names from the same index complex that appeared in our Palantir audit; we report the two rows as filed, without summing them or calling the zero an exit. The other chain is FMR LLC and Abigail P. Johnson, reporting the same position jointly: 5.1% as of December 29, 2023, and 3.3% as of June 30, 2026 (137,555,034.94 shares, filed August 6, 2026). A 10-for-1 stock split in late November 2025 sits between those FMR dates, so the percentages are the comparable series and the share counts are not. No 13D — the filing an investor uses when it wants something from management — has appeared at all.
Lens 4: insiders — zero purchases in the entire parsed record
The insider lens is the mirror image of Lens 1. Across the entire parsed Form 4 record for Netflix (389 filings through October 2, 2026), there is not one open-market purchase transaction — zero, in the 90-day window, the one-year window and the full record. Officer purchases are likewise zero in every window. The selling side is continuous. In the 90 days through October 2, 2026, insiders filed 40 reports covering 10 sale transactions totalling 179,765 shares and $13,187,186.55, by five sellers. Over the full year, sales total 125 transactions and $402,462,432.65 by eight sellers. Across the entire parsed record, sales total 729 transactions and $1,417,115,906.40 by 14 sellers, against zero purchases. Our site's insider aggregate, compiled as of October 9, 2026, matches the full-parse 90-day figures exactly — the same zero purchases, the same ten sales, the same $13,187,186.55. Some selling is mechanical — vesting, tax withholding and pre-arranged plans generate filings regardless of anyone's view — and we assign no motives. What the record establishes is narrower: in the same quarters when outside concentrated buyers were doubling their positions, no Netflix insider bought a share at market price.
Lens 5: Congress — two buys, one sell, and a purchase dated September 14
Across the Senate and House transaction record we maintain (as of October 3, 2026), Netflix shows two purchase transactions and one sale transaction, by two members, one from each party. The House aggregate carries both members and both purchases, with the most recent purchase dated September 14, 2026 — after the June 30 price fall and weeks before the October 20 results. The Senate aggregate records the single sale and no purchases. Congressional disclosures report value ranges rather than exact amounts, so we record direction only. The lens is small — three transactions — but it leans the same way as the superinvestor cohort's, and its most recent entry is the freshest dated signal in this audit.
Lens 6: short interest — 2.26% of the share count, 9.5% below its June peak
As of September 15, 2026 — the most recent FINRA settlement date — 94,187,131 Netflix shares were sold short, with days-to-cover of 3.60. That is 2.26% of the 4,163,939,676 shares outstanding in our fundamentals file (a share count as of June 30, 2026).
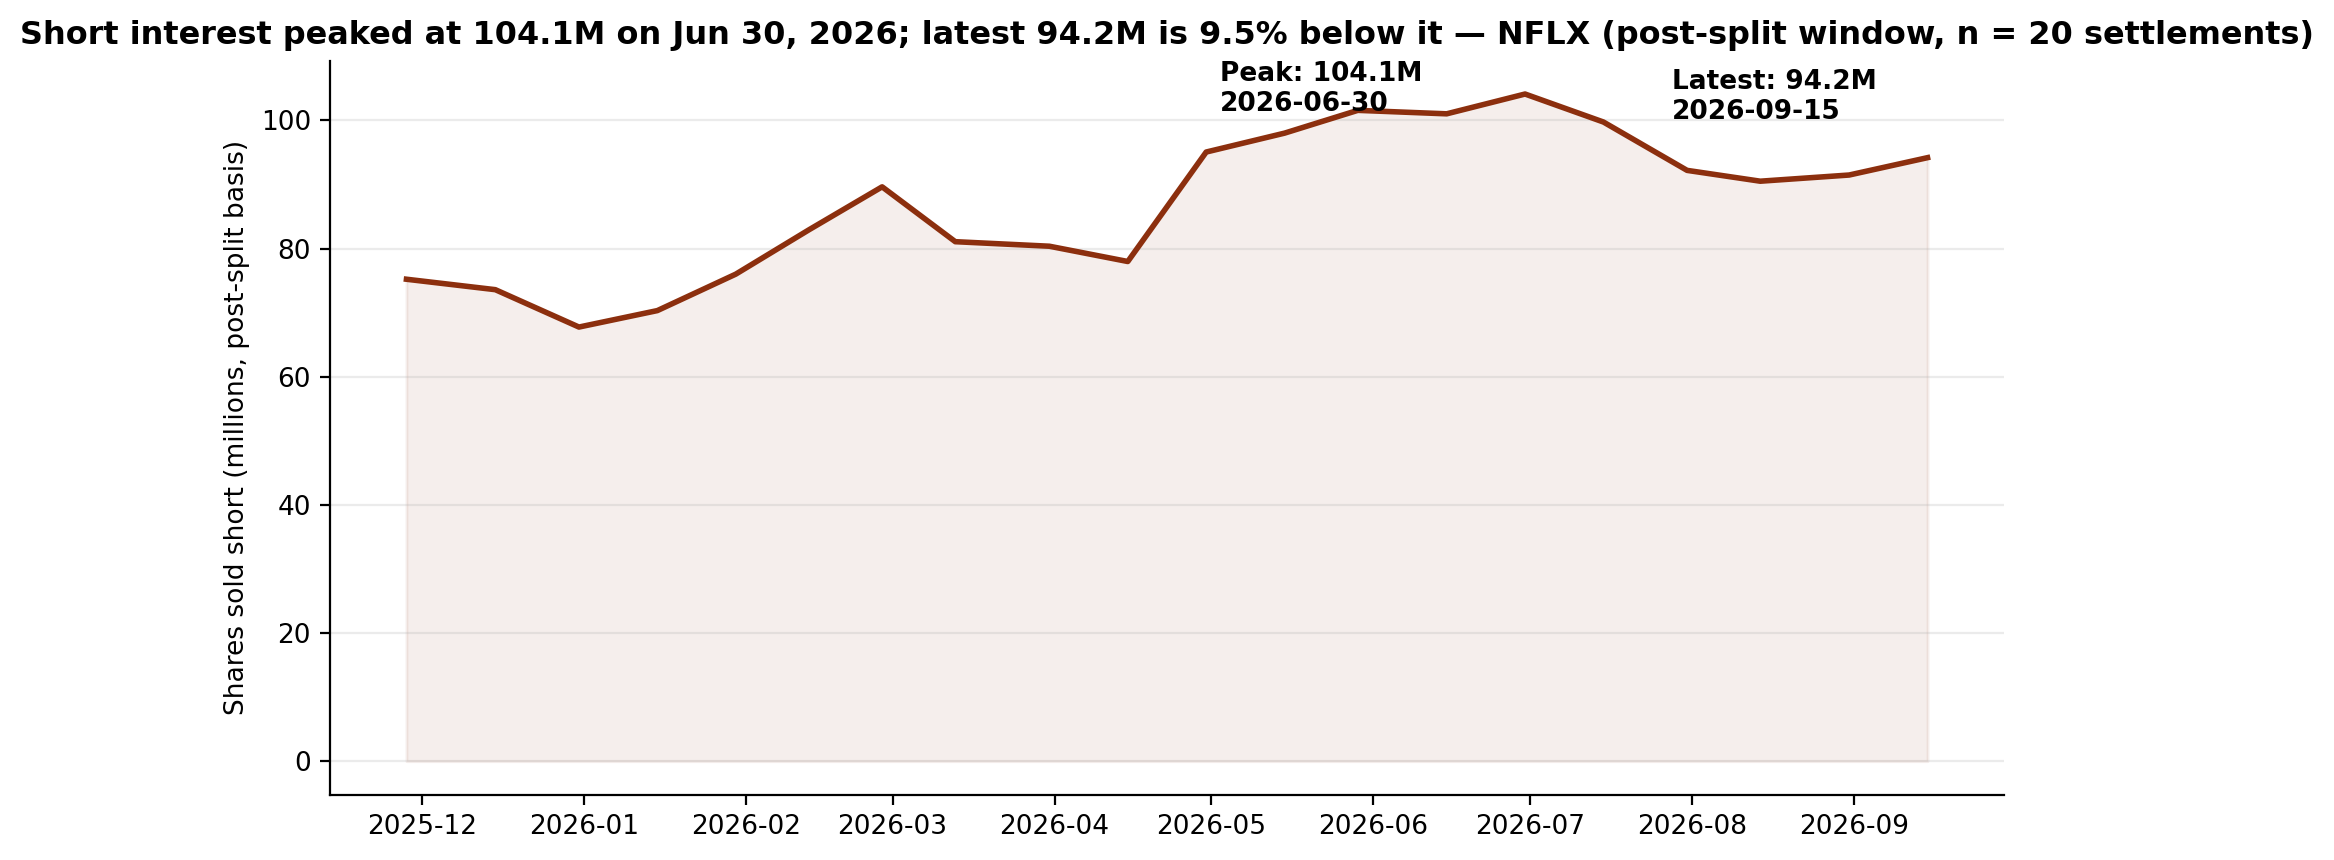
Within the comparable post-split window, the borrow built from 75,214,504 shares at November 28, 2025 to the peak of 104,117,446 shares on June 30, 2026, then eased: the last five settlements run 99,746,573, 92,202,002, 90,512,500, 91,476,621 and 94,187,131. The latest reading is 9.5% below the peak but 25.2% above where the post-split series began — a large borrow that stopped growing over the summer without unwinding.
The gap, stated plainly
Netflix's filing record is split between the registers that buy from outside and the register that never buys from inside. The concentrated outside money moved in during the second quarter: eleven tracked superinvestors holding 37,355,486 shares, up 104.1% in a quarter when the price fell 25.7%, with four new positions supplying 54.2% of the cohort and the single largest holder a new $934,016,601 position. The broad register did the same in miniature — filers down 5.5%, shares up 15.03%. Congress leans the same way, two purchases to one sale, the latest dated September 14, 2026. Against that, insiders recorded zero purchases across the entire parsed record — not in 90 days, not in a year, not ever in the data — against $1,417,115,906.40 of sales. The 5% register is passive only: four 13G filings, no 13D, its largest row an index complex reporting under a new name. Short interest, at 2.26% of the share count, sits 9.5% below its June 30 peak. One plausible reading is that the second-quarter fall was met by outside concentrated buyers while the inside register stayed exactly where it has always been in this record — on the sell side only. The record supports each clause separately; it does not say which register is right.
What would change the picture
Nothing above is a recommendation. It is a record. These are the filings that would change the description:
- 1. The 2026Q3 13Fs (filing window closing mid-November 2026). Whether Pershing Square's new 13,081,465 shares and Fundsmith's new 6,990,345 shares survive the third quarter — a quarter in which the price fell a further 6.1% from June 30 to October 2, to a 252-session closing low — is the cleanest test of whether the second-quarter buying was conviction or a trade.
- 2. The first insider purchase in the parsed record. The count stands at zero across 389 filings. A single Form 4 purchase code, at any size, changes this lens from a standing zero to a first; continued silence extends a record that already covers $1,417,115,906.40 of sales.
- 3. Third-quarter results on October 20, 2026. The print tests the narrative the filings are arguing over: guidance of $12.86 billion of revenue, up 12%, against a stock at its 252-session closing low and a consensus target of $95.27 sitting far above the price.
- 4. The congressional record after September 14. Two purchases and one sale is a small sample with a recent date. The next transaction, in either direction, either extends the lean or erases it.
- 5. The short-interest series from its June 30 peak. The borrow peaked at 104,117,446 shares on the same date the superinvestor snapshot was taken and has since eased 9.5%. Whether it rebuilds through the October 20 results or keeps easing is the fastest-updating series in this audit: FINRA publishes it every two weeks.
Until one of those prints, the filing record describes a stock whose tracked superinvestors doubled their shares in a falling quarter — 37,355,486 shares across eleven holders, four of them new — whose insiders have never bought a share in the parsed record, and whose short borrow has stopped growing 9.5% below its peak.
Related reading: Two of 83: Palantir's Superinvestors Hold Just 62,063 Shares. Its Insiders Have Bought Once. — Filing Tape #13; Zero of 83: The Superinvestors Aren't in IREN — Filing Tape #1; 80% Overlap, No Copycat Signal: Congress vs. the Superinvestors. Netflix's own page: Netflix (NFLX) on GetCoattail.
Methodology and data notes
- Superinvestor lens: 83 managers collected directly from SEC EDGAR Form 13F (managers_13f collection), positions as of June 30, 2026; Netflix identified by CUSIP 64110L106. Eleven distinct managers hold long positions totalling 37,355,486 shares; all eleven reported rows are long (no put or call rows). Quarter-to-quarter cohort totals (18,299,675 shares across 8 pipeline rows at March 31; 37,355,486 across 11 pipeline rows at June 30) are from the site pipeline's holdings files on the same CUSIP basis in both quarters; the change is +104.1% ((37,355,486 / 18,299,675) − 1), and the pipeline's second-quarter total agrees exactly with the EDGAR collection's long total (difference: 0 shares). Pershing Square's share of the cohort is 13,081,465 / 37,355,486 = 35.0%; the four new positions total 20,259,010 shares = 54.2%; the top two holders total 64.5%. Direction counts across the eleven long holders: 4 new, 2 increased, 3 unchanged, 2 decreased.
- Full-market lens: SEC Form 13F Data Sets full-market aggregation (the fixtures underlying our 2026Q1–Q2 market tables). Holders = distinct filers reporting the CUSIP; 3,347 of the 3,364 reported long positions. Reported-value caution: the aggregate value ($254,383,826,487 over 3,360,815,529 shares) implies ≈$75.69 per share against a June 30, 2026 close of $71.40 in our price file. The aggregate sums the VALUE of every information-table row — including put and call option rows — while the share count covers long common-stock rows only, so we headline filer and share counts and label dollar values "reported."
- Insider lens: full-parse Form 4 aggregation (agg_by_ticker), record as of October 2, 2026 (389 filings). Sale and purchase counts are transaction-code counts (S and P) in non-derivative rows; grants and exercises are not counted as purchases, and one filing can contain many transaction rows. Purchase transactions are zero in the 90-day, one-year and full-record windows; officer purchases are zero in every window; officer sale transactions are 6 in 90 days, 69 in one year and 370 across the record. The site's insider aggregate (compiled as of October 9, 2026) matches the full-parse 90-day figures exactly (0 purchases; 10 sales; $13,187,186.55; five sellers).
- 13D/G lens: full-parse SC 13D/G aggregation and parsed filings (4 filings matching CUSIP 64110L106, 4 reporting names), filings through August 6, 2026. The Vanguard Group's 0-share row (event date March 13, 2026) and Vanguard Capital Management's 316,347,733-share row (event date March 31, 2026) are reported as separate rows from separate reporting persons and are not summed; the aggregation's totalSharesReported field sums overlapping reporters and successive amendments and is not used. FMR LLC and Abigail P. Johnson report the same position jointly; their percentages (5.1% at December 29, 2023; 3.3% at June 30, 2026) are quoted as reported, and share counts across the November 2025 split are not compared. Percentages are quoted exactly as reported in the respective filings.
- Congress lens: Senate PTR archive and House PTR archive as maintained on this site, combined record as of October 3, 2026. Counts are transaction counts in the aggregated member record; congressional disclosures report value ranges, so no dollar figures are used for this lens. The combined record shows two buys and one sell by two members (one Democrat, one Republican), most recent purchase September 14, 2026. The House aggregate (as of October 3, 2026) shows both members with two buys and zero sells; the Senate aggregate (as of October 1, 2026) shows zero buys and one sell.
- Short interest lens: FINRA Equity Short Interest files (biweekly settlement dates), collected directly from FINRA's public distribution; the Netflix series covers 137 settlements from January 15, 2021 to September 15, 2026. FINRA share counts before the late-November 2025 10-for-1 split are in pre-split shares (14,650,481 at November 14, 2025) and are not comparable with post-split counts (75,214,504 at November 28, 2025); every comparison in this audit is inside the post-split window, and the June 30, 2026 peak of 104,117,446 shares is the peak of that window and of the full series as recorded. FINRA publishes each settlement about two weeks after the fact. The share-count ratio uses the fundamentals file's share count of 4,163,939,676 — a shares-outstanding count as of June 30, 2026.
- Fundamentals note: our fundamentals collection carries Netflix's fiscal-2025 figures — revenue $45,183,036,000, net income $10,981,201,000 and assets $55,596,993,000 — for the fiscal year ended December 2025. The second-quarter 2026 figures in the introduction are from the company's 2026 results as reported by multiple outlets (see market context sources), not from our fundamentals file. The market value of about $286.0 billion uses that file's October 6, 2026 price ($68.69) and reported share count.
- Prices: our own daily-close file for Netflix through October 2, 2026 ($67.06 close, −28.5% year to date on that file; the October 2 close is also the 252-session closing low; 252-session closing high $124.135 on October 21, 2025; closes of $96.15 at March 31, 2026 and $71.40 at June 30, 2026, a second-quarter change of −25.7%; change from June 30 to October 2 of −6.1% ((67.06 / 71.40) − 1)). The drawdown from the 252-session closing high is −46.0% ((67.06 / 124.135) − 1). The file's prices are split-adjusted.
- Market context sources: second-quarter 2026 results (revenue $12.56 billion, up 13.4% year over year; diluted EPS $0.80 against a $0.79 consensus estimate; operating income $4.2 billion; operating margin 33.4%; net income $3.4 billion) and guidance (third-quarter revenue $12.86 billion, up 12%; full-year revenue $51.0–$51.4 billion) — company results as reported by Yahoo Finance, Zacks and MarketBeat coverage, checked October 9, 2026; third-quarter results date of October 20, 2026 (company announcement of September 14, 2026) — as reported by ad-hoc-news and TipRanks, checked October 9, 2026; consensus average price target of $95.27 (October 2, 2026 compilation, 55 analysts, Moderate Buy) and the Deutsche Bank upgrade to Buy with a $95 target on September 29, 2026 and Wells Fargo's $57 Underweight target — MarketBeat via ad-hoc-news, checked October 9, 2026; 30-day price decline of about 19% (from an $82.73 close on September 2) — Tickeron compilation, checked October 9, 2026; 52-week range of $65.08–$124.86 (as of October 2, 2026) — ad-hoc-news / MarketBeat quote data, checked October 9, 2026; social-media attention ranking (Netflix second among meme-stock mentions, 132 in 24 hours, updated October 8, 2026) — AltIndex, checked October 9, 2026. Figures we could not confirm against two sources were left out.
- Netflix is in the GetCoattail stock-page universe: Netflix (NFLX) stock page. Series data: nflx_lens_data.csv · nflx_short_interest_series.csv. Earlier audits: Palantir · Bloom Energy · IREN.
This article describes public filings as of the dates stated. It is not investment advice and makes no recommendation. Filings lag reality: 13F positions are as of June 30, 2026, and later trading is not yet public.
Revision history
- v1.0 — October 9, 2026: first publication.