GetCoattail Research — The Filing Tape #163. Tyson Foods has been one of the most searched-for stocks on Zacks.com lately, where it carries a Rank #5 (Strong Sell). The filings show 5 tracked holders of 147, a full market holding 21.42% more shares on nine fewer filers, and an insider record whose only purchase is a $1,001,616.65 buy by the president and CEO elect.
The Hype
The attention is search traffic with a bearish label attached. Zacks reports that Tyson Foods "has been one of the most searched-for stocks on Zacks.com lately," with shares up 8.8% over the past month against no change in the Zacks S&P 500 composite, while its Food - Meat Products industry gained 0.5%. Zacks, October 22, 2026 The same note shows why the searches may be argument rather than enthusiasm: the current-quarter consensus is $0.65 a share, down 43.5% year over year and revised down 5.9% in 30 days; the full-year estimate is $3.49, down 15.3% and revised down 4.3%; and Zacks assigns Rank #5 (Strong Sell) even as its Value Style Score is graded B. The last reported quarter printed revenue of $13.87 billion, down 0.1%, and EPS of $0.99 against $0.91 a year earlier — both below consensus. Our own price file, which ends October 2, shows the longer slide behind the search spike: the stock fell 10.6% in Q2 ($64.07 on March 31 to $57.25 on June 30), and a further 9.4% to $51.89 at October 2 — 24.5% below the 252-day high close of $68.75 (May 4, 2026) and 2.8% above the low close of $50.47 (October 1).
The Tape
For Tyson Foods, the one hundred and sixty-third Filing Tape audit, the tape shows 5 tracked managers whose verified continuing positions eased 1.4%, a full market that added 45,452,167 shares while nine filers left, an insider record with exactly one purchase and two sales, no congressional row in either chamber, a 5% register whose largest print cannot describe the float it names, and a borrow of 2.66% on a fallback share count.
| Lens | As of | What the filings show | Direction vs prior period |
|---|---|---|---|
| Superinvestors (13F) | Jun 30, 2026 | 5 holders of 147 tracked managers hold 33,191,118 shares; 1 NEW label | Verified continuing holders −1.4% (33,650,772 → 33,162,838 shares); register total −1.1% |
| All institutions (13F) | Jun 30, 2026 | 873 filers; 257,674,053 shares; reported value $14,551,360,522 | Filers −9; shares +21.42%; reported value +9.91% |
| Insiders (Form 4) | Oct 2, 2026 | Last 90 days (by filing date): 1 purchase, 0 sales; parsed record: 1 purchase, 2 sales | The parsed record's only purchase is the recent one: $1,001,616.65, transacted Sep 4, 2026 |
| Congress | Oct 3, 2026 | No row in the combined, House or Senate aggregates | No member-file row in either chamber |
| 13D/G | May 12, 2026 | 8 parsed filings (7 SC 13G family, 1 SC 13D/A); register maximum 99.99% as printed | Latest filing, May 12, 2026, prints State Street at 5.1% as of Mar 31, 2026 |
| Short interest (FINRA) | Sep 15, 2026 | 9,494,023 shares; 2.28 days to cover; 2.66% of the share count (fallback denominator) | Down 0.1% from a year ago; down 19.3% from the May 15, 2026 series maximum |
Lens 1 — the superinvestors: five holders, two of them 89.4% of the stake. The collection holds 147 managers (144 at June 30; 3 early filers at September 30). The June 30, 2026 register is 5 distinct managers holding 33,191,118 shares worth $1,900,249,563, long only, with no option rows. The largest is Richard Pzena - Pzena Investment Management, 17,016,651 shares, 51.3% of the cohort, at a 2.86% weight, labelled DECREASED at −0.8%. Behind it sit Christopher Davis - Davis Advisors (12,653,717 shares, 38.1%, DECREASED −3.3%), Yacktman Asset Management (2,578,970 shares, INCREASED +2.5%), Thomas Gayner - Markel Group (913,500 shares, INCREASED +2.7%) and Lee Ainslie - Maverick Capital (28,280 shares, labelled NEW) — two decreases, two increases, one new position of 0.1% of the cohort. Every continuing label verifies under both pairing methods: the four held 33,650,772 shares at March 31 and 33,162,838 at June 30, a verified change of −1.4% (−487,934 shares), in a quarter when the price fell 10.6%. The NEW label also audits clean: Maverick's March entry holds no Tyson row. One tracked name exited: Tweedy Browne, 26,123 shares in March. One September early filer holds the name: David Katz - Matrix Asset Advisors, 582,286 shares, labelled INCREASED at +17.6% against its own June register row of 495,030 shares. The June cohort's implied price is $57.25, exactly the $57.25 close, for the cohort and for each holder individually. At 12.88% of reported institutional shares the cohort is an unusually large sample of this register. 13F figures are as of June 30, 2026, published up to 45 days later.
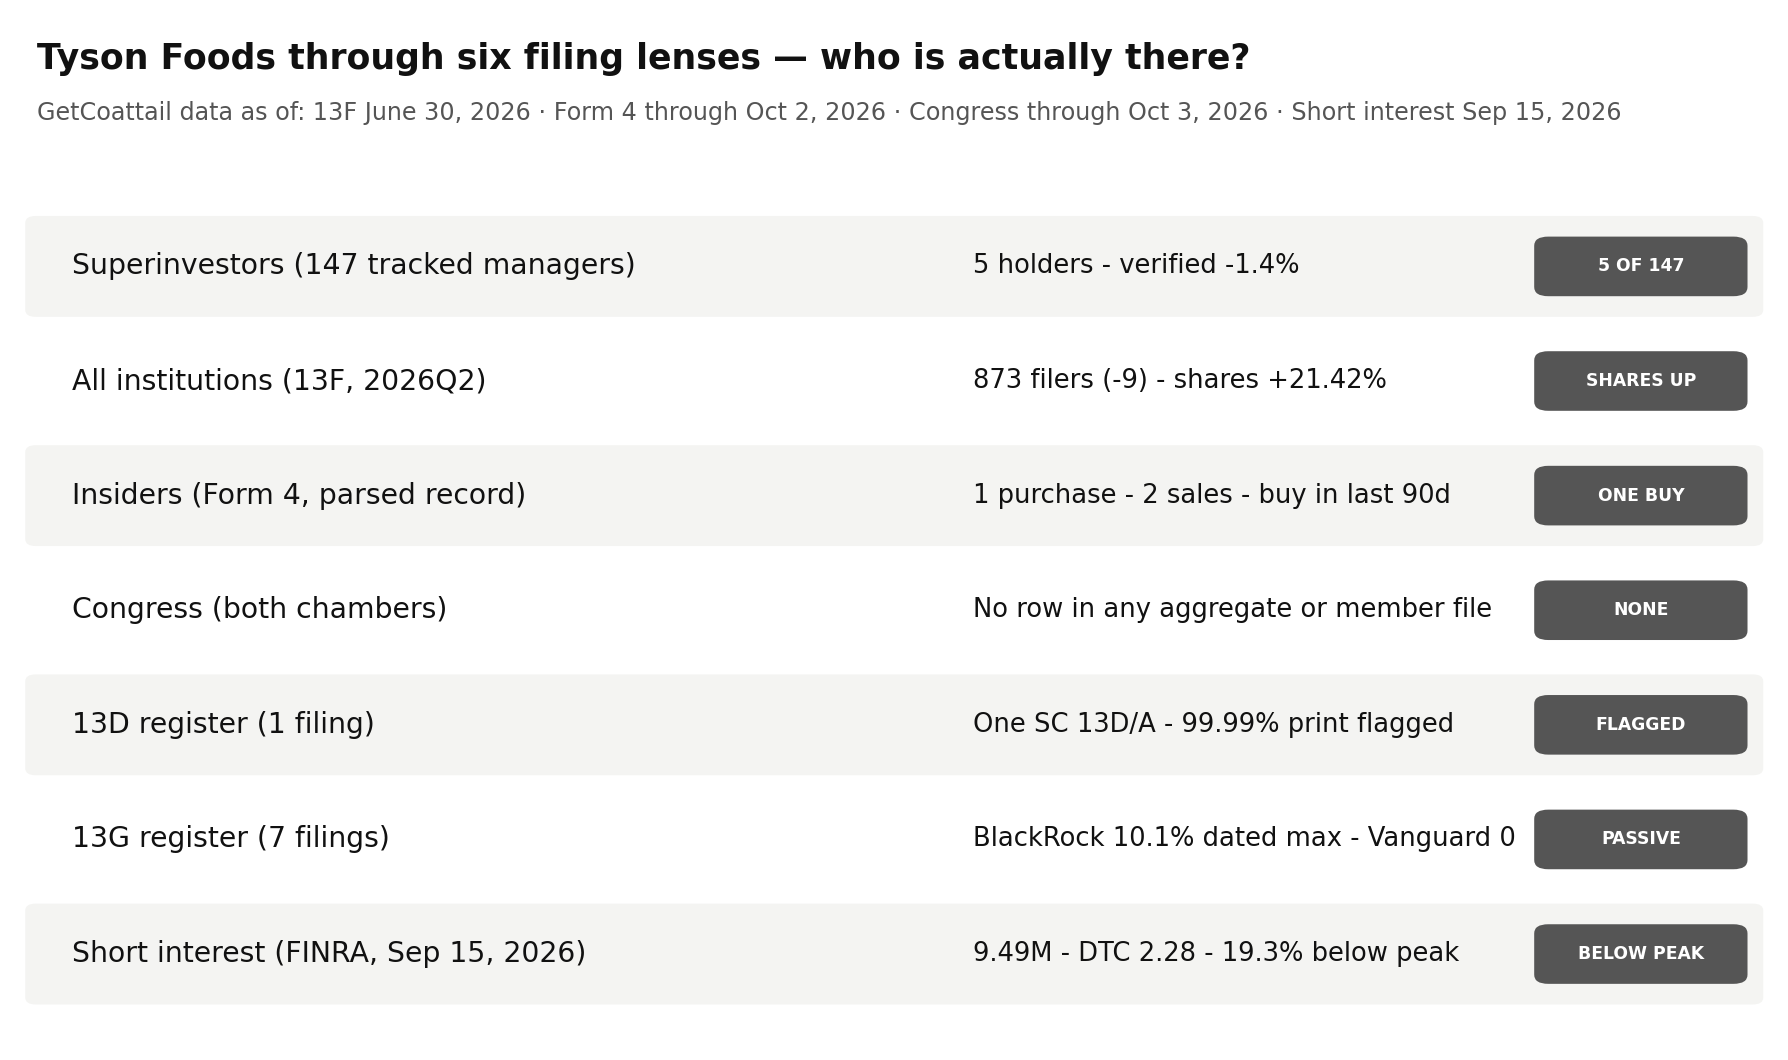
Lens 2 — institutions: fewer filers, 45.5 million more shares. At June 30, 2026, 873 institutions reported positions on the name's single CUSIP, down 9 from 882 at March 31 (−1.02%); 871 are long. Reported shares rose 21.42% to 257,674,053 (+45,452,167 shares), while reported value rose 9.91% to $14,551,360,522, labelled "reported" because the aggregate includes option rows (methodology). The aggregate implies $56.47 against the $57.25 close (−1.36%) — a small gap for this lens, reported rather than smoothed over. The share count is the cleaner measure: a fifth more stock reported by a slightly smaller crowd, in the same quarter the tracked cohort eased 1.4% and the price fell 10.6%.
Lens 3 — insiders: one purchase on the whole record, and it is recent. The parsed Form 4 record holds 55 filings (February 11, 2025 – September 8, 2026), inside windows running through October 2, 2026. The last 90 days (a filing-date window, per the aggregate's own definition) hold 5 filings, one open-market purchase and no sale-coded rows. The purchase is 19,450 shares for $1,001,616.65, an officer row: the buyer is Jeffrey K Schomburger, whose Form 4 title reads "President & CEO Elect," transacted September 4, 2026 at $51.497 a share and filed September 8, 2026. The last year holds the same single purchase against 2 sale-coded rows across 106,840 shares worth $6,196,447.61, both officer rows: Curt Calaway, the chief financial officer, sold 6,539 shares on November 25, 2025, and John H Tyson, the chairman, sold 100,301 shares on November 28, 2025. The full parsed record holds exactly those three open-market rows — 1 purchase, 2 sales — across 55 filings; 17 filings dated before October 3, 2025 hold no purchase or sale rows. Within this record, which begins in February 2025, the purchase column has one entry, four weeks old at the window's end.
Lens 4 — Congress: no row. The combined aggregate (as of October 3, 2026) carries no row for this ticker, and neither do the House aggregate, the Senate aggregate, the House member file or the Senate member file. There is nothing to split by party, chamber or direction: as collected, this lens is blank, reported as blank rather than estimated.
Lens 5 — the 5% register: a 99.99% print that cannot describe its float. Our full parse holds 8 SC 13D/G filings: 7 in the SC 13G family (5 SC 13G and 2 SC 13G/A amendments) and 1 SC 13D/A, carrying 8 reporter rows. The register maximum as printed is TYSON LIMITED PARTNERSHIP, 72,743,680 shares and 99.99%, in an SC 13D/A filed February 13, 2026 — but 72,743,680 shares are 28.2% of the 257,674,053 shares the full 13F market reports for the same CUSIP, so the percentage and the share count cannot both describe that float; this audit uses the share count and reports the percentage as the filing's own print (methodology). The passive prints are dated: BlackRock, Inc. prints 28,859,577 shares and 10.1% as of December 31, 2024, then 25,033,123 shares and 8.7% as of March 31, 2025. PZENA INVESTMENT MANAGEMENT LLC prints 15,458,901 shares and 5.5% as of December 31, 2025. The Vanguard Group prints 0 shares and 0.0% as of March 13, 2026, while two Vanguard entities print again at March 31, 2026 (Vanguard Capital Management, 21,194,882 shares and 7.51%; Vanguard Portfolio Management, 15,488,649 shares and 5.49%). The latest filing, May 12, 2026, prints State Street Corporation at 14,328,070 shares and 5.1% as of March 31, 2026.
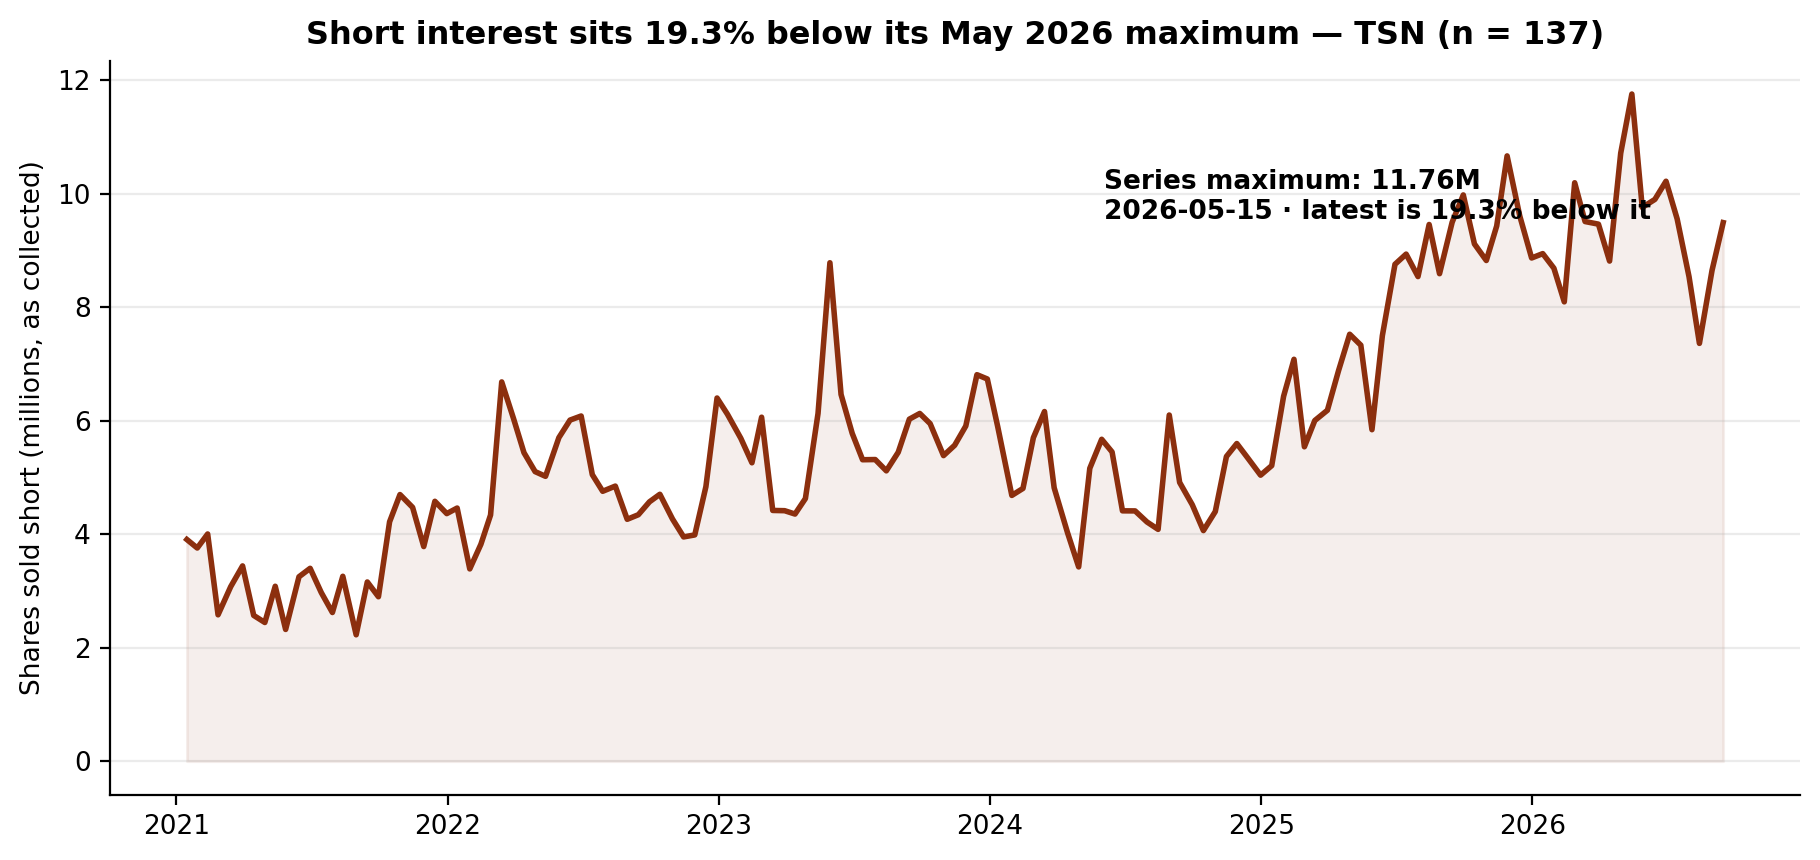
Lens 6 — short interest: 2.66% of the fallback share count, off its May peak. The latest FINRA settlement, September 15, 2026, records 9,494,023 shares sold short at 2.28 days to cover, 2.66% of the share count in our fundamentals file (a weighted-average fallback count, methodology). The borrow rose 9.72% from the prior settlement, sits 7.1% below the June 30, 2026 settlement (10,223,518 shares) and 0.1% below the year-ago settlement (9,500,404 shares). The series maximum is 11,760,759 shares at May 15, 2026, and the latest reading sits 19.3% below it; the minimum is 2,228,171 shares at August 31, 2021. The summer's path: 10,223,518 (June 30), 9,559,805 (July 15), 8,541,229 (July 31), 7,364,939 (August 14), 8,652,777 (August 31), 9,494,023 (September 15) — two settlements down, then two rebuilding.
The Gap
The search story is a Strong Sell label on a rising tape: Rank #5, consensus estimates cut 4–6% in a month, and a stock up 8.8% over the same month. The filings underneath do not line up behind either side. In June, the tracked cohort — an unusually large 12.88% sample of this register — essentially stood still at a verified −1.4% while the price fell 10.6%, and the two holders who are 89.4% of it trimmed 0.8% and 3.3%. The full market moved the other way, reporting 21.42% more shares across nine fewer filers. Congress has not touched the name in any aggregate we hold. The 5% register's loudest print, 99.99%, is a percentage its own share count contradicts. And the one unambiguous insider act in the entire parsed record arrived after the June snapshot: a $1,001,616.65 open-market purchase by the incoming chief executive in September, against two officer sales from November 2025 and nothing else. One plausible reading is that the October search interest is a valuation argument about a downgraded name, while the record shows institutions concentrating, tracked holders waiting, and the single insider purchase standing alone because the rest of the record is so empty.
What Would Change the Picture
Nothing above is a recommendation. These filings would change it:
- 1. The 2026Q3 13F season (filing window closing mid-November 2026). The baseline is 5 June holders with 33,191,118 shares, the continuing holders verified at −1.4%, Pzena at 51.3% of the cohort, Maverick's NEW position at 28,280 shares, and one September early filer, Matrix, at 582,286 shares (+17.6%). Whether Pzena and Davis add after Q2's 10.6% price fall, whether Maverick's position grows, and whether Tweedy Browne re-enters would change this lens.
- 2. A second insider purchase — or any insider sale after September 4, 2026. The parsed record through the October 2 window end holds exactly 1 purchase and 2 sales. A second purchase would make a pattern of the Schomburger buy; a sale would be the first since November 28, 2025.
- 3. A first congressional trade. The combined, House and Senate aggregates and both member files hold no row for this ticker. Any recorded purchase or sale, in any amount band, would populate this blank lens.
- 4. A new SC 13D, or an amendment that restates the Tyson Limited Partnership percentage. The register holds one SC 13D/A whose 99.99% print is inconsistent with its own 72,743,680-share count against the 13F float. An original SC 13D from any reporter, or a corrected partnership print, would change this lens.
- 5. Short interest above 11,760,759 shares, or below 7,364,939. Above the May 15, 2026 reading would set a new series high; below the August 14, 2026 settlement would resume the summer decline.
Methodology and data notes
- As-of & limits: The lenses rest on different clocks, none live: 13F is a June 30, 2026 snapshot published up to 45 days later; Form 4 windows run through October 2, 2026 (the last Tyson filing in the parsed record is itself dated September 8, 2026); Congress aggregates run through October 3, 2026 (Senate through October 1, 2026); 13D/G through May 12, 2026; short interest through September 15, 2026; the price file ends October 2, 2026. Ten limits are specific to this audit. First, the roster expanded before the recent audits — from 85 managers (83 filing) to 149 (147 filing) — so "of 147" counts are not comparable to earlier pieces' "of 83" figures. Second, this name's common stock carries a single CUSIP (902494103), and the full-market by-CUSIP row matches the by-ticker aggregate on every field — holders, long holders, shares, reported value, prior holders and prior reported value — so no CUSIP blending question arises. Third, the tracked register's change labels are verified, not taken on trust: all four continuing holders were verified by two methods that agree exactly — a total-value prefix pass and accession identity plus CUSIP-overlap pairing, each June filing paired to a unique March filing, with every label recomputing exactly and no fallback lookup needed. The single NEW label was audited separately: Maverick Capital's March register entry exists (CUSIP overlap 93) but contains no Tyson row, so the position is genuinely new. The registers then reconcile with no remainder: the March 31 register holds 34,052,063 shares, equal to the verified continuing holders' 33,650,772 plus the 26,123 shares of the single exit, Tweedy Browne, plus the 375,168-share March row of the September early filer, Matrix Asset Advisors; the June 30 register holds 33,686,148 shares, equal to the June cohort's 33,191,118 plus Matrix's own June register row of 495,030 shares, against which its September label of +17.6% also recomputes exactly. Fourth, implied prices are exact on this name: the June cohort implies $57.25 against the June 30 close of $57.25, each of the five holders individually implies $57.25, and the September early filer implies $50.53 against the September 30 close of $50.53. Fifth, the full-market aggregate implies $56.47 against the June 30 close of $57.25 (−1.36%): the aggregate is a reported sum that includes option rows, so its implied price need not equal the close; the gap here is small, and this audit uses filer counts and share counts as this lens's primary measures and reports the value as reported only. Sixth, the insider lens rests on a single aggregate bucket — this issuer's filings sit under one symbol spelling, "TSN", with no case split — cross-checked against a row-level scan of all 55 parsed filings for the issuer (CIK 100493): filing counts, transaction counts, share counts, officer-row counts and values reproduce exactly in every window, with a value difference of $0.00 in all three windows and no accession appearing under more than one symbol spelling. On that record, every insider implied-price check that applies passes: the 90-day implied purchase price of $51.50 sits inside its filing-window close range ($50.47–$61.18), and the one-year and full-record implied sale price of $58.00 sits inside its ranges; the 90-day window holds no sale rows, so no implied-price check applies on that side. The site's insider aggregate (dated October 22, 2026, a 90-day window ending that day) carries a row for this name — 1 purchase, 0 sales, $1,001,616.65, last purchase September 4, 2026, flagged as a CEO buy — which matches the full parse's 90-day filing-date window (ending October 2, 2026) exactly; this audit uses the full parse, whose window is defined in the aggregate file itself, and reports the buyer's Form 4 title as printed, "President & CEO Elect," where the site's flag says CEO. Form 4 windows in this audit are filing-date windows; the purchase was transacted September 4, 2026 and filed September 8, 2026. Seventh, the congressional lens is an absence across five files: the combined aggregate, the House aggregate, the Senate aggregate, the House member file (transactions dated on or after April 1, 2026) and the Senate member file (same window) each carry no row for this ticker. That is an absence in the aggregates as collected, stated with their windows, not a claim about any individual member's complete disclosure history. Eighth, the 5% register's largest print needs its flag in full: the Tyson Limited Partnership SC 13D/A (Amendment No. 13, filed February 13, 2026) names its class as Class A common stock in the parsed filing and prints 72,743,680 shares at 99.99%, but that share count is 28.2% of the 257,674,053 shares the full 13F market reports for the same CUSIP, so the percentage and the count cannot both describe that float. This audit reports the share count as the usable figure and the percentage as printed, and draws no conclusion about which figure the filer intended. The register's cross-date share total of 193,106,882 is likewise an arithmetic sum of 8 reporter rows across different reporters and as-of dates, including one reporter's own 0-share print, and is not a current combined stake; each print is reported individually in the text. Parsed totals match the aggregates exactly. Ninth, the short-interest series holds no step of 2x or more and no step to one-half or less (the largest step is 1.540x, at March 15, 2022; the smallest is 0.644x, at February 26, 2021), so the series carries no discontinuity on this measure across its span. No row carries a split flag; one row carries a FINRA revision flag (June 15, 2021). The issuer-name field reads "Tyson Foods, Inc." at all 137 settlements, on a single market class (NYSE) throughout. The share count behind the short-interest percentage is 357,000,000 shares in our fundamentals file, but unlike a measured period-end count it is a weighted-average fallback (the file's shares_source reads fin_series_weighted_avg_fallback, its shares_end reads "2025", and its note states that no measured count was available), so the 2.66% figure rests on that fallback denominator and is labelled as such wherever it appears. Our price file records no single-day close move across the thresholds this audit normally treats as split patterns, and records no split factor for this name. The company's fundamentals as collected print fiscal 2025 revenue of $54,441,000,000, net income of $474,000,000 and assets of $36,658,000,000; those figures are reported as collected and are not used in any lens above. Every price statement from our own file is mechanical, a date and a close. The Zacks figures in The Hype — the search ranking, the past-month return and the consensus estimates — are that outlet's published figures, cited as such, not blended into file-based calculations.
- Market context sources: Zacks, October 22, 2026 (Tyson Foods one of the most searched-for stocks on Zacks.com lately; past-month return +8.8% against no change in the Zacks S&P 500 composite; Food - Meat Products industry +0.5%; current-quarter consensus EPS $0.65, down 43.5% year over year, revised −5.9% over 30 days; fiscal-year consensus $3.49, down 15.3%, revised −4.3%; next fiscal year $3.73, up 6.7%, revised −4.4%; current-quarter sales consensus $13.88 billion, up 0.1%; fiscal-year sales $56.29 billion, up 3.4%, and next fiscal year $53.82 billion, down 4.4%; Zacks Rank #5 (Strong Sell); Value Style Score B; last reported quarter revenue $13.87 billion, down 0.1%, EPS $0.99 against $0.91 a year earlier, revenue surprise −1.91% and EPS surprise −3.88%, EPS beats in two of the trailing four quarters and a revenue beat in one). Google Trends US daily snapshot via Cyber Kendra, updated October 22, 2026 (top queries are sports and entertainment names; no stock query appears, so the Zacks trending-stock selection above is the fallback basis). Figures we could not confirm were left out; the external items above are reported figures from those outlets, not GetCoattail measurements.
- Tyson Foods is in the GetCoattail stock-page universe: Tyson Foods (TSN) stock page. Series data: tsn_lens_data.csv · tsn_short_interest_series.csv. Earlier audits: First Solar · Leidos.
Past patterns are not a promise of future results. For education only — not investment advice.
This article describes public filings as of the dates stated. It is not investment advice and makes no recommendation. Filings lag reality: 13F positions are as of June 30, 2026, and later trading is not yet public.
Revision history: v1.0 — October 23, 2026: first publication.