GetCoattail Research — The Filing Tape #154. "txn stock" led Google's United States trending searches into October 22, 2026, and Texas Instruments had just beaten third-quarter estimates a day earlier. The June filings show 22 tracked holders who cut their combined stake 46.9% in the second quarter, a full market that added 434 filers, and an insider record with 80 sales and no purchase in it.
The Hype
The attention is an earnings beat at the top of a long run. "txn stock" was the leading Google trending search in the United States in the snapshot published into October 22, 2026. Cyber Kendra Google Trends, United States, updated October 22, 2026 On October 21 the company reported third-quarter earnings of $2.62 a share against a $2.40 consensus estimate, a surprise of +9.17%, on revenue of $6.06 billion, up from $4.74 billion a year earlier and 2.17% above consensus; Zacks noted the shares had added about 60.1% since the beginning of the year, against 12.7% for the S&P 500. Zacks, October 21, 2026The stock closed October 21 at $284.65, up 2.47% on volume of 9,742,932 shares against an average of 7,555,938, and the quarterly dividend had been raised to $1.52 from $1.42, payable November 10 to holders of record October 30. Zolmax, October 21, 2026 Our own price file, which ends October 2, tells the path in: the stock rose 53.5% in the second quarter, from $194.14 on March 31 to $298.07 on June 30, then closed at $293.80 on October 2. The October prices above are figures published after our file ends. The filings answer who held the stock while it rose — and what they did with it.
The Tape
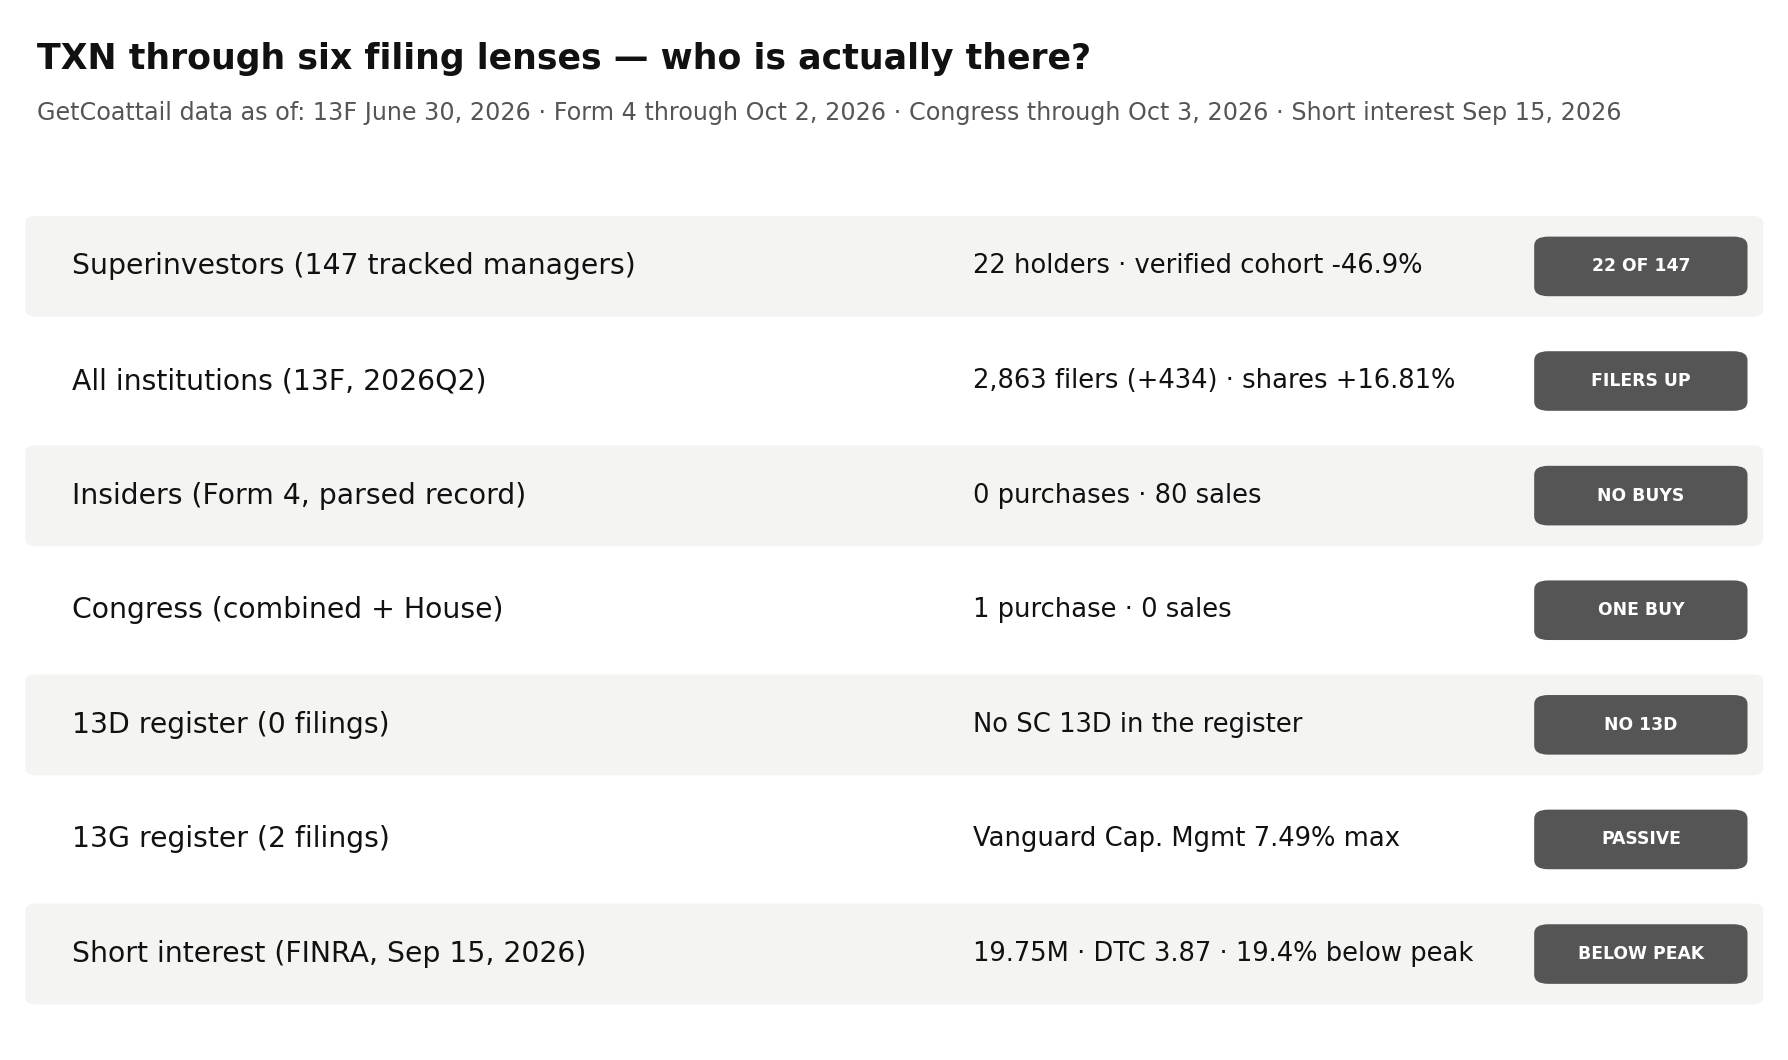
For Texas Instruments, the one hundred and fifty-fourth Filing Tape audit, the tape shows 22 tracked managers whose verified continuing holders cut 46.9% in a single quarter, a full market that added 434 filers and 115.8 million shares, an insider record with no purchase in it, a single small congressional purchase, a 5% register of two passive prints, and a borrow 17.0% above its June settlement.
| Lens | As of | What the filings show | Direction vs prior period |
|---|---|---|---|
| Superinvestors (13F) | Jun 30, 2026 | 22 holders of 147 tracked managers hold 10,621,654 shares; the 20 verified continuing holders fell 46.9% | Register total −46.7% (20,321,238 → 10,832,614 shares, early filers included) |
| All institutions (13F) | Jun 30, 2026 | 2,863 filers; 805,100,351 shares; reported value $236,893,705,472 | Filers +434; shares +16.81%; reported value +82.13% |
| Insiders (Form 4) | Oct 2, 2026 | Last 90 days (by filing date): 0 purchases, 2 sales of $1,852,413.12; parsed record: 0 purchases, 80 sales | No purchase in the parsed record: 0 across 120 filings |
| Congress | Oct 3, 2026 | 1 member, 1 purchase, 0 sales in the combined and House aggregates; no Senate row | The single purchase is dated Apr 14, 2026 ($1,001–$15,000) |
| 13D/G | Apr 30, 2026 | 2 parsed filings, all SC 13G family (0 SC 13D); register maximum 7.49% | Latest filing, Apr 30, 2026, prints Vanguard Capital Management at 7.49% as of Mar 31, 2026 |
| Short interest (FINRA) | Sep 15, 2026 | 19,753,135 shares; 3.87 days to cover; 2.16% of the share count | Up 17.0% from the Jun 30, 2026 settlement; 19.4% below the series maximum |
Lens 1 — the superinvestors: 22 holders, and 18 of them cut. The collection holds 147 managers (144 at June 30; 3 early filers at September 30, two of them holding this name). The June 30, 2026 common-stock register is 22 distinct managers holding 10,621,654 shares worth $3,164,726,078, long only, with no option rows. Christopher Davis – Davis Advisors holds 2,437,486 shares, 22.9% of the cohort, at a 3.12% weight, labelled DECREASED at −14.5%; Terry Smith – Fundsmith holds 1,799,182 shares, 16.9%, labelled DECREASED at −31.4%; the top two together are 39.9% of the cohort. The direction count is the story: 18 holders decreased, one increased, one was unchanged, and two were new. The only increase is Saturna Capital, 257,763 shares at +0.2%; the unchanged holder is Thomas Gayner – Markel Group at 724,000 shares; the two new positions total 4,934 shares. The largest cuts are First Eagle at −98.6%, Slate Path at −81.4% and D1 Capital at −76.9%. Every continuing holder's label verifies by two pairing methods (methodology): the 20 continuing holders held 19,977,178 shares at March 31 and 10,616,720 at June 30, a verified change of −46.9%. Two September 30 early filers also hold the name — Sarasin & Partners, 104,372 shares, and David Katz – Matrix Asset Advisors, 96,778 shares — each labelled DECREASED against its verified June position. The register implies $297.95 against the June 30 close of $298.07 (−0.04%). At 1.32% of reported institutional shares, this cohort is a sample, not the register. 13F figures are as of June 30, 2026, published up to 45 days later.
Lens 2 — institutions: 434 more filers, 115.8 million more shares, and a value figure carried by price. At June 30, 2026, 2,863 institutions reported positions on the name's single common-stock CUSIP, up 434 from 2,429 at March 31 (+17.87%); 2,853 are long. Reported shares rose 16.81% to 805,100,351 (+115,838,878 shares), while reported value rose 82.13% to $236,893,705,472, labelled "reported" because the aggregate includes option rows (methodology). Flow counts agree (2,054 entered, 1,620 exited, net +434), and the single-CUSIP aggregate matches the by-ticker total on every field. The aggregate implies $294.24 against the $298.07 close, a gap of −1.28%. The value figure needs its context: the close rose 53.5% over the same quarter, so much of the 82.13% value increase is the price move passing through; the share count, up 16.81%, is the cleaner measure. The broad market and the tracked cohort moved in opposite directions: institutions added, the benchmarked 22 cut nearly in half.
Lens 3 — insiders: 80 sales, and no purchase in the parsed record. The parsed Form 4 record holds 120 filings, beginning with filings dated January 29, 2025, and running through September 21, 2026 (the collection's window end is October 2, 2026; no filing in the record is dated after September 21). The last 90 days (a filing-date window, per the aggregate's own definition) hold no open-market purchase, against 2 sale-coded rows across 7,000 shares worth $1,852,413.12, by 1 seller, both of them officer rows. The last year holds no purchase either, against 46 sale-coded rows across 450,210 shares worth $119,028,038.34, by 19 sellers, 35 of them officer rows. The full parsed record holds no purchase at all: 0 purchase rows, against 80 sale-coded rows across 956,258.33 shares worth $220,068,207.66, 65 of them officer rows, by 21 sellers — 34 sale rows, in 52 filings dated before October 3, 2025, sit outside the last year's filing window, so the full record runs wider than the one-year window (120 filings against 68). The claim is bounded by the record's span: the parsed record for this name begins in January 2025, and within that record the purchase column is blank.
Lens 4 — Congress: one member, one small purchase. The combined aggregate and the House aggregate (as of October 3, 2026) each carry 1 member with 1 purchase and 0 sales, the last purchase dated April 14, 2026, from the Republican side; the Senate aggregate (as of October 1, 2026) carries no row. The House member file attributes it to Kean, Thomas H. (R): 1 purchase, 0 sales, last dated April 14, 2026, in the $1,001–$15,000 amount band. That is the whole congressional lens: one small purchase in April, and nothing since in any file we hold.
Lens 5 — the 5% register: two passive prints, both Vanguard names. Our full parse holds 2 SC 13D/G filings, both in the SC 13G family (1 SC 13G and 1 SC 13G/A amendment); there is no SC 13D. Each filing carries one reporter row. The register maximum, and the latest filing, is Vanguard Capital Management, 68,246,741 shares and 7.49%, as of March 31, 2026, filed April 30, 2026. The register also holds The Vanguard Group at 0 shares and 0.0% as of March 13, 2026, filed March 27, 2026, reported as printed, without attributing a reason (methodology).
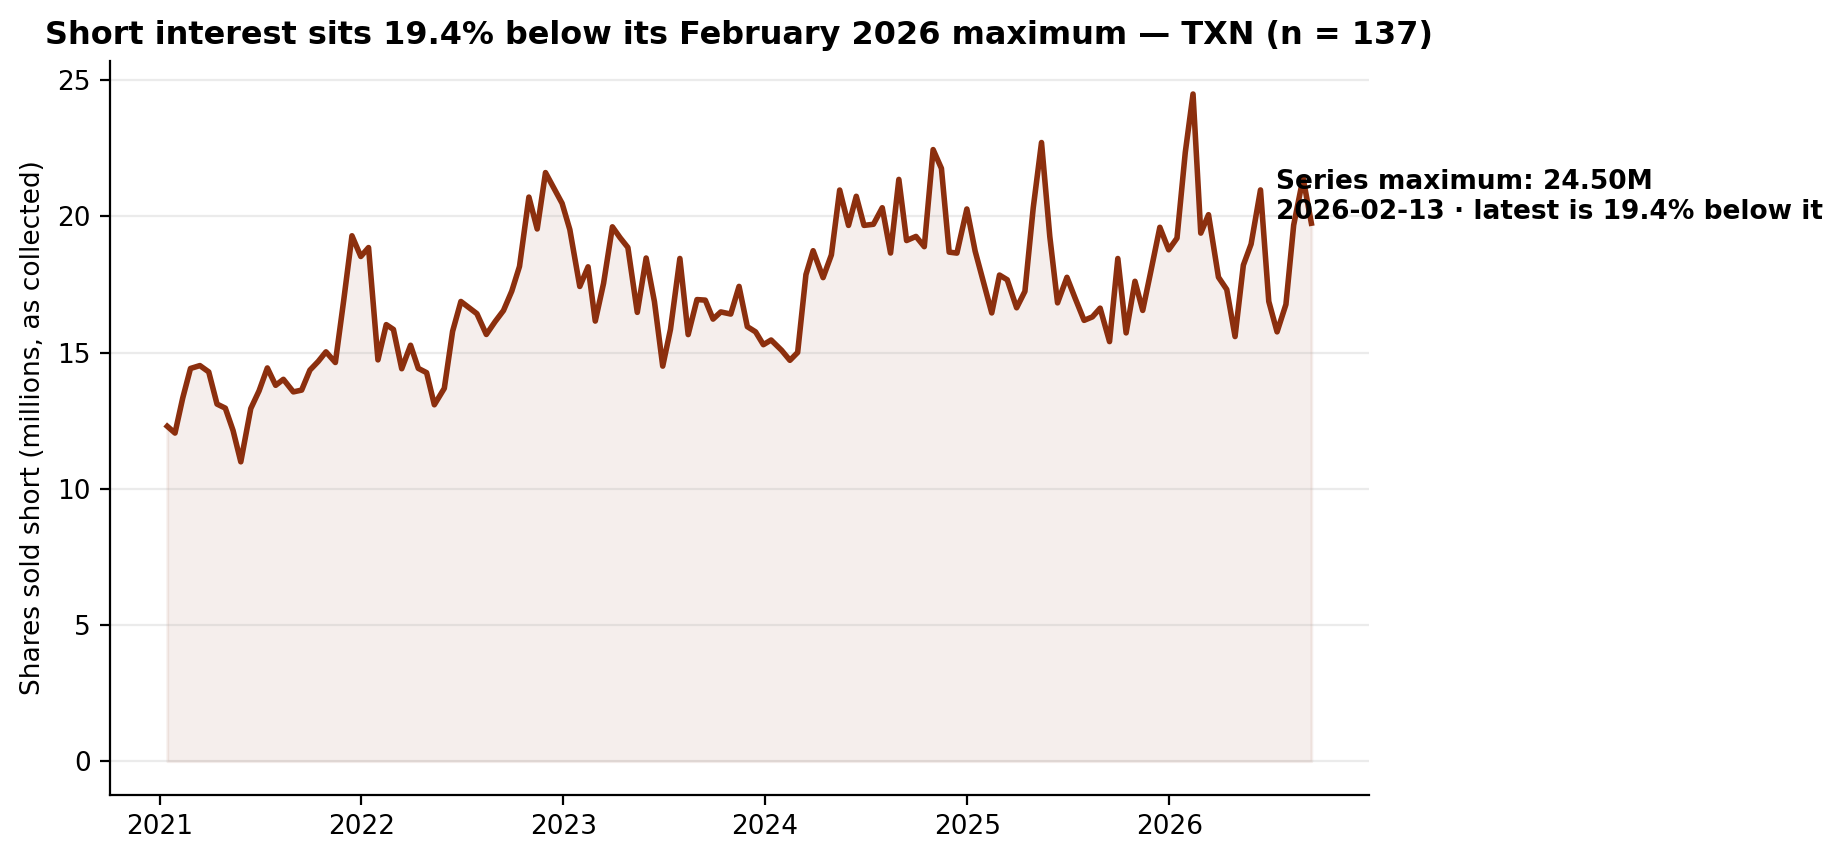
Lens 6 — short interest: a February peak, a summer rebuild. The latest FINRA settlement, September 15, 2026, records 19,753,135 shares sold short at 3.87 days to cover, 2.16% of the share count in our fundamentals file (a measured count, methodology). It is down 7.76% from the prior settlement, up 17.0% from the June 30, 2026 settlement (16,881,127 shares) and up 28.2% from the year-ago settlement (15,405,670 shares). The series maximum is 24,496,526 shares at February 13, 2026, and the latest reading sits 19.4% below it; the minimum, 10,991,894 shares at May 28, 2021, is an interior settlement. The summer's path: 16,881,127 (June 30), 15,763,842 (July 15), 16,771,217 (July 31), 19,681,524 (August 14), 21,414,170 (August 31), 19,753,135 (September 15).
The Gap
The narrative arriving this month is a bellwether chipmaker beating estimates at the end of a 60.1% year-to-date run: earnings 9.17% above consensus, revenue above consensus, a raised dividend, and the most-searched stock ticker in the country into October 22. The June tape — still the most recent complete holdings picture, taken at the end of a 53.5% quarterly rise — shows the benchmarked money leaving while the broad market arrived. Twenty-two of 147 tracked managers hold the name, and their 20 continuing holders cut 46.9% of their shares in that quarter: 18 decreases against a single increase of +0.2%, with three holders cutting more than three-quarters of their positions. Over the same quarter the full register added 434 filers and 115.8 million shares. Insiders sold in every window of the parsed record and have not bought once in it: 80 sale rows, zero purchases, in a record back to January 2025. Congress shows one $1,001–$15,000 purchase in April and nothing else; the 5% register holds two passive Vanguard prints, one of them zero; and the borrow, after peaking in February, rebuilt 17.0% between the June and September settlements. One plausible reading is that the October story is being carried by the earnings print and the broad register that built positions during the rise, while the tracked cohort used the same rise to halve its exposure, insiders kept selling, and short sellers rebuilt into the autumn.
What Would Change the Picture
Nothing above is a recommendation. These filings would change it:
- 1. The 2026Q3 13F season (filing window closing mid-November 2026). The baseline is 22 June holders with 10,621,654 shares, the continuing cohort verified at −46.9%. Whether Davis and Fundsmith stabilise or cut again, whether Saturna's lone increase repeats, and whether any of the other 125 tracked managers opens a position would change this lens.
- 2. A first insider open-market purchase — the first in the parsed record — or further sales. The record through the October 2 window end holds 0 purchases against 80 sale-coded rows. A single purchase filed after October 2 would break a pattern that currently has no exception in the record; more sales would extend it.
- 3. A second congressional transaction, in either chamber. Every congressional collection we hold carries exactly one purchase, dated April 14, 2026, and no sale and no Senate row. Any further House transaction, or a first Senate row, would change this lens.
- 4. A first SC 13D, or a 13G print above 7.49%. The register holds no activist filing at all; its maximum is a passive 7.49% print dated March 31, 2026. A 13D from any reporter, or a passive print above 7.49%, would change this lens.
- 5. Short interest above 24,496,526 shares, or below 16,881,127 shares. Above the February 13, 2026 series maximum would set a new series high; below the June 30, 2026 settlement would unwind the summer's rebuild entirely.
Methodology and data notes
- As-of & limits: The lenses rest on different clocks, none live: 13F is a June 30, 2026 snapshot published up to 45 days later; Form 4 windows run through October 2, 2026 (the last Texas Instruments filing in the parsed record is dated September 21, 2026); Congress aggregates run through October 3, 2026 (Senate through October 1, 2026); 13D/G through April 30, 2026; short interest through September 15, 2026; the price file ends October 2, 2026. Nine limits are specific to this audit. First, the roster expanded before the recent audits — from 85 managers (83 filing) to 149 (147 filing) — so "of 147" counts are not comparable to earlier pieces' "of 83" figures. Second, this name's common stock carries a single CUSIP (882508104), and the full-market by-CUSIP row matches the by-ticker aggregate on every field — holders, long holders, shares, reported value, prior holders and prior reported value — so no CUSIP blending question arises. Third, the tracked register's change labels are verified, not taken on trust: all 20 continuing holders were verified by two pairing methods — accession-prefix matching and accession identity plus CUSIP-overlap — with every label recomputing exactly, and the two September 30 early filers' labels are third-quarter changes verified at accession level against their own June rows (Sarasin 112,599 shares in accession 0001510481-26-000003, recomputing to −7.3%; David Katz – Matrix Asset Advisors 98,361 shares in accession 0001172661-26-002637, recomputing to −1.6% — that accession sits under a filing-agent prefix, 0001172661, shared with June holders, which is why a prefix-based leftover search misses it and this audit pairs at accession level). The registers then reconcile exactly once the early filers are included: the first-quarter register holds 20,321,238 shares, equal to the verified continuing holders' 19,977,178 plus Sarasin's 205,797 and Katz's 138,263 (the single first-quarter row left unassigned after the continuing holders and Sarasin are paired, accession 0001172661-26-001524, identified by elimination); the June 30 register holds 10,832,614 shares, equal to the June cohort's 10,621,654 plus the two early filers' June rows, with no remainder and no exits. The two new holders' labels are verified by that same reconciliation — the first-quarter register is fully accounted for without them, so neither Greenberg nor Maverick can have held a first-quarter row — and Maverick's own first-quarter filing under its prefix (CUSIP overlap 93) independently holds no Texas Instruments row. Both early filers imply $280.09, the September 30 close exactly; the June cohort implies $297.95 against the June 30 close of $298.07 (−0.04%). Fourth, the full-market aggregate implies $294.24 against the June 30 close of $298.07 (−1.28%): the aggregate is a reported sum that includes option rows, so its implied price need not equal the close; this audit uses filer counts and share counts as this lens's primary measures and reports the value as reported only. Fifth, the insider lens rests on a single aggregate bucket — this issuer's filings sit under one symbol spelling, "TXN", with no case split — cross-checked against a row-level scan of all 120 parsed filings for the issuer (CIK 97476): filing counts, transaction counts, share counts, officer-row counts and values reproduce exactly in every window, with a value difference of $0.00 in all three windows. On that record, every insider implied-price check passes: the 90-day implied sale price of $264.63 sits inside the filing-window close range ($253.34–$311.46), the one-year figure ($264.38) inside its range ($153.33–$332.28), and the full-record figure ($230.13) inside the full price range ($140.50–$332.28); there are no purchase rows, so no purchase-side check applies. The site's 90-day insider aggregate (dated October 22, 2026) prints the same 2 sales totalling $1,852,413.12 as the full parse's 90 days ending October 2, 2026 — the two windows end on different dates, and this audit uses the full parse. Sixth, the congressional lens is one transaction deep: the combined and House aggregates agree on a single purchase, the Senate aggregate has no row, and the House member file (politicians_members.json, as of October 3, 2026; window: 2026 House PTR filings, transactions dated on or after April 1, 2026) attributes it to one member in the smallest amount band the file prints. Seventh, the 5% register's cross-date share total of 68,246,741 is an arithmetic sum of two single-reporter rows across different as-of dates and is not a current combined stake; each filing in this register carries exactly one reporter row, so no joint-reporting duplication arises. Parsed totals match the aggregates exactly. Eighth, the short-interest series holds no step of 2x or more and none at one-half or less (the largest step is 1.198x, at September 30, 2025; the smallest is 0.781x, at January 31, 2022), and no row carries a split flag; two rows carry a FINRA revision flag (April 15, 2021; June 15, 2021). The issuer-name field reads "Texas Instruments Incorporated" at all 137 settlements, on a single market class (NNM) throughout. The share count behind the short-interest percentage is 913,247,686 shares in our fundamentals file, a measured period-end count (dei/EntityCommonStockSharesOutstanding, as of July 15, 2026), so the 2.16% figure rests on a measured denominator. Ninth, our price file records no split for this name and no single-day close move across the thresholds this audit normally treats as split patterns. The company's fundamentals as collected print fiscal 2025 revenue of $17,682,000,000 (companyfacts/us-gaap/RevenueFromContractWithCustomerExcludingAssessedTax), net income of $5,001,000,000 and assets of $34,585,000,000 (fiscal year ended December 31, 2025); those figures are reported as collected and are not used in any lens above. Every price statement from our own file is mechanical, a date and a close. The October figures in The Hype — the $284.65 close and the earnings figures — are figures published after our price file ends, and are cited as such, not blended into file-based calculations.
- Market context sources: Cyber Kendra Google Trends for the United States, snapshot updated October 22, 2026, 2:08 AM IST (the query "txn stock" led the United States trending searches in that snapshot; the page refreshes every 30 minutes, so later snapshots differ). Zacks earnings article, October 21, 2026 (third-quarter earnings of $2.62 a share against a $2.40 consensus estimate, a surprise of +9.17%; revenue of $6.06 billion against $4.74 billion a year earlier, 2.17% above consensus; shares up about 60.1% since the beginning of the year against 12.7% for the S&P 500). Zolmax earnings summary, October 21, 2026 (close of $284.65, up 2.47%, on volume of 9,742,932 shares against an average of 7,555,938; quarterly dividend raised to $1.52 from $1.42, payable November 10, 2026, to holders of record October 30, 2026). Zacks most-searched coverage, October 21, 2026 articles (Texas Instruments among the most-searched names that week, per the selection record in the datasheet). Figures we could not confirm were left out; the external items above are reported figures from those outlets, not GetCoattail measurements.
- Texas Instruments is in the GetCoattail stock-page universe: Texas Instruments (TXN) stock page. Series data: txn_lens_data.csv · txn_short_interest_series.csv. Earlier audits: Vicor · McKesson.
Past patterns are not a promise of future results. For education only — not investment advice.
This article describes public filings as of the dates stated. It is not investment advice and makes no recommendation. Filings lag reality: 13F positions are as of June 30, 2026, and later trading is not yet public.
Revision history: v1.0 — October 22, 2026: first publication.