The most repeated advice in retail investing is to copy the greats. Their portfolios are public, so buy what they buy. We rebuilt five years of those portfolios from SEC filings and tested the simplest version of the idea. The copied trades made money 56.1% of the time — and still did not beat the S&P 500.
Why this question matters
Every quarter, 13F season brings the same coverage: what Buffett bought, what Ackman sold, which stocks "the smart money is piling into." The premise sounds airtight — if several respected funds increased their positions in the same stock at once, the homework has been done for you.
The structure of the data limits what copying can mean. Form 13F is filed by institutional managers running $100 million or more in reportable securities, due within 45 days after the quarter ends (SEC, Form 13F FAQ). It lists shares owned and their value on a single day — the quarter's last — with no short positions, no prices paid, and nothing traded inside the quarter. A follower trades up to 45 days late, from a snapshot: a fair test may only trade once the information is public, and must score what happens after.
The test
We track 83 well-known funds; 81 have CIK-matched filings in the SEC datasets. A signal fired when at least three tracked funds increased a stock's weight in their portfolios versus the quarter before — weight meaning the position's value as a share of the fund's total reported value, reconstructed from reported share counts and quarter-end prices.
One boundary matters: a stock can only fire if a fund held it in both quarters — a brand-new position has no previous weight to rise from. First-time buys are not in this test at all; we score them separately below.
The trade is deliberately unglamorous. Buy at the close on the first trading day after the filing deadline — quarter-end plus 45 days — and sell one quarter later, on the same rule. Prices are dividend-adjusted closes; the benchmark is SPY over the identical windows. The sample is 2,724 signals across 19 quarters (2021 Q3 to 2026 Q1), covering 490 distinct stocks.
What five years of crowded buys did
| Measure | Result (n = 2,724 signals) |
|---|---|
| Win rate | 56.1% |
| Beat SPY over the same window | 44.3% |
| Average return, next quarter | +2.69% |
| Median return | +1.81% |
| Average winning signal | +12.69% (n = 1,527) |
| Average losing signal | −10.07% (n = 1,197) |
| S&P 500 (SPY), same windows | +3.23% |
| Excess vs SPY | −0.54 pts |
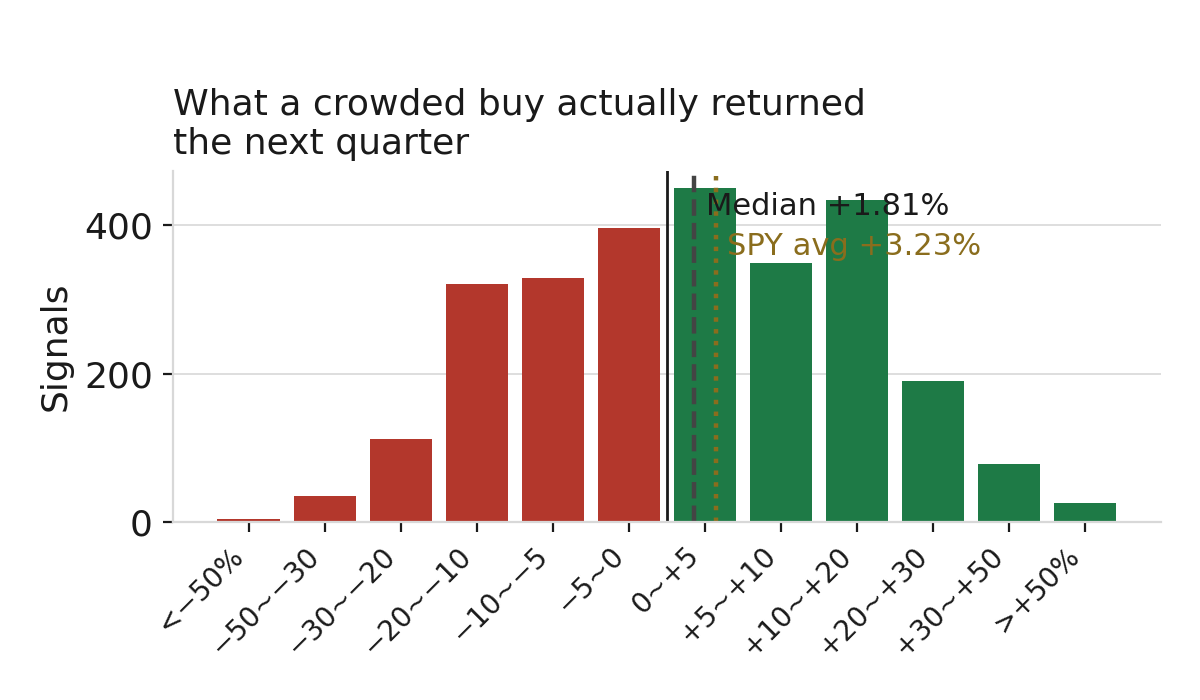
Start with the shape of the outcome. The typical signal was small (median +1.81%). One signal in ten lost more than 14.6%; one in ten gained more than 20.8%. The average win (+12.69%) was larger than the average loss (−10.07%) — not the familiar story of losses dwarfing wins. Frequent, modest wins had to compete with a benchmark averaging +3.23% — and only 44.3% beat it at all.
The basket also behaved like a slightly damped version of the market. Regressing the 19 quarterly returns on SPY's gives a beta of 0.86 (95% CI 0.59 to 1.12) and an alpha of −0.04 pts per quarter (CI −1.68 to +1.60): in the five quarters SPY fell, the signals lost about the same (−4.52% versus −4.55%); in the 14 it rose, they gained less (+5.23% versus +5.90%). Neither estimate is distinguishable from plain index exposure — the intervals include a beta of 1 and an alpha of 0 — so treat this as description, not law.
The signal lagged SPY in 11 of 19 quarters. "Held" shows the actual holding window, mostly in the calendar quarter after the signal quarter:
| Quarter | Held | Signals (n) | Avg | SPY | Excess |
|---|---|---|---|---|---|
| 2021 Q3 | 2021-11-16 → 2022-02-15 | 158 | −4.32% | −4.61% | +0.29 |
| 2021 Q4 | 2022-02-15 → 2022-05-17 | 137 | −7.72% | −8.18% | +0.46 |
| 2022 Q1 | 2022-05-17 → 2022-08-16 | 114 | +5.05% | +5.69% | −0.64 |
| 2022 Q2 | 2022-08-16 → 2022-11-15 | 109 | −4.16% | −6.88% | +2.72 |
| 2022 Q3 | 2022-11-15 → 2023-02-15 | 92 | +3.85% | +4.36% | −0.51 |
| 2022 Q4 | 2023-02-15 → 2023-05-16 | 176 | −3.67% | −0.52% | −3.15 |
| 2023 Q1 | 2023-05-16 → 2023-08-15 | 141 | +11.20% | +8.36% | +2.84 |
| 2023 Q2 | 2023-08-15 → 2023-11-15 | 120 | +0.44% | +1.89% | −1.45 |
| 2023 Q3 | 2023-11-15 → 2024-02-15 | 122 | +12.12% | +12.09% | +0.03 |
| 2023 Q4 | 2024-02-15 → 2024-05-16 | 156 | +6.09% | +5.64% | +0.45 |
| 2024 Q1 | 2024-05-16 → 2024-08-15 | 139 | +2.27% | +4.95% | −2.68 |
| 2024 Q2 | 2024-08-15 → 2024-11-15 | 130 | +5.90% | +6.23% | −0.33 |
| 2024 Q3 | 2024-11-15 → 2025-02-18 | 185 | +2.08% | +4.75% | −2.67 |
| 2024 Q4 | 2025-02-18 → 2025-05-16 | 129 | −2.72% | −2.54% | −0.18 |
| 2025 Q1 | 2025-05-16 → 2025-08-15 | 166 | +3.47% | +8.61% | −5.14 |
| 2025 Q2 | 2025-08-15 → 2025-11-17 | 152 | +1.68% | +3.74% | −2.06 |
| 2025 Q3 | 2025-11-17 → 2026-02-17 | 172 | +9.20% | +2.88% | +6.32 |
| 2025 Q4 | 2026-02-17 → 2026-05-18 | 155 | +2.27% | +8.47% | −6.20 |
| 2026 Q1 | 2026-05-18 → 2026-08-17 | 171 | +7.58% | +4.88% | +2.70 |
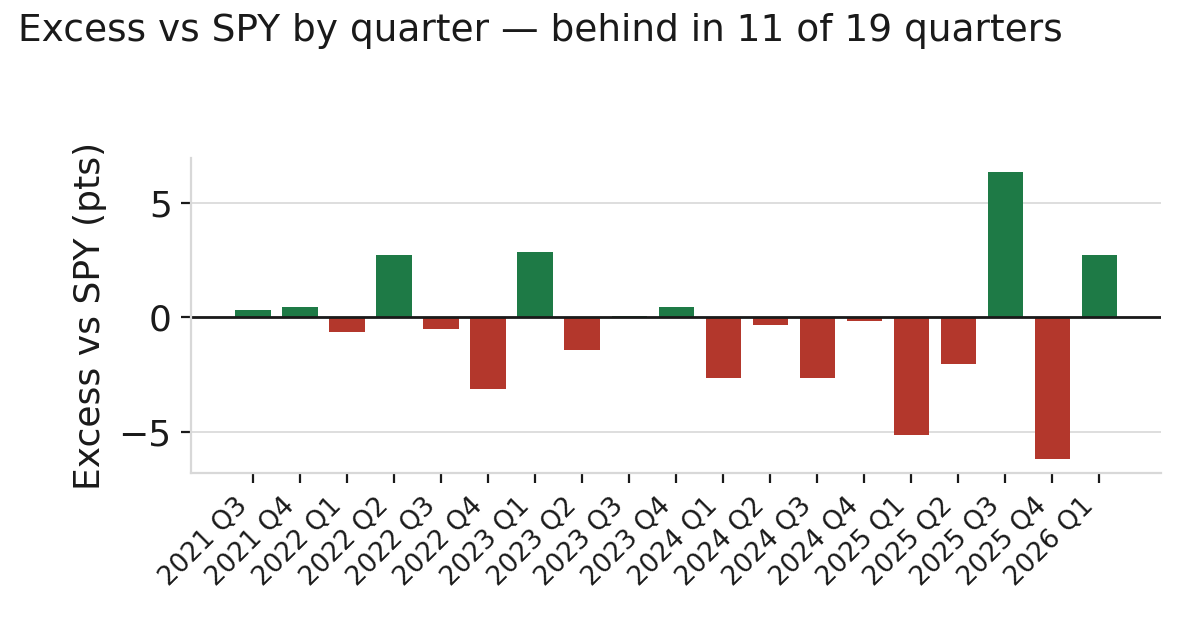
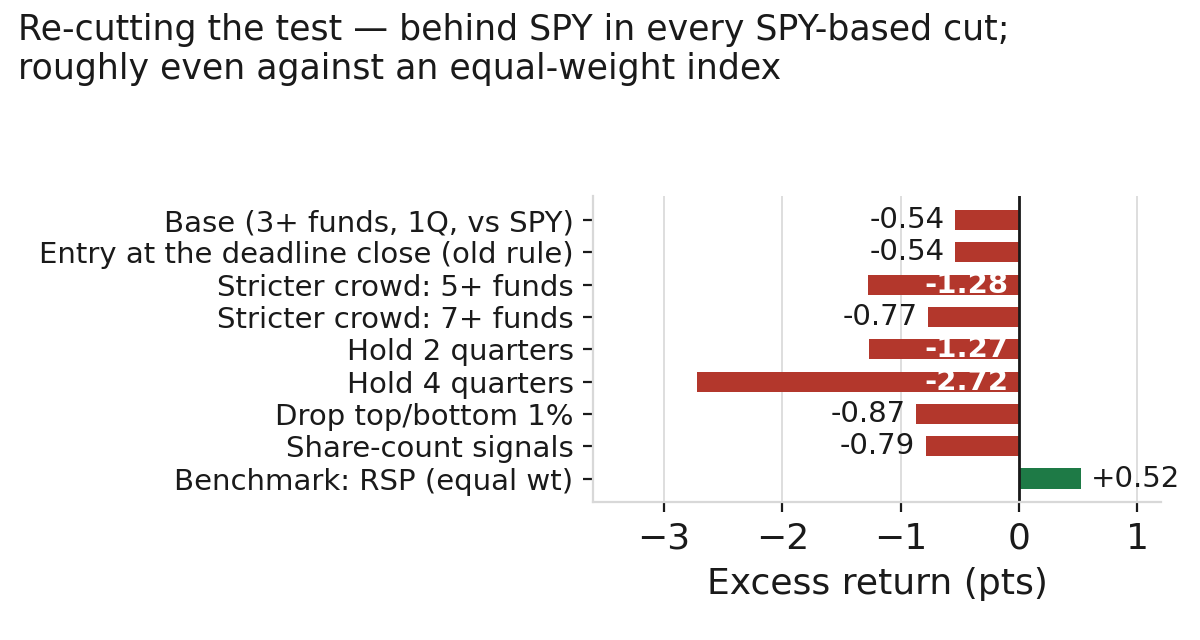
One more piece of honesty before the stress tests. These are 2,724 signals but only 19 independent quarters — signals inside the same quarter rise and fall together, so they are not 2,724 separate coin flips. A t-test on the 19 quarterly excess returns gives an average of −0.48 pts, a 95% confidence interval from −1.90 to +0.93 pts, and p = 0.48: this sample cannot rule out that the true gap is zero. What the data does support is narrower: against SPY, every variation of the test below still came out behind; against an equal-weighted benchmark, the same signals roughly broke even.
The more aggressive version did no better: when at least one fund at least tripled its share count in a position worth $5M or more — 598 signals — the win rate was 54.8% and the excess versus SPY was −1.80 pts.
Does the result survive?
A stricter crowd; a longer hold. Requiring five or more funds to raise a stock's weight leaves 995 signals: win rate 55.5%, excess −1.28 pts. Seven or more leaves 486: win rate 58.6%, excess −0.77 pts. A bigger crowd did not produce a better trade. Holding two quarters instead of one (2,553 signals) widens the shortfall to −1.27 pts; four quarters (2,226), to −2.72 pts. Time did not heal it.
A different benchmark. Against the equal-weighted S&P 500 (RSP) instead of cap-weighted SPY, the same signals average +2.69% versus RSP's +2.17% — an excess of +0.52 pts, with 48.6% of signals beating that benchmark. The result flips sign. One plausible reason: SPY's returns were concentrated in the very largest stocks over much of this period, and a basket of crowded fund buys is not a mega-cap portfolio. We did not test that decomposition directly, so treat it as a hypothesis, not a finding. In short: the signal roughly matched an equal-weighted market and did not beat the cap-weighted index a copycat would most likely have held.
Removing the extremes; counting shares. Deleting the top and bottom 1% of outcomes (54 signals) moves the excess to −0.87 pts — the headline is not a few outliers' fault; if anything, they were helping. And because portfolio weight can rise on price alone, we rebuilt the test on share counts only — a signal when three or more funds increased their split-adjusted share count. It produced 1,502 measurable signals, a 57.2% win rate, and an excess of −0.79 pts. Same story.
Entering at the deadline close. Our headline entry waits one trading day past the deadline: the deadline close assumes every filing is public by then. The EDGAR acceptance timestamps say otherwise for a minority of the 1,508 filings used: 68.9% were in by the deadline close, 24.1% later that day, 7.0% after the deadline day. Re-running the test the old way — at the deadline closes — barely moves anything: average +2.74%, excess −0.54 pts, 45.1% beating SPY, p = 0.48. The shortcut did not produce the headline either; the later entry is cleaner, and the details are in the methodology box.
The first-time buys that aren't in the test. Scored separately — at least three funds opening a new position in the same stock in one quarter — 185 measurable signals did noticeably better: win rate 60.5%, average +4.90%, excess +1.55 pts, 52.4% beating SPY. Treat it as a lead, not a result: the sample is small, "new" includes un-copyable events like spin-off distributions and IPO allocations (the best one, GE Vernova in 2024 Q2 at +74.64%, came from GE's spin-off), and it has not been stress-tested.
Three signals out of 2,724
The best. Carvana (CVNA), 2023 Q1: three funds increased its weight — the minimum crowd our definition allows. It then returned +270.94% against SPY's +8.36%. The best single outcome came from the weakest form of the signal.
The worst. Shopify (SHOP), 2021 Q4: three funds increased its weight, returning −58.11% while SPY fell 8.18% — the single worst outcome of all 2,724 signals. Crowded buying offered no protection at all.
The typical. Anheuser-Busch InBev (BUD), 2022 Q4: three funds increased its weight, and it returned +1.81% — exactly the median outcome — while SPY returned −0.52%. This is what copying usually felt like: a small, unremarkable gain.
Objections and limits
"Weight isn't buying." Correct as far as it goes — a weight rises when the price rises, even if the fund never bought a share. Hence the share-count version above: it counts only increases in shares held, and lands in the same place (−0.79 pts). The objection is real; it does not explain the result.
"You picked a benchmark designed to win." Partly sustained. SPY is the right headline benchmark — it is what a follower gives up by copying — but the RSP check shows the shortfall is benchmark-specific: against an equal-weighted index the signals were a coin flip (48.6% beat it). Anyone citing this study as "funds can't pick stocks" is overstating it; the narrower claim is that copying their crowded buys did not beat the cap-weighted index.
Missing data, counted. Of 74,506 candidate fund–stock pairs held in both quarters, 83.2% could be compared; 13.0% were dropped for having no ticker mapping, 3.7% for having no quarter-end price. The dropped securities skew toward names without a U.S. ticker or price history — plausibly both future delistings, which would have dragged returns down, and obscure winners, which would have lifted them. We cannot sign that bias, so we report the counts instead. Once a signal was generated, measurement was complete: returns exist for all 2,724 signals. (The share-count variant excepted: 25 of its 1,527 signals, 1.6%, went unmeasured.)
Why the Track Record count differs. The Track Record page scores the same signal on a different population: computed under the current SEC ticker mapping, it counts 2,936 signals and −0.4 pts of excess return, against this article’s 2,724 signals and −0.54 pts. The signal definition and the entry rule are identical; the populations are not — the signals here come only from the comparable pairs counted above.
The fund list is today's list. The 83 tracked funds are managers who are well known now, applied back to 2021. Funds that closed before becoming famous never enter the sample. If anything that flatters the signals — these are the survivors — though that is our reading, not a measurement.
How to read a crowded buy now
Three habits follow — all about checking, not trading.
First, treat a crowded buy as the start of research, not the end of it. On GetCoattail's stock pages you can see which tracked funds hold a stock and how each position changed — opened, added, trimmed, or held — so check the crowd's composition before counting it: three funds adding shares is a different fact from three weights drifting up with a rising price, and both scored the same.
Second, read the exits with the same attention as the entries. Our companion analysis found the strongest pattern was not a buy at all: when three or more funds exited a stock completely, it trailed SPY by 5.34 pts the following quarter (95% CI −8.17 to −2.50) — the largest effect we measure, and the only one whose interval excludes zero. Of the 190 exit signals, 151 could be priced; the rest were largely delisted or unmapped names. That analysis has since been recomputed on the same basis as this one — see its revision history. See The Loudest Signal in 13F Filings Isn't a Buy.
Third, use ranking tables with the base rate in mind: the quarterly BEST lists on our Track Record page rank stocks by how many top funds hold and add them — a map of where the research effort went, not of what will beat the market.
The filings are real, and so is the homework behind them. What five years of them do not show is an edge that survives being copied for free.
Methodology and data
- Data: SEC Form 13F filings for 83 tracked funds (81 with CIK-matched filings in the SEC Form 13F datasets used here), quarters 2021 Q3–2026 Q1. Prices are dividend- and split-adjusted daily closes (Yahoo Finance). Benchmarks: SPY; RSP for the equal-weight sensitivity check.
- Signal: three or more tracked funds increasing a stock's portfolio weight quarter over quarter. Position values are reconstructed from reported share counts × quarter-end unadjusted closes, because the filings report shares; totals are the sum of a fund's reported positions.
- Signal boundaries: a position counts only if the fund held it in both quarters, so first-time positions never fire this signal (they are scored separately in the text); a complete exit is a different signal, not part of this one. Values use reported shares × unadjusted closes at each quarter-end, so a stock split changes the share count and the price together and does not by itself move a weight; the share-count variant adjusts share counts for splits explicitly. Securities are counted by CUSIP, so two share classes of one company count as two securities.
- Timing: headline entry at the close on the first trading day after the filing deadline (quarter-end + 45 days; trading days follow the SPY calendar, so weekends and U.S. market holidays are skipped — the February 16, 2026 deadline was a market holiday, and that quarter's signals entered at the February 17 close), exit one quarter later on the same rule (two and four quarters in the sensitivity checks). EDGAR acceptance check on the 1,508 filings used: 68.9% accepted by the deadline close, 24.1% after that day's close, 7.0% after the deadline day — the reason the deadline close itself is not the headline entry. The deadline-close sensitivity (average +2.74%, excess −0.54 pts, 45.1% beating SPY, quarterly p = 0.48) reaches the same conclusion; the 7.0% group — late filings and amendments — remains a limitation of any deadline-based rule.
- Exclusions: a fund is compared only in quarters where it filed in both the current and prior quarter (35 of 1,539 fund-quarters lacked a prior-quarter filing). Securities without a ticker mapping or a quarter-end price could not be evaluated (see Objections and limits).
- Costs: trading costs and taxes are not reflected. Returns are equal-weighted across signals.
- Signal-level data: all 2,724 signals — quarter, stock, number of funds, entry and exit dates, return, SPY return, and excess — are published with this article as signals_s1.csv, so every figure above can be recomputed from the raw rows.
- Full scoreboard: every quarter's BEST list and its scored outcome is on the Track Record page. Related research: the exit-signal analysis and why a fraud detector flags NVIDIA.
Past patterns are not a promise of future results. For education only — not investment advice.
Revision history
- October 10, 2026 (companion figure updated): The crowded-exit figure quoted in the text was updated from −4.56 pts (130 of 190 priced, preliminary) to −5.34 pts (151 of 190 priced; 95% CI −8.17 to −2.50), after the companion analysis was recomputed on this article's entry basis and the October 2026 SEC ticker mapping. This article's own figures are unchanged — they come from the signal file published with it. The site's two counts of crowded-accumulation signals (2,724 here, 2,936 on the Track Record) differ for the same reason — the mapping changed between the two computations — and the Track Record now carries a footnote saying so.
- October 4, 2026 (entry-basis revision): the headline entry moved from the filing deadline's own close to the close on the first trading day after the deadline — the rule the methodology box now states — because the acceptance audit in the first revision showed 31.1% of the filings behind the signals were not public at the deadline close. New headline figures: win rate 56.1% (was 56.8%), average +2.69% (was +2.74%), median +1.81% (was +1.86%), SPY +3.23% (was +3.28%), excess unchanged at −0.54 pts, quarterly p = 0.48 unchanged. The signal statistics on the Track Record page moved to the same basis at the same time. Two knock-on changes: the count of quarters behind SPY is now 11 of 19 (several near-zero quarters flip when entry and exit each move one trading day), and the single worst signal is now Shopify (2021 Q4, −58.11%); Sea Limited's window return under the new entry is −54.67%. The companion exit figure cited in the text is now −4.56 pts on the same basis (still preliminary, still 130 of 190 priced).
- October 4, 2026 (pre-publication revision): Corrected the 2024 Q4 row of the quarterly table — excess is −0.23 pts, not −3.09 (the average return had been copied into the excess column); with the correction, the table's excess column averages −0.50 pts, matching the t-test input. Removed the description of 2021 Q3 as the strategy's worst quarter — it was not, on either an absolute or a relative basis — and replaced a pattern claim that rested on two quarters with a regression of the 19 quarterly returns (beta 0.86, alpha −0.05 pts (on the pre-revision basis), both statistically indistinguishable from plain index exposure). Added the share of signals beating SPY (45.1%), holding windows for every quarter, an entry-timing sensitivity built from EDGAR acceptance timestamps, and a separate score for first-time positions (n = 185). Flagged the companion exit-signal figure (−3.94 pts) as preliminary, with its priced sample (130 of 190). Title changed from "Still Lost" to "Still Didn't Beat" to match the confidence interval. None of these changes alters the headline result: the point estimate against SPY remains −0.54 pts.