U.S. rules require anyone who beneficially owns more than 5% of a registered equity class to disclose it: on Schedule 13D if they hold it with control intent, or on the shorter Schedule 13G if they are a qualified institution or passive holder without that intent (SEC, Fact Sheet: Modernization of Beneficial Ownership Reporting). The 13D is the filing activists are known by — it demands their plans, their financing, their agreements. The question practically asks itself: after one lands, does the stock drift?
What we measured
We took every SC 13D, 13D/A, 13G and 13G/A filing accepted by EDGAR from January 2021 through December 2024 — 126,316 unique filings — grouped them into filer–issuer pairs, and defined an event as each pair's first non-amendment filing of each form: 4,440 initial 13Ds and 27,362 initial 13Gs. (523 pairs produced both a 13G event and a later, separate 13D event; amendments never create events, and 16,704 pairs whose first filing predates the corpus appear only as amendments and were excluded.) Each event was mapped to a ticker through the SEC's CUSIP and company files and scored against our standard price history: entry at the close of the first trading day after the filing date, measured 63, 126 and 252 trading days forward against SPY over the same dates.
That last step is where the sample shrinks, and it shrinks unevenly. Prices exist for 356 of the 4,440 13D events (8.0%) and 4,261 of the 27,362 13G events (15.6%). The priced events are, by construction, the issuers inside the price universe this site maintains — listed, more liquid names — and the dropout rates differ by form, so the two groups below are not perfectly matched samples. Every number that follows carries that caveat, and we publish the full scored list so the selection is auditable.
- Mean 63-trading-day return versus SPY: −5.1% after an initial 13D (n = 356), −5.3% after an initial 13G (n = 4,261). Difference: +0.2 points, 95% CI −3.8 to +4.3.
- The median stock in both groups trailed SPY by 6.6 points over 63 trading days; only about 35% of stocks in either group beat the index.
- By reported stake — under 5%, 5–7.5%, 7.5–10%, 10–20%, 20% and up — there was no ordering: the best-looking band was 5–7.5% (+1.9%) and the worst was 7.5–10% (−15.6%, n = 31).
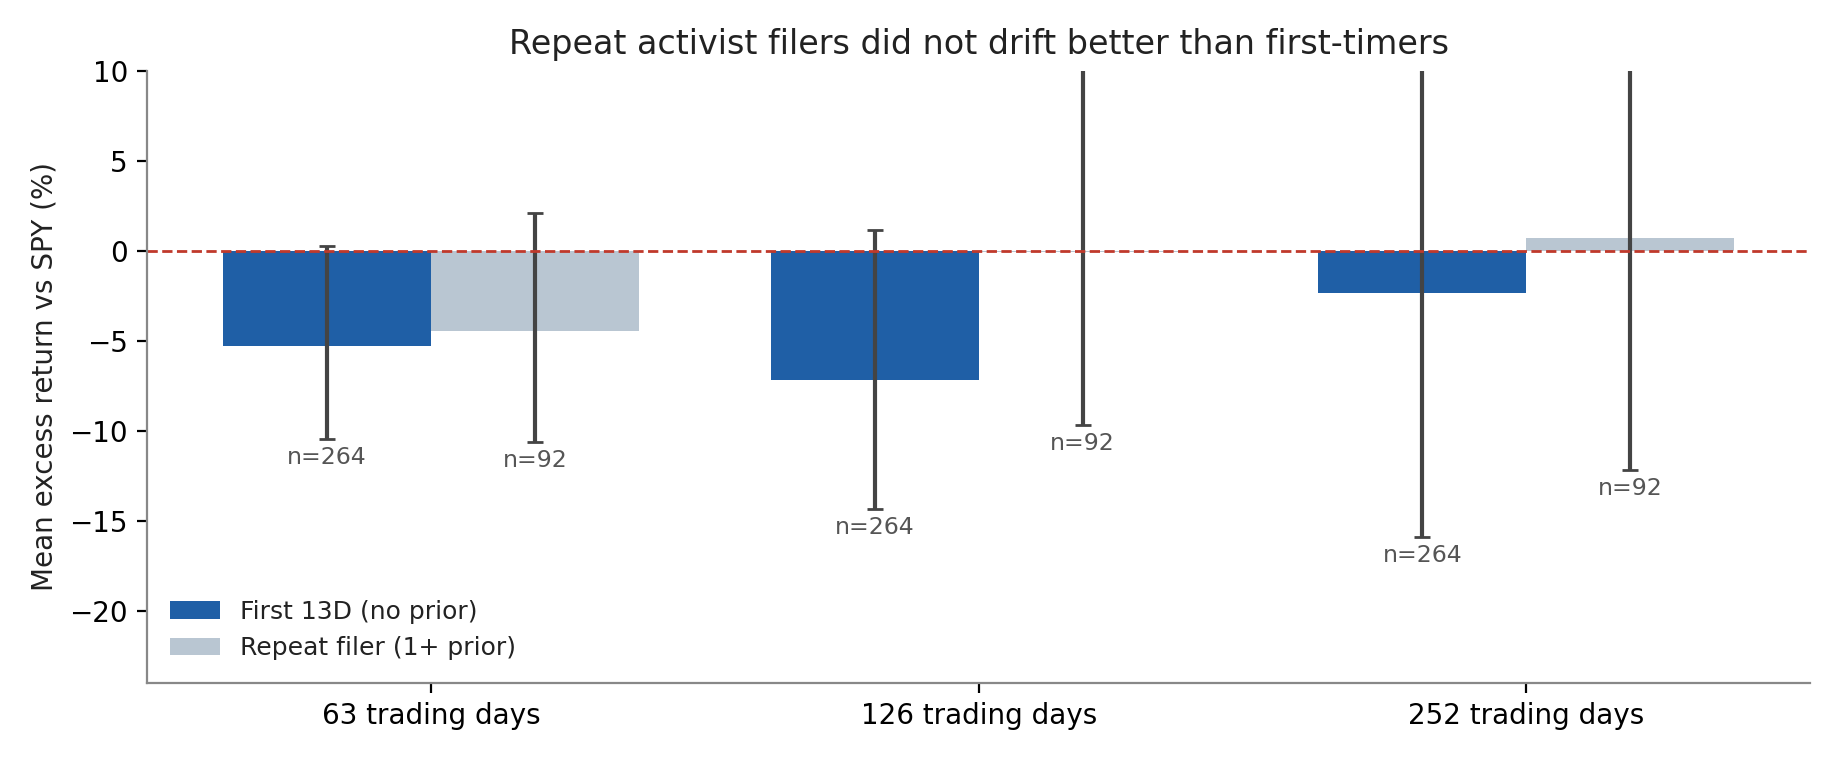
- Filers who had disclosed a 13D before did no better than first-timers: −4.5% vs −5.3% at 63 days (difference +0.8 points, CI −7.3 to +9.5).
The headline: both forms lagged, by the same amount
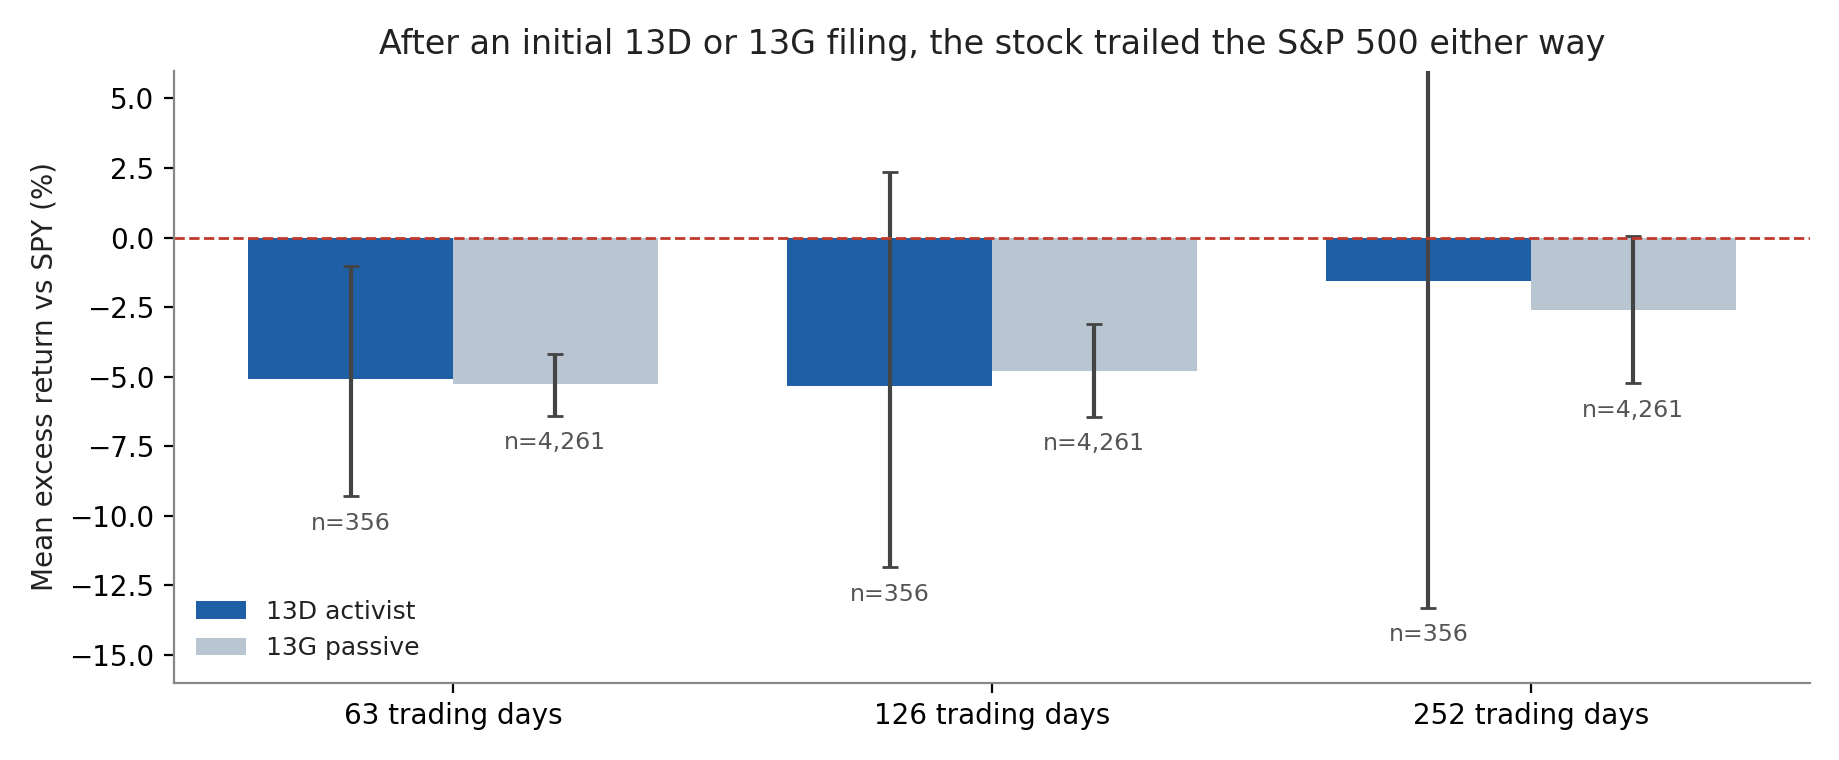
| Horizon | 13D mean (n = 356) | 95% CI | 13G mean (n = 4,261) | 95% CI | Difference |
|---|---|---|---|---|---|
| 63 trading days | −5.1% | [−9.3, −1.0] | −5.3% | [−6.4, −4.2] | +0.2 pts [−3.8, +4.3] |
| 126 trading days | −5.3% | [−11.9, +2.4] | −4.8% | [−6.4, −3.1] | −0.6 pts [−6.7, +6.9] |
| 252 trading days | −1.6% | [−13.3, +12.6] | −2.6% | [−5.2, +0.1] | +1.0 pts [−9.7, +13.8] |
Mean and median tell the same story here — the medians at 63 days are −6.6% (13D) and −6.6% (13G), and the win rate against SPY is 34.8% and 35.1%. At one year the medians are −16.6% and −11.3%: the typical disclosed name kept lagging even where the mean recovered toward zero on a few large winners.
Three horizons, three difference intervals, all centered near zero and all containing it. Under the standards we apply to our own research, that is the whole result: we find no evidence that an initial 13D was followed by different price drift than an initial 13G in 2021–2024 — and both were followed, on average, by underperformance against the index.
Part of the lag was the neighborhood
The 2021–2024 window punished the kind of stock that draws a 13D or 13G in the first place: smaller, less liquid names, while index returns were carried by a handful of very large companies. To separate the filing from the neighborhood, we recomputed each event against a date-matched baseline — the average excess return of every stock in the same price universe entering on the same day. On the 13D events' entry dates the universe itself averaged −1.9 points versus SPY over 63 days; on the 13G dates, −2.7 points. Roughly half of the raw lag was the universe, not the filing.
Subtracting that baseline shrinks both groups but does not rescue either: −3.2 points adjusted for 13D (interval −6.9 to +1.1, which includes zero) and −2.6 points for 13G (−3.6 to −1.4, which does not). The adjusted difference between the forms is −0.6 points [−4.5, +3.6]. In plain terms: names that had just been disclosed trailed even their same-day peers on point estimates, the data are too thin to say that firmly for 13D alone, and the form of the filing still does not separate the groups.
A bigger stake did not mean a better drift
If disclosure drift were an information signal, a larger reported stake should mean a stronger one. It did not sort that way. Among the 195 scored 13D events with a reported percent of class, the 63-day means by band were: under 5% (as filed), −2.9% (n = 31); 5–7.5%, +1.9% (n = 58); 7.5–10%, −15.6% (n = 31); 10–20%, −4.2% (n = 35); 20% and above, +0.9% (n = 40). The 161 scored events with no reported percent averaged −7.7%. The ordering jumps around — the second-smallest band is the worst by a wide margin — and with six bands of 31 to 161 events each, one band's interval excluding zero is what chance alone produces in a family this size. We report the bands because readers will look for them; we draw no gradient from them. (The percent column is the cover-page figure as filed; it is missing from about 45% of scored 13D events, and we never treat a missing percent as zero.)
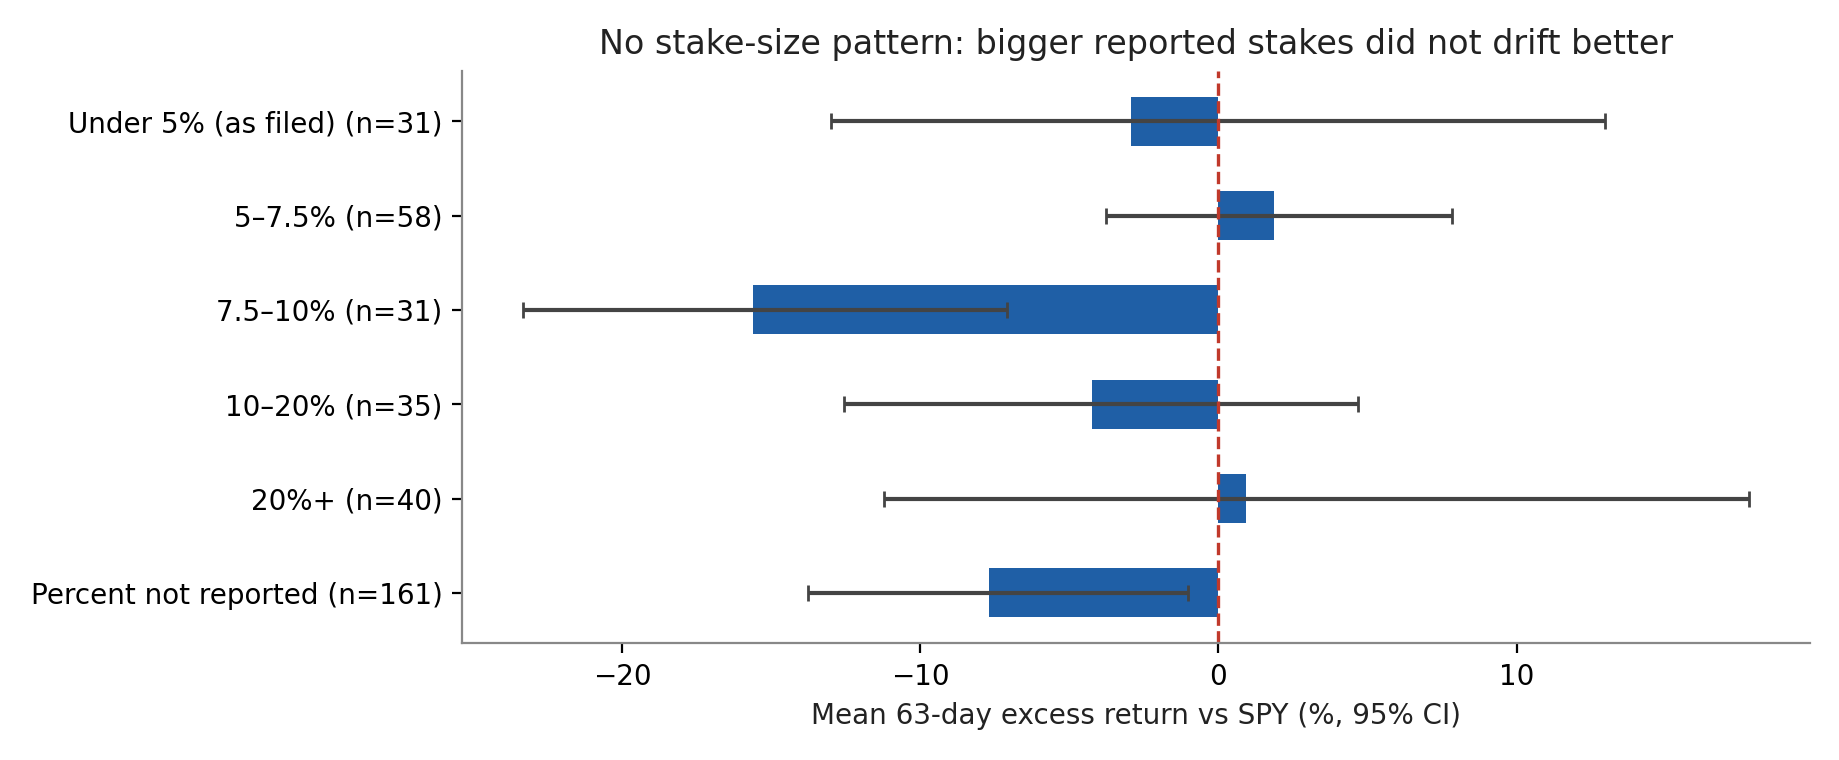
Two filings frame the range. The largest reported stake in the scored set is a control holder, not a raider: Loews Corporation's 13D on CNA Financial, filed August 2, 2023, reporting 91.7% of the class; CNA then ran essentially even with SPY over the next 63 trading days (+0.4 points). The median scored 13D sits at the other end of the size scale: Caligan Partners' filing on Exelixis on March 20, 2023, followed by a 63-day excess of −6.6%, the typical outcome in this sample.
Repeat activists did not drift better either
The remaining version of the idea is that the filer, not the filing, is the signal — that investors who run this play repeatedly know which names will move. We classified each 13D event by how many initial 13Ds the same filer had already submitted at that moment (point-in-time, to keep future filings out of the classification). First-time filers: −5.3% at 63 days (n = 264). Filers with at least one prior 13D: −4.5% (n = 92). Filers with two or more priors: −2.2% (n = 58). The point estimates lean the "right" way and the intervals swallow them: the repeat-minus-first difference is +0.8 points [−7.3, +9.5] at 63 days and +7.1 points [−3.3, +18.7] at 126 days. Worse for the idea, restricting to 2023–2024 events — where the classification has at least two years of observed history behind it — flips the sign: first-timers averaged +4.4% (n = 86) against −0.7% for repeat filers (n = 49), difference interval −20.8 to +9.2 points. An effect that changes sign between the full sample and its better-measured half is not an effect we can report as found.
Checks that did not change the answer
Entering on the filing day's close instead of the next day's leaves the picture intact (13D −4.6%, 13G −5.1%, difference interval −3.8 to +4.6 points). Scoring the events our main price history cannot reach — 122 additional 13Ds and 1,456 additional 13Gs — on a second, dividend-adjusted price source gives a wild point estimate for the small 13D cell (+13.7% at 63 days, difference interval −6.6 to +57.8 points) that reverses by one year (−16.1% for 13D, −9.9% for 13G); a cell that unstable is reported here for completeness and used for nothing. One genuine selection tilt is worth naming: scored 13D events report a median stake of 8.0% against 10.1% for the unscored ones, so the priced sample leans slightly toward smaller reported stakes.
What this does not show
This is a study of the priced minority of disclosures, in one four-year window whose market punished small names; it does not measure what happened in the days between a stake crossing 5% and the filing becoming public, which is where any announcement effect would live (during most of this window an initial 13D was due within ten days, and institutions could file an initial 13G as late as 45 days after the year of the crossing — the disclosure lag is part of the design, and our clock starts at disclosure). It says nothing about any single campaign, and nothing about funds whose 13D is a parent reporting on a controlled subsidiary — those are in the data, CNA above among them. What it does say is narrower and, we think, more useful: in 2021–2024, the arrival of an initial activist filing, a repeat activist filing, or a large passive filing was not, on average, followed by the stock beating the market or its peers — and the form on the cover did not predict which names would do least badly.
Methodology and data
Population: all SC 13D/13D/A/13G/13G/A filings in the EDGAR-derived corpus assembled for this study (acceptance dates Jan 1, 2021 – Dec 31, 2024): 126,701 rows, 126,316 unique by accession number. Events: for each (filer CIK × issuer CIK) pair, the first non-amendment filing of each form — 4,440 13D events, 27,362 13G events. Pairs visible only through amendments (16,704) are excluded as left-censored. Mapping: issuer CUSIP → ticker via the pipeline CUSIP map (built from SEC company files and OpenFIGI), falling back to issuer CIK → current SEC ticker file; 2,689 13D and 16,880 13G events mapped. The CIK fallback applies today's ticker to historical events; renamed or recycled tickers can mis-map (10.7% of scored events took this route). Scoring: entry at the first close after the filing date; horizons of 63/126/252 trading days on the stock's own trading calendar, SPY measured over the same calendar dates. Prices are the site's standard history (Yahoo chart closes; dividends not reinvested — SPY returned +73.9% on this basis over Sep 27, 2021 – Oct 2, 2026, versus +85.9% dividend-adjusted, which is why the second price source in our robustness check is never mixed into the headline). Scored: 356 13D and 4,261 13G events at every horizon. Inference: means with 95% confidence intervals from an issuer-cluster bootstrap (2,000 resamples); win rate = share of events with positive excess return. Stake bands use the cover-page percent of class as filed; missing percents are a separate category, never zero. Filer experience counts the filer's initial 13Ds strictly before the event date. Schedule 13D/13G eligibility and deadlines are as described in the SEC's fact sheet linked above; the shortened deadlines adopted in October 2023 took effect for 13G filers from September 30, 2024, so most of this sample was filed under the earlier deadlines. The scored event list — every event behind every number above — accompanies this article: scored_13d13g_events.csv (4,617 events). This analysis is for information only and is not investment advice. Past filing patterns do not predict future returns. Figures exclude transaction costs, taxes and market-impact costs, which are material for the smaller names that dominate this sample.
Revision history
- v1.0 — October 15, 2026: first publication. 13D/G corpus covering filings accepted Jan 1, 2021 – Dec 31, 2024; prices through October 2, 2026.