A Form 13F is the quarterly holdings report that U.S. investment managers running more than $100 million must file with the SEC. It lists every long stock position held at quarter-end — no shorts, no options detail beyond listed puts and calls, and one structural catch: it is due up to 45 days after the quarter closes. In our panel the median fund filed on day 45. So a "new position" in a 13F is a purchase that happened sometime in the previous three months, revealed up to six weeks after the quarter ended. The coattail idea — buy what they just bought — assumes something is still left after that lag. We tested exactly that assumption, in both directions: initiations (a fund holding a stock it did not hold the quarter before) and full exits (a holding that disappears entirely), scored against what the same funds merely kept holding.
What we measured
We rebuilt quarter-by-quarter holdings for the funds this site tracks — 147 of the 149 on the roster have a CIK we can match to EDGAR filings (Scion Asset Management and Makaira Partners have none on file and no current filings, so they sit this test out) — from the SEC's Form 13F Data Sets, using the same chosen filing per fund and quarter as our production backfill: the latest non-notice filing for each manager. Long common-stock rows only; option rows never count as holding a stock. That gives 40 quarters, 2016Q3 through 2026Q2, and 352,624 classified fund-stock-quarter transitions: 40,323 initiations, 39,893 full exits, 272,408 positions held in both quarters. A fund that skips a quarter makes its transitions unclassifiable — we never read a missing filing as an exit.
Each event enters at the close of the first trading day after its fund's filing date — the earliest price at which the disclosure was public — and is measured 21, 42 and 63 trading days forward against SPY over the same dates. The benchmark for "did the change matter" is the control group: positions the same funds kept holding, entered under the identical rule on the same funds' filing dates. Scoring shrinks the sample, unevenly: we could price 59.0% of initiations, 52.9% of exits and 69.1% of holds at 63 days — the unpriced are mostly names outside our price universe (foreign listings, funds, delisted tickers) plus the most recent quarter's events, whose 63 days have not elapsed yet. Every figure below is from the priced subset, the full scored list is published with this article, and the group dropout rates are in the methodology box.
- New positions, 63 trading days after the filing: mean excess return 0.0 points (n = 23,809; 95% CI −0.4 to +0.4). Median −0.8 points; 47.3% beat the index.
- Full exits: mean 0.0 points (n = 21,113; CI −0.4 to +0.3) — stocks the cohort sold out of did not fall afterwards either.
- Kept positions (control): mean −0.1 points (n = 188,101; CI −0.4 to +0.1). Every difference between the three groups, at every horizon, has an interval containing zero.
- Entering at the quarter-end close — before the filing existed — initiations show +0.6 points (CI +0.2 to +1.1). That entry price was never available to anyone reading the filing. The gap lived inside the disclosure lag.
The headline: the change itself carried no information
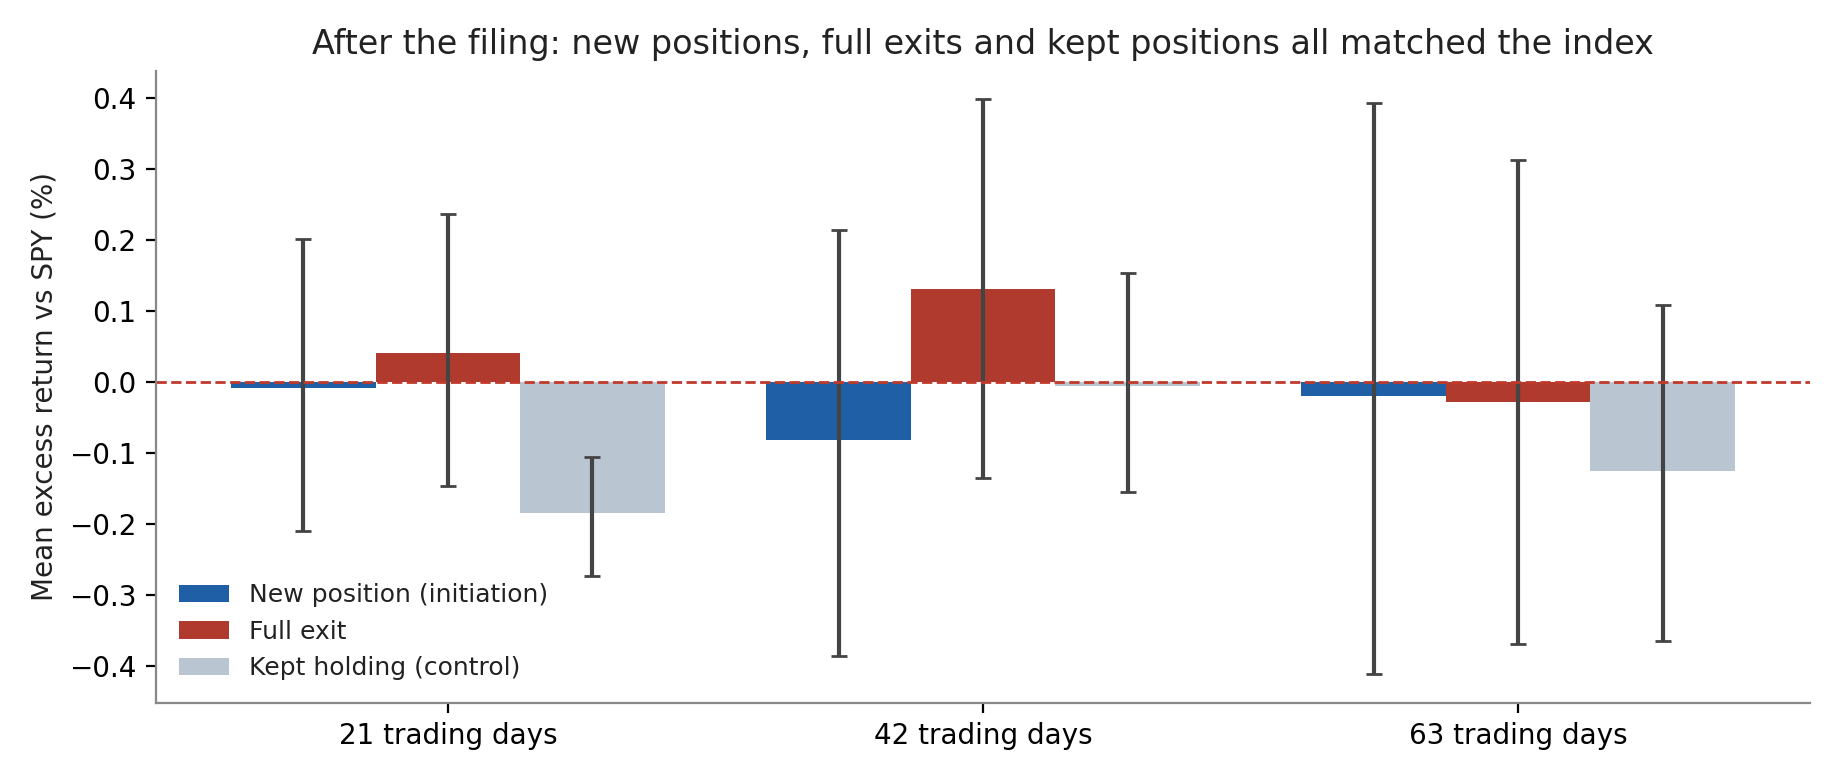
| Group | 21 days | 42 days | 63 days | Median (63d) | Beat SPY (63d) |
|---|---|---|---|---|---|
| New position (n = 23,809) | 0.0% [−0.2, +0.2] | −0.1% [−0.4, +0.2] | 0.0% [−0.4, +0.4] | −0.8% | 47.3% |
| Full exit (n = 21,113) | 0.0% [−0.1, +0.2] | +0.1% [−0.2, +0.4] | 0.0% [−0.4, +0.3] | −1.0% | 46.8% |
| Kept holding (n = 188,101) | −0.2% [−0.3, −0.1] | 0.0% [−0.2, +0.1] | −0.1% [−0.4, +0.1] | −0.8% | 47.1% |
Means are points of excess return versus SPY; brackets are 95% ticker-cluster bootstrap intervals. The initiation-minus-hold difference at 63 days is +0.1 points with an interval of −0.2 to +0.5; exit-minus-hold is +0.1 points, −0.2 to +0.4. In absolute terms the average scored initiation returned +3.5% over its 63 days while SPY returned +3.6% over the same windows.
Notice what the medians say alongside the means. The typical event in all three groups trailed the index by about a point — these funds hold a universe tilted away from the mega-caps that carried SPY for much of the decade, and the typical stock in that universe lagged. The means sit at zero only because initiation and exit returns have fatter right tails than holds (average winning initiation +14.7%, average loser −13.2%, versus +12.1% and −11.1% for holds): new positions are higher-variance bets, not better ones. Trim the top and bottom 1% of outcomes and both change groups tip slightly negative (−0.4 points for initiations, −0.5 for exits). A signal whose average is zero, whose median is negative, and whose sign depends on the fattest 1% of outcomes is not a signal a reader can spend.
Two funds buying the same stock changed nothing
The strongest version of the coattail idea is crowd confirmation — several smart-money funds opening the same position in the same quarter. It does not separate in the data. Initiations by a single fund averaged +0.1 points at 63 days (n = 12,218; CI −0.3 to +0.5); initiations where two or more tracked funds opened the same stock in the same quarter averaged −0.1 points (n = 11,591; CI −0.8 to +0.6). The multi-minus-solo difference interval runs from −1.0 to +0.5 points. Whatever the second fund knew, the stock did not pay for it after the filings landed.
The gap was real — and it closed before the filing
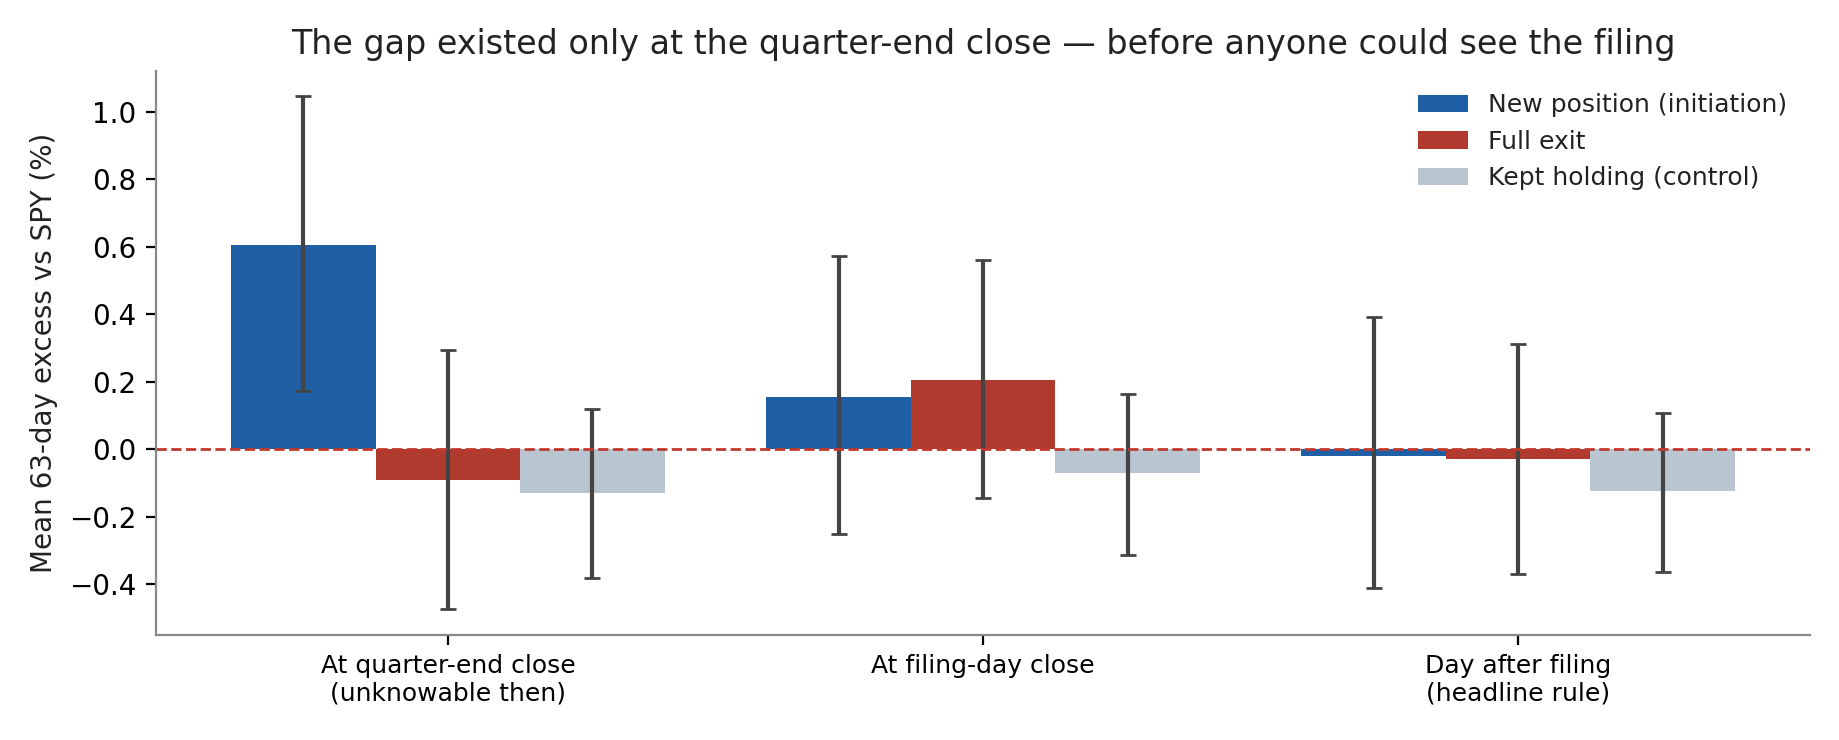
Run the same events with an impossible clock — buy at the close of the quarter-end, the day the position snapshot was taken, weeks before the filing was public — and initiations beat the index by +0.6 points (n = 24,701; CI +0.2 to +1.1), while exits and holds stay at zero. Move the entry to the filing day's close and the initiation edge is already down to +0.2 points (CI −0.2 to +0.5); a day later it is 0.0. We report the quarter-end figure because it locates the effect honestly: to the extent these purchases were followed by strength, the strength arrived during the quarter itself and the 45-day disclosure lag — while the funds were buying, and before any reader could see the position. A 13F is a rear-view mirror with a six-week delay, and the part of the move visible in the mirror is the part that already happened.
The recent window leans the other way — read it carefully
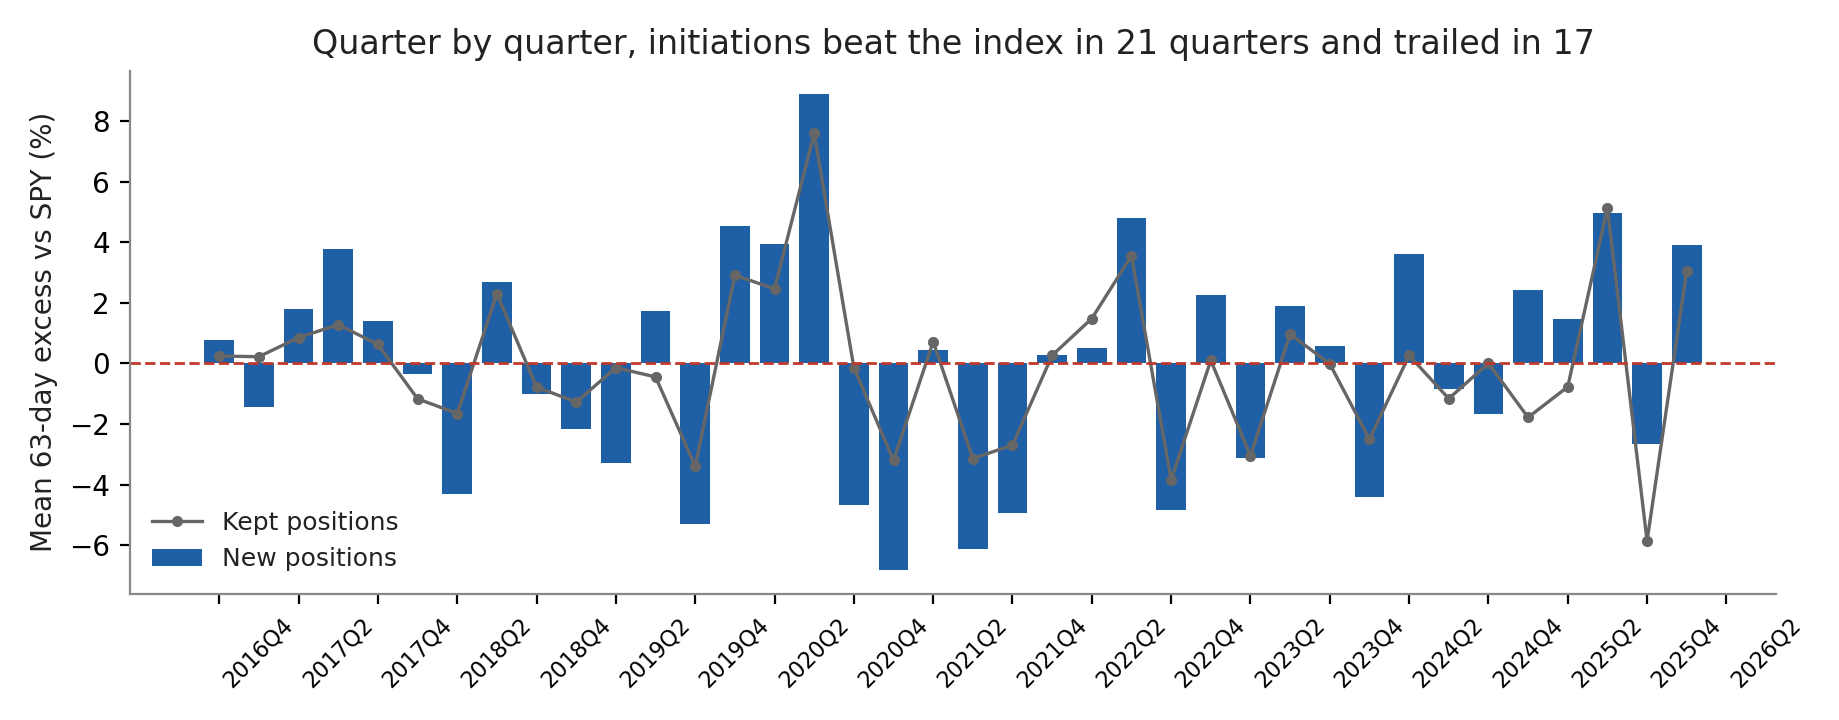
One cut of the data does lean positive, and we would rather show it than bury it. Restricting to event quarters from 2023Q3 onward — the window where the tracked roster was already essentially in place, which is also the standard answer to the selection problem described below — initiations averaged +0.9 points at 63 days (n = 7,025; CI +0.1 to +1.7), and the initiation-minus-hold difference interval is +0.44 to +1.82 points, excluding zero. Three cautions before anyone spends that number. First, the same window flatters exits too: stocks funds sold out of beat their kept positions by a similar margin (difference interval +0.01 to +1.28 points) — two opposite signals cannot both be information, so the late-window pattern is more likely a property of the period (churn beat stillness in 2023–2026) than of initiations. Second, the split is unstable across the decade: in event quarters through 2021Q2 the initiation-minus-hold interval is −0.86 to +0.12 — the sign of the gap flips between the first and second halves of the sample. Third, even in the recent window the median initiation trailed the index (−0.9 points, win rate 46.8%); the positive mean is carried by the right tail. This is one favourable cell among the many cuts in this study, and we report it as exactly that.
Three events that frame the range
The best scored initiation shows what the right tail is made of. Polen Capital's new position in AXT Inc, revealed in its filing of February 12, 2026, was followed by a +410.6% run over 63 trading days — +402.2 points of excess while SPY gained 8.4%. It was a solo initiation; no other tracked fund opened the name that quarter. The worst initiation and the best-timed exit are the same stock in the same quarter: TAL Education in early 2021. Three tracked funds, Coatue among them, initiated TAL in the quarter whose filings landed in mid-May 2021; the stock then lost 89.1% in 63 trading days as China's tutoring crackdown landed (−96.7 points of excess). Maverick Capital's full exit, filed May 17, 2021, preceded the same collapse (−96.6 points) — one quarter's filings contained both the buyers and the seller of a stock about to fall nine-tenths, and the disclosure clock made both of them history by the time anyone could read them. The typical event is neither: the median initiation is Mairs & Power's new position in the IWF growth ETF, filed February 14, 2025, which trailed SPY by 0.8 points over the next 63 days.
What this does not show
Start with the cohort itself. The 147 funds tested are the funds this site tracks now: the roster was assembled in October 2026 and screened for, among other things, having filed in at least seven of the last eight quarters. Every fund in the test was therefore still filing in 2026; managers who ran money in 2017 and shut down, merged, or stopped filing before the screen are absent, and their initiations — plausibly worse, on average — are not in these numbers. The results are conditional on survival to 2026, and the recent-window cut above is the partial mitigation, not a cure. Second, a fund is its filing here: when a manager reorganises and reports under a new CIK, the panel reads a mass exit and a mass initiation where nothing economic happened; share-class switches (one class of a stock swapped for another) likewise print as an exit plus an initiation. The same artifact appears in three fund-quarters where the latest amendment's information table lists only option rows — Maverick Capital's 2022Q1 is the largest — so the fund's long book prints as an exit one quarter and a re-entry the next; excluding every transition touching those three fund-quarters moves the 63-day means by at most 0.02 points and changes no verdict. Third, 13F shows long positions only — an initiation can be one leg of a hedge we cannot see, and a fund can be economically short the same name through instruments that never appear. Fourth, the priced subset is not the universe: it leans to listed, priceable names, and the dropout rates differ by group, so the three groups are close cousins, not identical twins. None of these caveats manufactures a hidden edge in the full sample — the difference intervals are centred on zero with room to spare — but they bound what "no drift" means: no drift, after disclosure, for the surviving cohort's priceable long positions.
How to read a 13F on this site
Treat the "new position" flag on a fund page as a research prompt, not a result. The useful questions a fresh 13F can answer are about the fund, not the stock's next quarter: is this position sized like conviction (a top-ten weight) or like a toe in the water, does it fit what the manager has owned before, and did several funds move the same way for an identifiable common reason? Our fund pages show each manager's initiations and exits quarter by quarter with the filing date attached, so the lag is visible rather than hidden — start from any tracked fund's page, and if you use a new position as a watchlist candidate, the honest prior from a decade of data is that its post-disclosure drift, on average, is the market's.
Methodology and data
Population: SEC Form 13F Data Sets quarterly files as assembled in this site's full-market backfill (2016Q3–2026Q2, 40 quarters). For each quarter, the filing used per manager is the backfill's chosen filing — the latest non-notice 13F-HR or 13F-HR/A per CIK for that report period; 2.8% of fund-quarters resolve to an amendment, whose filing date is then the event's disclosure date. Cohort: the 147 roster funds with a CIK (of 149 tracked; the roster was selected in October 2026 on filing persistence over the trailing eight quarters, portfolio size, concentration and turnover screens — see the survivorship discussion above). Holdings are long common-stock rows only (SSHPRNAMTTYPE = SH, no put/call flag, shares > 0), aggregated by CUSIP; options and principal-amount rows never establish a position. Events compare adjacent quarters for funds filing in both: initiation = held this quarter, not held last; full exit = held last, not held this; re-entry after an exit is a new initiation. Unclassifiable transitions (fund absent either quarter) number 1,658 positions and are excluded, never counted as exits. CUSIP-to-ticker mapping uses the pipeline CUSIP map plus the same quarter's backfill by-CUSIP file (97.5% position-presence agreement with this site's live EDGAR collection for 2026Q2; residual disagreement concentrates in three multi-entity filers and one fund whose live snapshot is a quarter newer). Scoring: entry at the close of the first trading day after the fund's filing date (an entry landing more than 10 calendar days after its intended date is not scored), exit 21/42/63 trading days later on the stock's own calendar, SPY measured over the same dates. Prices are unadjusted closes with dividends not reinvested, for stocks and SPY alike (SPY returned +285.0% on this basis from January 2016 to October 2026, versus +357.8% dividend-adjusted; the convention depresses both sides of the excess). The early price history (2016–2022) and the site's standard five-year history agree to four decimal places on overlap returns for sampled tickers. Inference: means with 95% intervals from a ticker-cluster bootstrap (2,000 resamples); differences resample ticker clusters jointly across groups. Win rate = share of events with positive excess return. Classified events: 40,323 initiations, 39,893 exits, 272,408 holds; priced at 63 days: 23,809 (59.0%), 21,113 (52.9%) and 188,101 (69.1%) respectively. The scored initiation and exit list — every event behind the change-group numbers — accompanies this article: scored_13f_initiation_events.csv (80,216 events). This analysis is for information only and is not investment advice. Past filing patterns do not predict future returns. Figures exclude transaction costs, taxes and market-impact costs.
Revision history
- v1.0 — October 17, 2026: first publication. Panel covering report periods 2016Q3–2026Q2; prices through October 8, 2026.