Item 4.02 of Form 8-K covers two routes to the same announcement: under paragraph (a), the board, a board committee or an authorized officer concludes that previously issued financial statements should no longer be relied upon because of an error; under paragraph (b), the company's independent accountant advises that action is needed to prevent future reliance on its audit report or a completed interim review (SEC, Form 8-K, Item 4.02). Either way, the filing starts a restatement, and the stock usually pays for it — in this sample the priced filings trailed the S&P 500 by 2.5 points in the five sessions from the filing day's close, and the median filing was still 8.3 points behind after a quarter. The question of this study is the one we asked about leadership changes and about material news in the earlier parts of this series: in the weeks before the warning became public, did the people inside sell?
What we measured
This event does not live in our usual index. The 8-K event index behind this site covers the companies in its tracked universe, and only 20 Item 4.02 filings in the test window sit inside it — most non-reliance filings come from smaller issuers outside that universe. So we harvested the events from EDGAR's full-text search instead: two queries over all 8-K filings from April 1, 2025 to October 13, 2026, keeping filings whose item tags include 4.02 — 178 filings from 152 companies (all 20 index filings are inside this set; we verified the overlap filing by filing). We then dropped 35 filings whose issuer never appears in our parsed Form 4 corpus — a pre-filing window we cannot measure is not a window with no selling — and 14 that repeated an earlier filing by the same company within 90 days, leaving 129 events at 121 companies. For each, we counted insider sales in the 30, 60 and 90 days before the filing date: Form 4 open-market sales (transaction code S, non-derivative), the subset of those filed by officers and directors, and Form 144 sale notices. The baseline is the same measurement in 20 randomly drawn windows at the same company, at least 120 days away from any of that company's real 4.02 filings — 2,580 placebo windows in total, every event filled. Day zero is the filing date, the day the information became public; nothing is sorted by the period the filing describes. This is a small sample next to the earlier studies in this series — 129 events, against 3,189 leadership-change filings and 2,100 material-event filings — and every interval below should be read with that in mind.
- In the 90 days before a 4.02 filing, insiders sold in 21.7% of events; in the same companies' ordinary windows, 23.3%. Ratio 0.933 (95% CI 0.670–1.252).
- Officers and directors specifically: 14.7% vs 19.3% — ratio 0.765 (CI 0.507–1.045). In the final 30 days: 6.2% vs 10.5%, ratio 0.593 (CI 0.263–0.914).
- Form 144 sale notices: 5.4% vs 5.2% at 90 days, ratio 1.037 (CI 0.536–1.702) — notices are rare at these small issuers, and the interval is correspondingly wide.
- The aftermath was bad with or without prior selling: the priced filings averaged −2.5 points versus SPY in five sessions and −4.9 points at 21 trading days; at 63 days the mean was +1.0 points but the median filing trailed by 8.3 points and only 34.7% beat the index.
The headline: no bunching before the warning
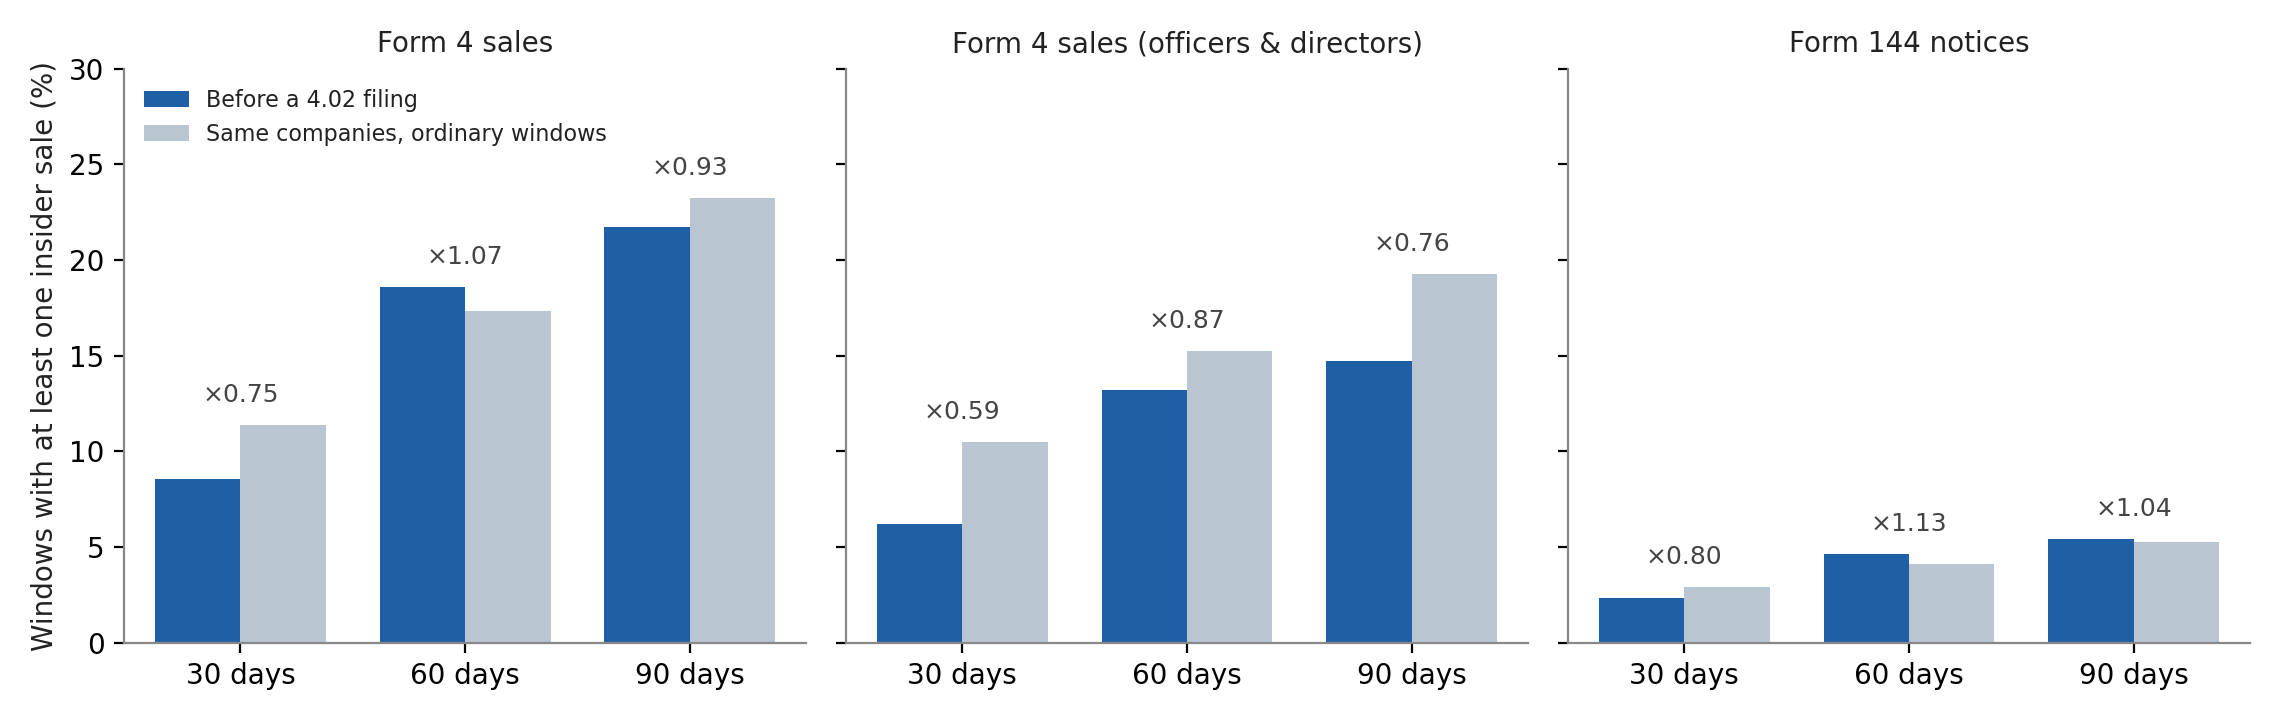
| Window | Measure | Before a 4.02 filing | Ordinary windows | Ratio | 95% CI |
|---|---|---|---|---|---|
| 30 days | Form 4 sales, all insiders | 8.5% | 11.4% | 0.748 | 0.391–1.154 |
| 30 days | Form 4 sales, officers & directors | 6.2% | 10.5% | 0.593 | 0.263–0.914 |
| 30 days | Form 144 notices | 2.3% | 2.9% | 0.800 | 0.000–1.500 |
| 60 days | Form 4 sales, all insiders | 18.6% | 17.3% | 1.074 | 0.736–1.481 |
| 60 days | Form 4 sales, officers & directors | 13.2% | 15.2% | 0.865 | 0.559–1.210 |
| 60 days | Form 144 notices | 4.7% | 4.1% | 1.132 | 0.526–2.069 |
| 90 days | Form 4 sales, all insiders | 21.7% | 23.3% | 0.933 | 0.670–1.252 |
| 90 days | Form 4 sales, officers & directors | 14.7% | 19.3% | 0.765 | 0.507–1.045 |
| 90 days | Form 144 notices | 5.4% | 5.2% | 1.037 | 0.536–1.702 |
| 90 days | Either form | 21.7% | 24.1% | 0.902 | 0.655–1.196 |
Counts tell the same story: the average number of Form 4 sales per 90-day window was 1.66 before a filing against 2.40 in ordinary windows (ratio 0.690, CI 0.295–1.436), and where selling did occur, the median window's volume was smaller before a filing than in ordinary windows — 32,470 shares against 47,743. Nothing in the level, the frequency or the size of pre-filing selling sits above baseline.
Because the sample is small, the honest statement is a bounded one. At 90 days, the intervals rule out a relative elevation in the share of windows with selling larger than about +25% for insiders overall — and only about +5% for officers and directors, whose interval tops out at 1.045. Those bounds are far looser than the roughly ±5% we could state for leadership-change filings, where the sample was 3,189 events. A modest pre-selling tendency at the all-insider level is not excluded by this data; an officer-and-director tendency of any size is close to excluded, and the point estimates lean the other way.
The people closest to it sold less, especially at the end
The officer-and-director slice is where informed selling would have to live — a restatement is prepared by the finance function and the audit committee, not by a 10% holder across the country. That slice runs below baseline at every window length, and the deficit is deepest exactly where the hypothesis wants a spike: in the last 30 days before disclosure, officers and directors sold in 6.2% of events against 10.5% of ordinary windows (ratio 0.593, interval 0.263–0.914 — the only headline interval that excludes 1.0, and it excludes it downward). Read plainly, that is the signature of a trading freeze, not of an exit: once a non-reliance conclusion is being prepared, the people who know are the people who cannot trade, and the data are consistent with the freeze binding. We flag the obvious caution ourselves — across the dozens of cells in this study, one interval excluding 1.0 is not, on its own, proof of anything — but the direction of the single exception matters: the exception points against pre-selling, not for it.
No approach gradient either
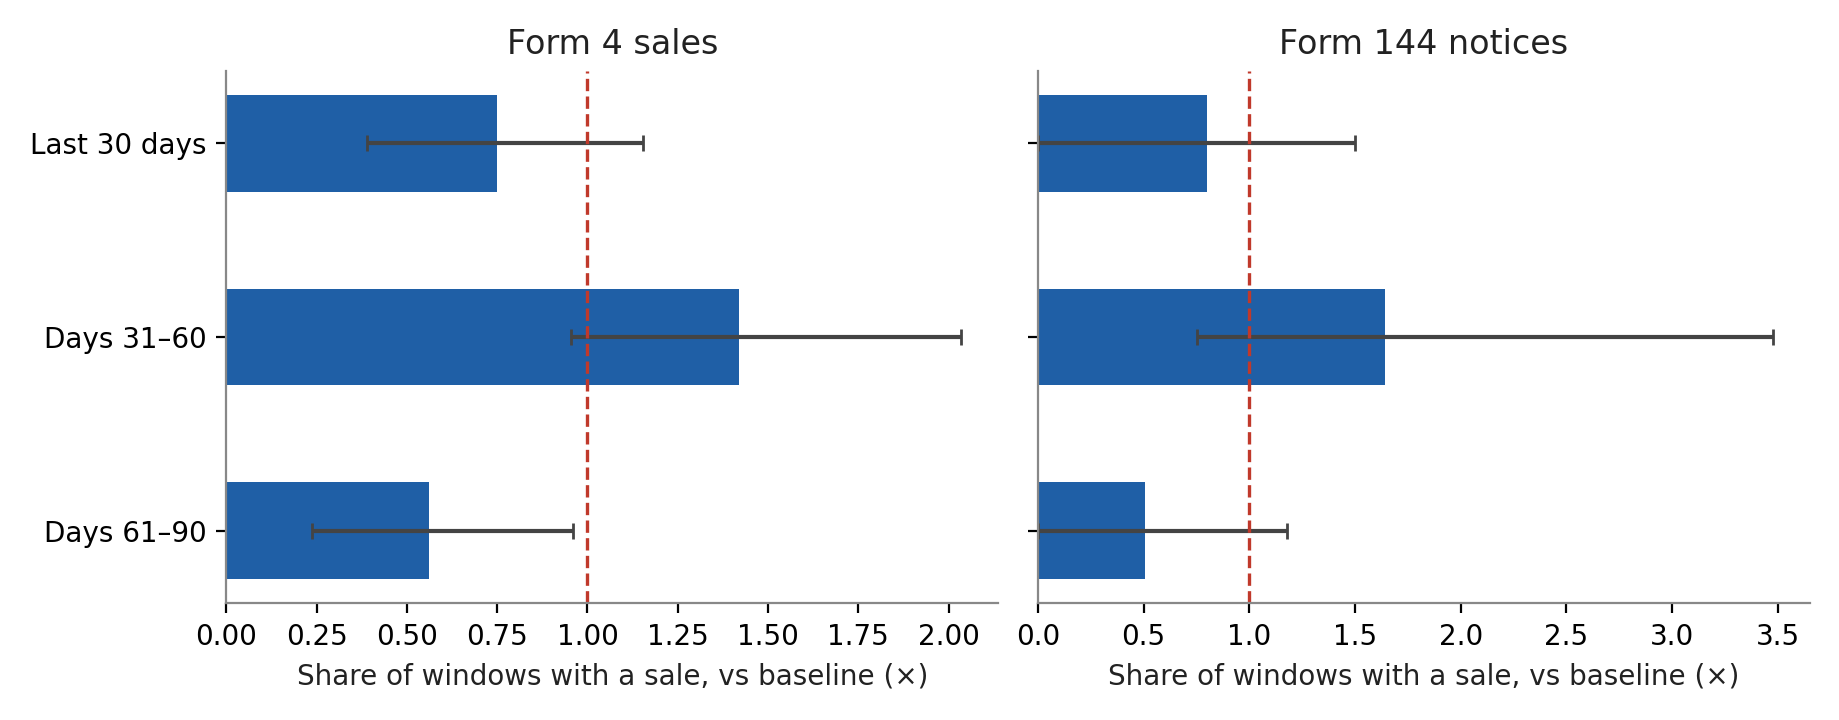
Splitting the 90 days into distance bands gives the same zigzag this series found before leadership filings: the last 30 days at ×0.748, days 31–60 at ×1.419 (CI 0.956–2.035), days 61–90 at ×0.562 (CI 0.237–0.960). A real information gradient would rise monotonically toward the filing; instead the middle band leans up, the far band leans down, and the nearest band leans down. That is what no pattern looks like when you slice 129 events three ways.
The aftermath: the filing itself was the bad news
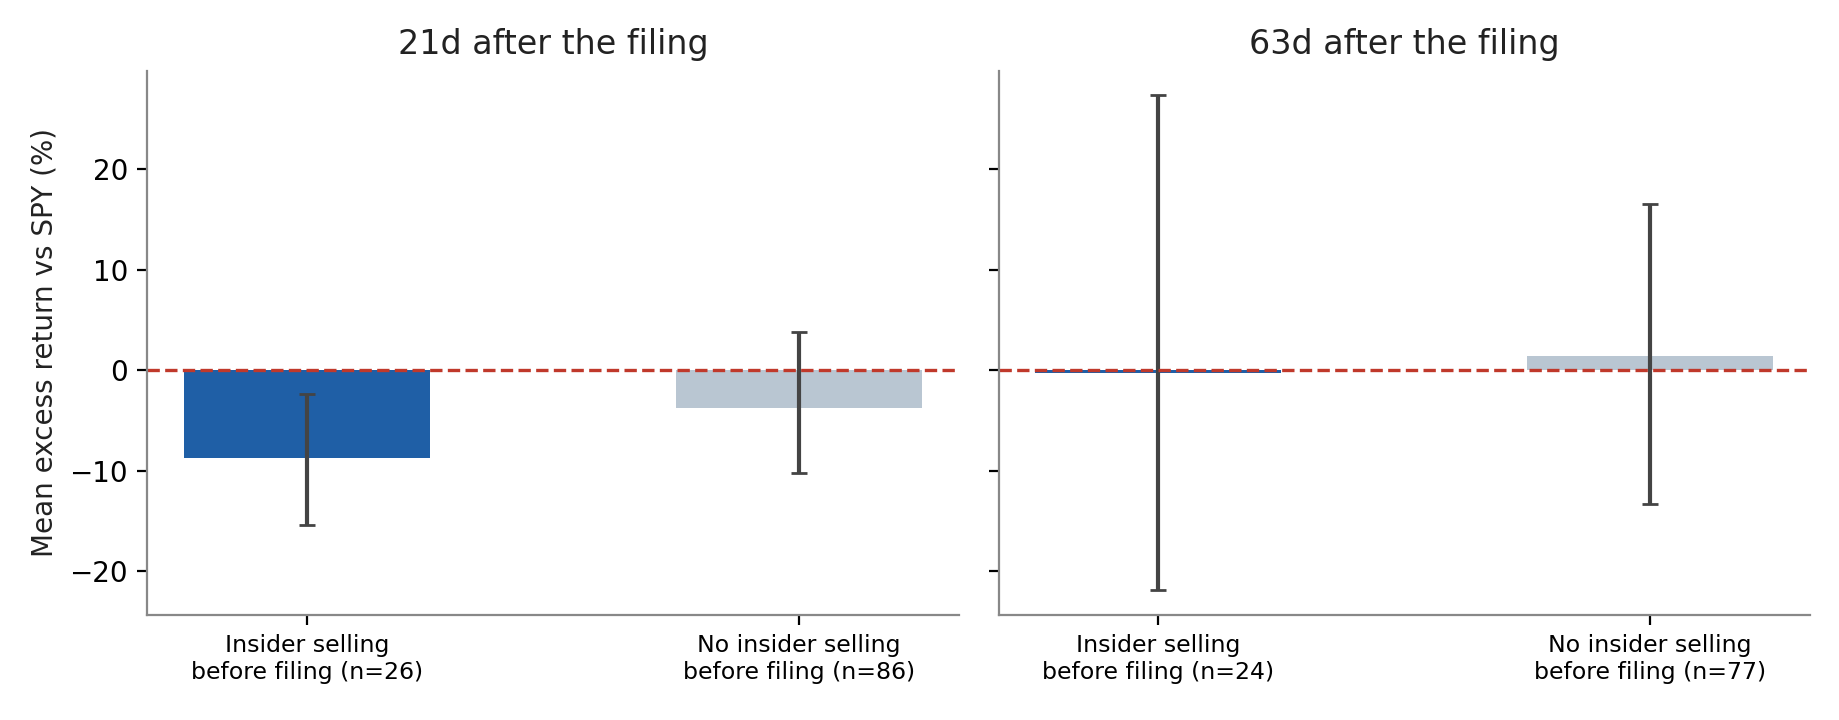
A non-reliance filing is not a neutral event that insiders front-run; it is itself the loss. From the filing day's close, the priced filings trailed SPY by 2.5 points in five sessions (median −2.7, win rate 36.6%, n = 112); at 21 trading days the average was −4.9 points and the median −6.0. At 63 trading days the mean recovered to +1.0 points on a few large rebounds, but the median filing still trailed by 8.3 points and only about a third beat the index. Whether insiders had sold beforehand did not separate the outcomes in any readable way: at 21 days the pre-sold group averaged −8.7% against −3.7% for the rest, a difference whose interval (−14.0 to +3.9 points) includes zero; at 63 days the groups averaged −0.3% and +1.4% with an interval so wide (−29.3 to +31.2 points, on 24 pre-sold events) that we report it as uninformative rather than as evidence either way. Rank correlation between how much insiders sold beforehand and what the stock did next: ρ = +0.05. The damage was in the disclosure, and it fell on whoever held the stock, sellers-beforehand or not.
Cases, chosen by the numbers
The largest single pre-filing sale in the sample was not by an officer or director: before EON Resources' filing on April 15, 2025, one non-management holder sold 1,071,897 shares; the stock then trailed SPY by 46.0 points over 63 trading days. The heaviest selling cadence points the other way — Monolithic Power Systems recorded 87 officer-and-director sales in the 90 days before its February 27, 2026 filing, the steady drip of a large company's routine plans, and the stock beat SPY by 24.5 points over the following quarter. The worst post-filing slide after genuine pre-selling was ScanTech AI (filing November 3, 2025): four sales totaling 383,628 shares beforehand, then −86.0 points of excess return. And the worst five-day reaction in the sample, Compass Diversified's −58.5 points in May 2025, followed a filing preceded by no insider selling at all. Individual cases run in every direction; the averages are the finding.
The one cell that leans the other way
We report this because hiding it would be worse. Restricting to the 16 events whose filing explicitly cites paragraph 4.02(a) in its text, the 90-day Form 4 ratio is 2.069, with an interval (1.121–4.091) that excludes 1.0. Three cautions, all of which we think disqualify it as a finding: the subset is tiny; it is selected on drafting style, not on the event — only 23 of the 178 filings cite a subparagraph at all, so "(a)-citers" are companies whose counsel writes a particular way, not a clean class of events; and the officer-and-director slice of the same cell (ratio 1.667, CI 0.741–3.077) includes 1.0, as do all nine other subset cuts we ran (earnings-bundled, standalone, index-overlap and the rest — every one includes 1.0). It is one cell among many, flagged here so a future, larger sample can settle it.
What this does not show
This is 129 events from one 18-month window — the years our Form 4 corpus covers — and the bounds in the headline section are the price of that: a small all-insider elevation (up to roughly +25% relative) would not have been visible. The test is at the issuer level: it cannot attribute selling to any individual, and a single departing finance chief selling into a pending restatement would be diluted inside these averages — though the officer-and-director slice, which shows a deficit rather than an excess, is the slice where such selling would concentrate. We could not split paragraph (a) from paragraph (b) events: only 23 of 178 filings cite a subparagraph, so the two legal routes are pooled here. And the return figures describe the priced subset — 101 of 129 events at 63 days; issuers that were delisted before we could price them are absent, which if anything flatters the aftermath numbers. What the data do support is narrower: across every Item 4.02 filing we could measure in 2025–2026, insider selling in the prior 90 days ran at or below the same companies' ordinary rate — and for officers and directors, clearly below it in the final month.
Methodology and data
Population: all Form 8-K and 8-K/A filings returned by two EDGAR full-text searches (the item's caption phrase, plus a recall query for the operative "should no longer be relied upon" language) with filing dates April 1, 2025 – October 13, 2026, keeping filings whose EDGAR item list includes 4.02: 178 filings, 152 issuers. Events are the filings whose issuer appears at least once in our parsed Form 4 corpus (35 dropped as unmeasurable), deduplicated so no issuer contributes two events within 90 days (14 dropped): 129 events, 121 issuers. Day zero is the EDGAR filing date. Selling: Form 4 non-derivative transactions with code S and disposition D, matched by issuer CIK, counted in the 30/60/90 calendar days strictly before the filing date; the officer-and-director subset keeps filings where the owner is flagged director or officer. Form 144 notices are counted by filing date in the same windows; the officer-and-director notice subset classifies by the relationship text on the notice. Baseline: for each event, 20 pseudo-filing dates drawn from the same test window at the same issuer, excluding ±120 days around any of that issuer's actual 4.02 filings (2,580 windows; every event reached 20 — these filings are rare enough that the exclusion rarely binds). Inference: ratios of shares and of mean counts with 95% intervals from an issuer-cluster bootstrap (2,000 resamples); a deterministic cross-check with fixed −364/+182-day offsets (126 eligible windows) put all four headline ratios (1.189, 0.844, 1.140, 1.094) inside the randomized baselines' intervals. Returns: entry at the close of the first trading day after the filing date (the reaction measure uses the filing day's own close and requires the filing date to be a trading day), horizons of 5, 21 and 63 trading days on the stock's own calendar against SPY over the same dates; tickers are the issuer's primary ticker per SEC submissions data. Prices are this site's standard history where it reaches (14 of the scored events) and, for the remaining scored events, a same-source extension of daily Yahoo chart closes harvested for this study (87 of 101 events at 63 days; 98 of 112 at 21 days) — the two are never mixed within an event, and each event's price source is recorded in the published dataset. Form 4 coverage is effectively 2025–2026, which is why the test window starts April 1, 2025: earlier filings would have unmeasurable 90-day pre-windows. The scored event list — every event behind every number above — accompanies this article: scored_events_8k_402.csv (129 events). This analysis is for information only and is not investment advice. Past filing patterns do not predict future returns. Figures exclude transaction costs, taxes and market-impact costs, which are material for the smaller names that dominate this sample.
Revision history
- v1.0 — October 16, 2026: first publication. EDGAR full-text harvest of Item 4.02 filings, April 1, 2025 – October 13, 2026; prices through October 2, 2026 (site history) and October 15, 2026 (extension).