Item 5.02 of Form 8-K is where corporate leadership changes become public: a director or principal officer departs, is removed, resigns, or a new one is appointed. The form is due within four business days of the event, which means there is always a short corridor — the days between the boardroom decision and the public filing, and the weeks of negotiation before that — during which the people closest to the decision know something the market does not. The obvious suspicion writes itself: some of them sell. Not necessarily the departing executive, whose exit might be involuntary; anyone in the know could trim a position while the news is still private. If that happened at any scale, the filings themselves would carry a fingerprint — an abnormal concentration of insider selling in the run-up to the disclosure, heavier than the same companies produce in a normal quarter. We went looking for the fingerprint in every Item 5.02 filing we could fully measure.
What we measured
Our 8-K index covers 12,101 filings containing Item 5.02 between January 2023 and October 2026. The test itself is restricted to filings from April 1, 2025 through October 13, 2026 — the window in which the 90 days before each filing sit fully inside our Form 4 corpus — and drops repeat filings by the same company within 90 days of a kept event, leaving 3,189 leadership-change events at 1,329 companies. For each event we counted, over the 30, 60 and 90 days before the filing date (never the internal event date, which the public could not have known), two things: Form 4 sale transactions by that company's insiders, dated by transaction date, and Form 144 notices of intent to sell, dated by filing date. Matching is by issuer CIK throughout — no name matching anywhere.
The comparison is the part that matters. Insiders at these companies sell constantly, mostly on schedule, so a raw count of pre-filing sales proves nothing by itself. For every event we drew up to 20 placebo windows for the same company — pseudo-filing dates drawn from the same period, excluding anything within 120 days of a real 5.02 filing — and measured them identically (40,283 placebo windows in all). The question is never "was there selling?" but "was there more than this company usually produces?" Intervals throughout are company-cluster bootstraps, because events cluster heavily within companies.
The 90 days before: a baseline match
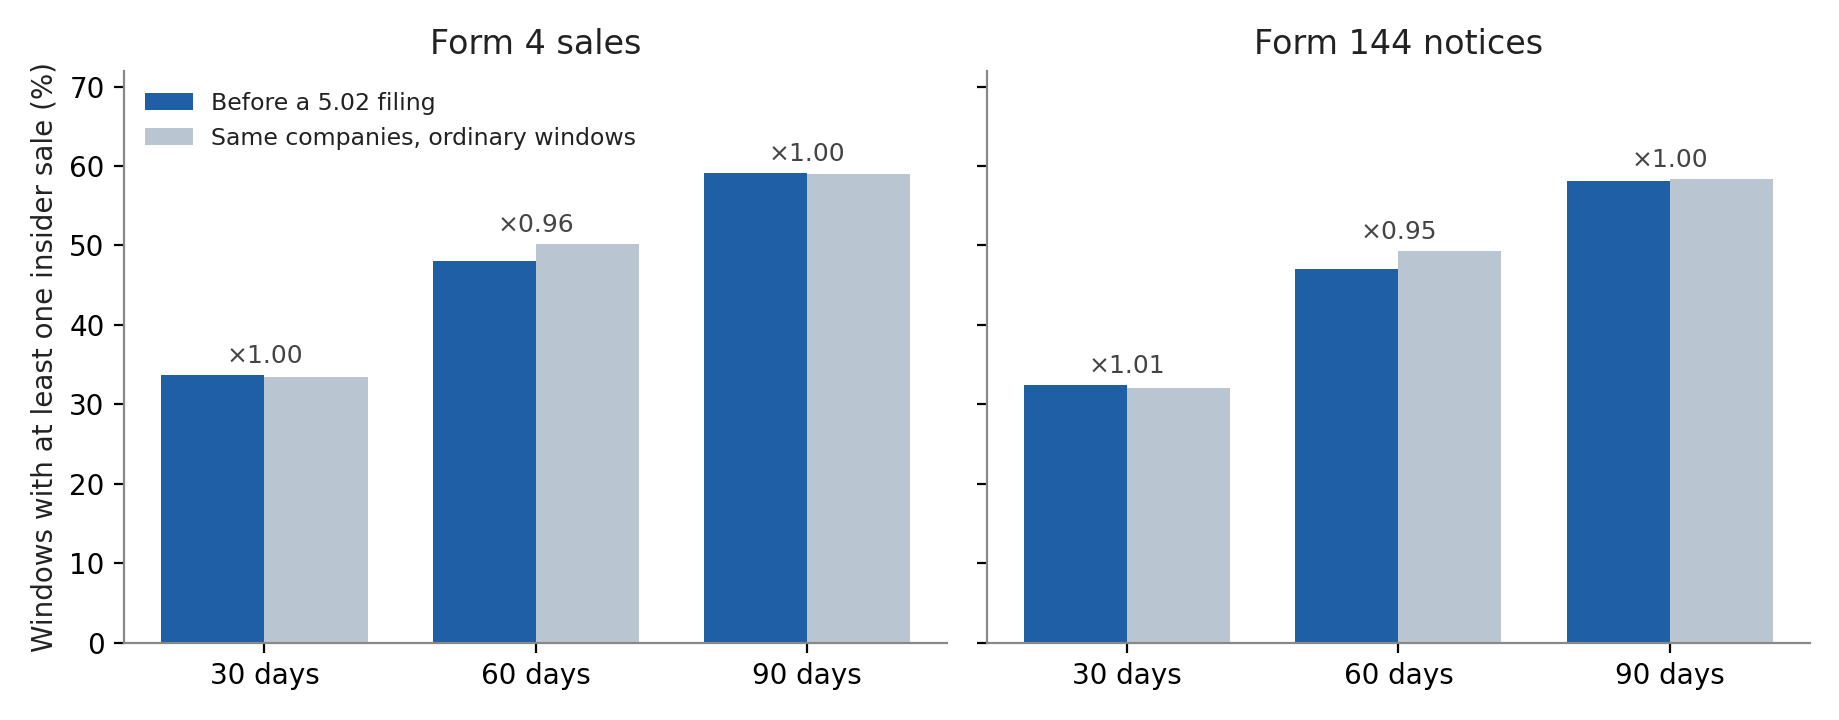
There was selling before these filings, in quantity — 24,431 Form 4 sale transactions and 9,820 Form 144 notices fall inside the 90-day pre-filing windows. It is simply the quantity these companies always produce. In the 90 days before a 5.02 filing, 59.1% of events had at least one insider Form 4 sale, versus 59.0% of placebo windows — a ratio of 1.002, with a 95% interval of 0.959 to 1.048. Form 144 notices: 58.2% versus 58.3%, ratio 0.998 (0.954–1.042). Either measure combined: 62.7% versus 62.7%. At 30 and 60 days the ratios are the same story (1.005 and 0.957 for Form 4; 1.009 and 0.954 for Form 144 — every interval includes 1). Counting transactions instead of windows, insiders actually sold slightly less often than baseline before filings: 7.66 sales per 90-day window against 9.04 in placebo windows, a ratio of 0.85 whose wide interval (0.64–1.11) reflects how heavily a few companies dominate the counts. Restricting Form 144 notices to those filed by officers and directors — the people closest to a leadership decision — changes nothing: 56.5% versus 56.6%.
The intervals do more than fail to find an effect; they bound one. At the 90-day horizon, a relative elevation in the share of pre-filing windows with selling larger than about 5% is outside the 95% interval for both measures. Whatever pre-announcement selling happens ahead of leadership changes, at the level of "did insiders sell at all in the prior quarter," it is smaller than that.
Closer to the filing does not mean heavier
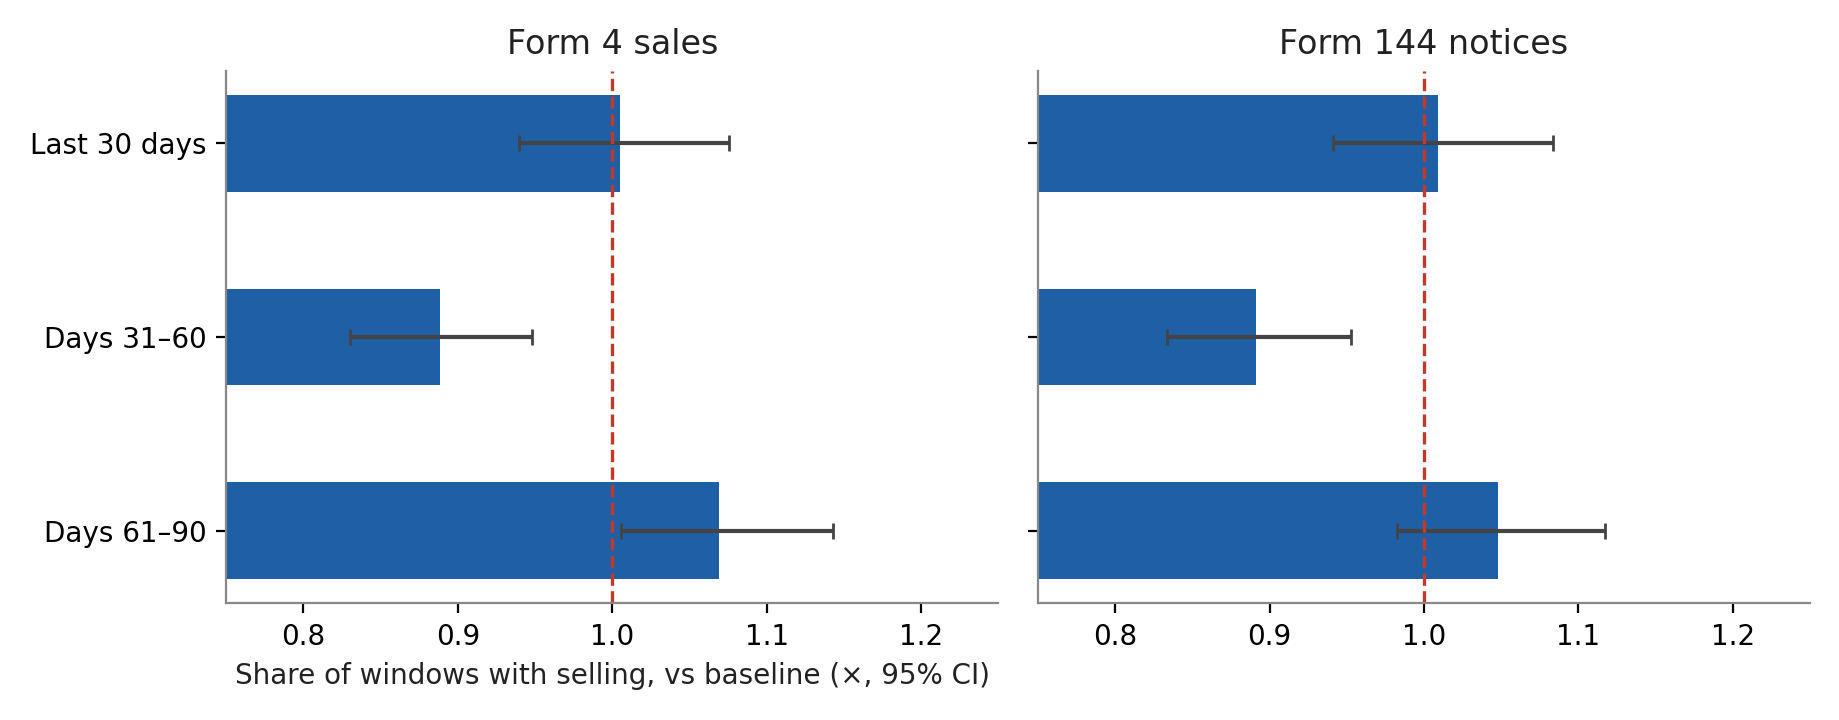
If informed selling drove the numbers, it should intensify as the announcement approaches — the final month, when the decision is most concrete, should be the hottest. Split the 90 days into three bands and the profile zigzags instead. The last 30 days sit exactly on baseline for both measures (ratios 1.005 and 1.009). The middle band, days 31–60, runs below baseline (0.889 for Form 4, 0.891 for Form 144), and the far band, days 61–90, runs slightly above (1.069 and 1.048). Two of the six band intervals exclude 1, in opposite directions — the pattern multiple comparisons produce on their own, and the opposite of a gradient rising toward disclosure. Volume tells the same two-part story. The typical selling window is identical in size: among windows with any sale, the median Form 4 volume is 32,694 shares before filings and 32,758 in placebo windows. Mean volume points higher before filings (a ratio of 1.61), but its interval runs from 0.92 to 2.99 — it is carried by a handful of sponsor-scale blocks and excludes nothing.
The single largest case shows what those blocks look like. Before Primo Brands' 5.02 filing on May 21, 2025, insiders sold 204.8 million shares across four Form 4 transactions in 90 days, and the stock then trailed SPY by 31.6% over the following quarter. It is a striking sequence — and it is one event in 3,189, of the size a large holder's exit program produces, in a test whose averages say the sequence is not systematic.
After the filing: pre-selling predicts nothing
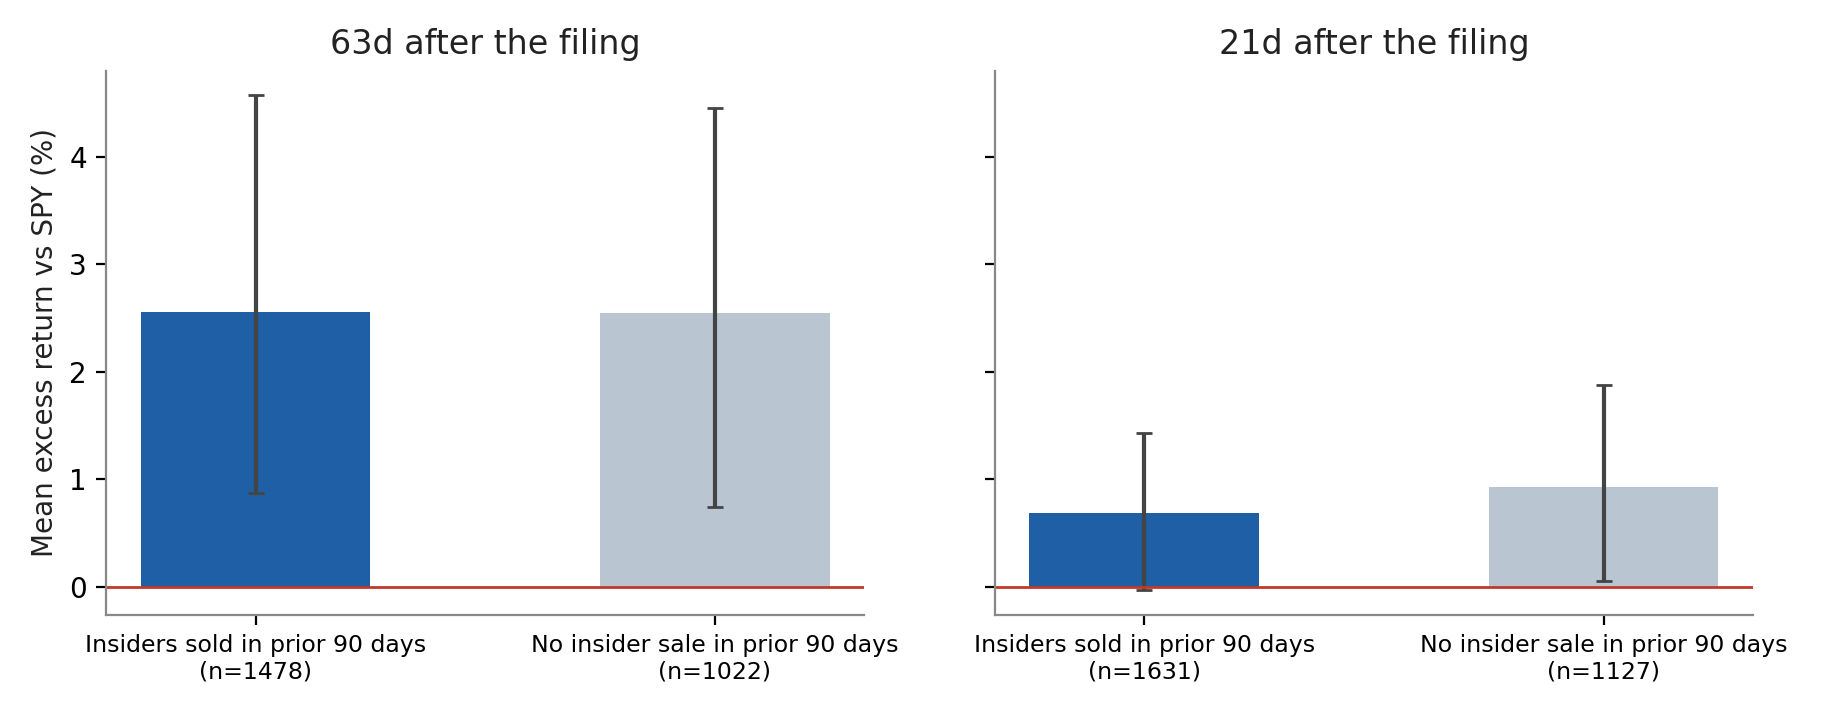
Suppose the pre-filing selling were informed anyway; the stocks should then sag after the announcement, relative to filings with no pre-selling. They do not. Across the 2,500 events with a full quarter of prices after filing, the average 63-trading-day excess return versus SPY is +2.55% — but the median event lags by 1.58% and only 46.8% beat SPY, so the positive mean is a minority of large gainers, a shape readers of our earlier studies will recognize. Split by pre-filing selling, the two groups are indistinguishable: events preceded by insider selling averaged +2.56% (95% CI: +0.87 to +4.57%), events preceded by none averaged +2.55% (+0.74 to +4.46%), and the interval for the difference runs from −2.52 to +2.67 percentage points. Rank pre-filing volume against the subsequent return directly and the correlation is ρ = −0.014 across 2,500 events. At 21 days, and entering at the filing day's close instead of the next, the split is equally flat.
Does the result hold up?
We re-ran the headline test on the filings least likely to hide an effect. Excluding the 179 events bundled with an earnings item (2.02) — where pre-filing selling might belong to the earnings news instead — leaves 3,010 events and ratios of 0.997 (Form 4) and 0.999 (Form 144). Filings carrying essentially only the 5.02 item (2,330 events) give 0.994 and 0.993. Rebuilding the baseline without any randomness — fixed placebo anchors a year before and half a year after each filing, 855 eligible windows — gives ratios of 1.025 and 1.030: a few percent above the random-placebo figures, on a much thinner baseline, and still a "no concentration" answer. Our verification pass also rebuilt every pre-filing count from the raw Form 4 filings rather than the analysis index: all 3,189 events matched, cell for cell.
The strongest objections
Four, and they bound what this study can claim. First and largest: Item 5.02 mixes departures and appointments, and our index records item codes, not the underlying text, so we cannot separate a CEO's exit from a new director's arrival. This study measures leadership-change filings as a class. If pre-selling concentrated only around departures — the subset where someone is leaving with private knowledge of why — appointments would dilute it toward baseline. The dilution would have to be severe to hide a large effect (the intervals bound the combined elevation under ~5%), but a moderate departure-only effect is not excluded, and we say so plainly. Second, the measurement is at the company level: we cannot tie a sale to the departing officer personally, and our Form 4 index carries no role field, which is why the officer-and-director cut is shown for Form 144 notices only. Third, the window: this is a 2025–2026 test, the years our Form 4 corpus covers, in a rising market — the 6,132 filings from 2023–2024 are outside it, and nothing here generalizes to them. Fourth, scheduled 10b5-1 selling saturates both the event windows and the baseline; the placebo design absorbs the base rate, but a thin layer of genuinely informed sales could sit inside it below this test's resolution.
How to read a 5.02 filing
Three checks. First, expect selling: in this sample, roughly six in ten leadership-change filings were preceded by insider sales in the prior quarter — because roughly six in ten ordinary quarters are. Pre-filing selling, by itself, is the base rate, not a signal. Second, look at who and how much, not whether: the median pre-filing volume is about 33,000 shares; the cases that stand out are block-scale programs by large holders, visible as such on the face of the Form 4s. Third, do not trade the aftermath off the pre-selling: across 2,500 scored events, whether insiders had sold beforehand made no measurable difference to what the stock did next — a +2.55% average for both groups, with the typical stock in each group trailing the index.
Methodology and data
Sources: SEC EDGAR Form 8-K index (GetCoattail collection, Jan 1, 2023–Oct 13, 2026; 62,009 filings, of which 12,101 contain Item 5.02), Form 144 filings (full census from Apr 13, 2023) and Form 4 filings (parsed corpus, effectively covering 2025–2026 submissions), all collected by GetCoattail. Test sample: 5.02 filings dated Apr 1, 2025–Oct 13, 2026, de-duplicated so no company contributes two events within 90 days: 3,189 events at 1,329 issuers, matched by issuer CIK. Pre-filing windows end the day before the filing date; the internal event (report) date is never used for alignment. Form 4 sales are non-derivative code-S dispositions by transaction date — a sale executed before the filing but reported after it counts as pre-filing selling, by economic substance. Placebo windows: up to 20 pseudo-filing dates per event drawn from the same company's timeline in the same period, excluding ±120 days around any of the company's 5.02 filings (40,283 realized). Return tests: entry at the next trading day's close after the filing, 63 trading days (21 as robustness, filing dates through Sep 1, 2026), stock minus SPY over identical dates, adjusted closes from the GetCoattail bars database (coverage through Oct 2, 2026); 689 of 3,189 events fall out of the 63-day return test (487 past the price runway, 202 with no price file). Intervals for rates and mean differences are company-cluster bootstraps (2,000 resamples); share intervals are Wilson. Item 5.02 is defined in the SEC's Form 8-K (Departure of Directors or Certain Officers; Election of Directors; Appointment of Certain Officers) and is reportable within four business days of the event; the form does not, in our index, separate departures from appointments. The full scored dataset accompanies this article: scored_events_8k_502.csv (3,189 events). Past patterns are not a promise of future results. For education only — not investment advice.
Revision history
- v1.0 — October 15, 2026: first publication. 8-K index through October 13, 2026; Form 4 corpus covering 2025–2026 submissions; prices through October 2, 2026.