Pictures like the Tesla purchase are why "insiders are buying" is one of the most repeated signals in markets. Yesterday we published the mirror test on the sell side — insiders sold at their usual rate before leadership-change 8-Ks — and found nothing. This study asks the buy-side question against the two most material recurring 8-K events: Item 1.01, entry into a material agreement, and Item 2.02, results of operations — the earnings filing. If insiders buy on what they know before it becomes public, purchases should bunch in the weeks before these filings. They don't. Before contract filings, buying runs at — if anything slightly below — the company's ordinary rate. Before earnings, it falls off a cliff.
What we measured
The two items behave differently, so they get two tests. Item 1.01 filings are sporadic: a contract is signed when it is signed. For 2,100 such filings (1,130 companies, April 2025–October 2026, after removing filings within 90 days of a previous kept filing at the same company), we counted insiders' open-market purchases — Form 4 transaction code P, the only code that means "bought in the open market" — in the 30, 60, and 90 days before the filing date. The comparison mirrors our pre-selling study: up to 20 placebo windows per event from the same company's own timeline in the same period, excluding windows within 120 days of a real Item 1.01 filing — 32,041 placebo windows. Matching is by CIK throughout, and day zero is the filing date, never the internal event date, so nothing uses information before it was public.
Item 2.02 breaks that design, and the break is itself informative. Earnings filings arrive roughly every 91 days, so almost every 90-day window at an earnings filer is "before an earnings filing" — no ordinary window remains to compare against. So for 6,085 earnings cycles (previous Item 2.02 filing at the same company 70–200 days earlier; median gap 91 days), we compared buying inside the cycle instead: the three 30-day bands before the filing against a 30-day window at the cycle's midpoint. One more asymmetry: there is no buy-side Form 144 — that form is a notice of a proposed sale — so the intentions signal we paired with Form 4 sales in the companion study does not exist for purchases.
Before a contract filing: the usual rate, or a touch less
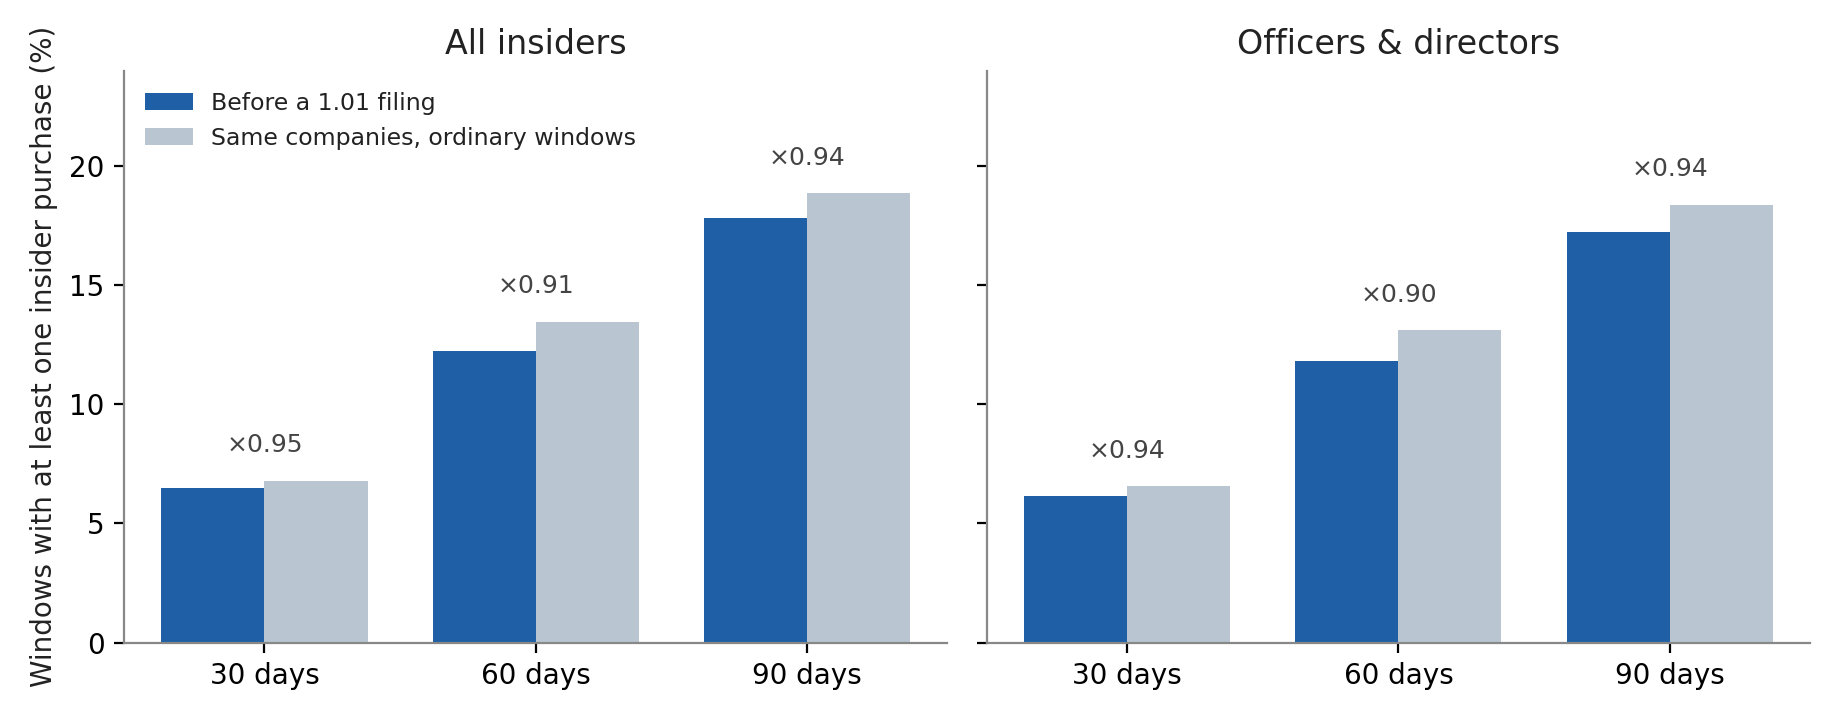
In the 90 days before an Item 1.01 filing, 17.8% of filings had at least one insider open-market purchase in the window. In the same companies' ordinary windows: 18.9%. The ratio is 0.944 (company-cluster bootstrap 95% CI 0.821–1.077) — consistent with "no difference," and it rules out any relative elevation larger than about 8%. Shorter windows agree: ×0.953 over 30 days (0.763–1.173), ×0.908 over 60 days (0.768–1.058). Counting transactions instead of windows: 0.54 purchases per pre-filing window vs 0.69 in placebo windows (×0.783, 0.573–1.054). Officers and directors only — the people who would know about a contract first — changes nothing: 17.2% vs 18.4%, ×0.939 (0.816–1.071). When purchases did occur, their size was unremarkable: median $374,036 per window vs $248,750 in placebo windows; median 10,000 shares vs 9,790.
Two construction details push toward finding nothing; we checked both. First, 71.6% of placebo windows sit in the run-up to some earnings filing — with quarterly cycles, most of a timeline is pre-earnings time — so the baseline already includes pre-earnings buying, a conservative yardstick for a contract-specific effect. Second, frequently-filing companies get fewer placebo windows (30.1% of events fell short of the 20-window target); restricting to the 1,604 events with at least 10 gives ×0.917 (0.800–1.055), the same answer. A no-randomness cross-check with fixed-offset windows (−364 and +182 days, 936 windows) lands at ×1.048 — the two constructions bracket 1.0.
No approach gradient — and an earnings cycle that leans the other way
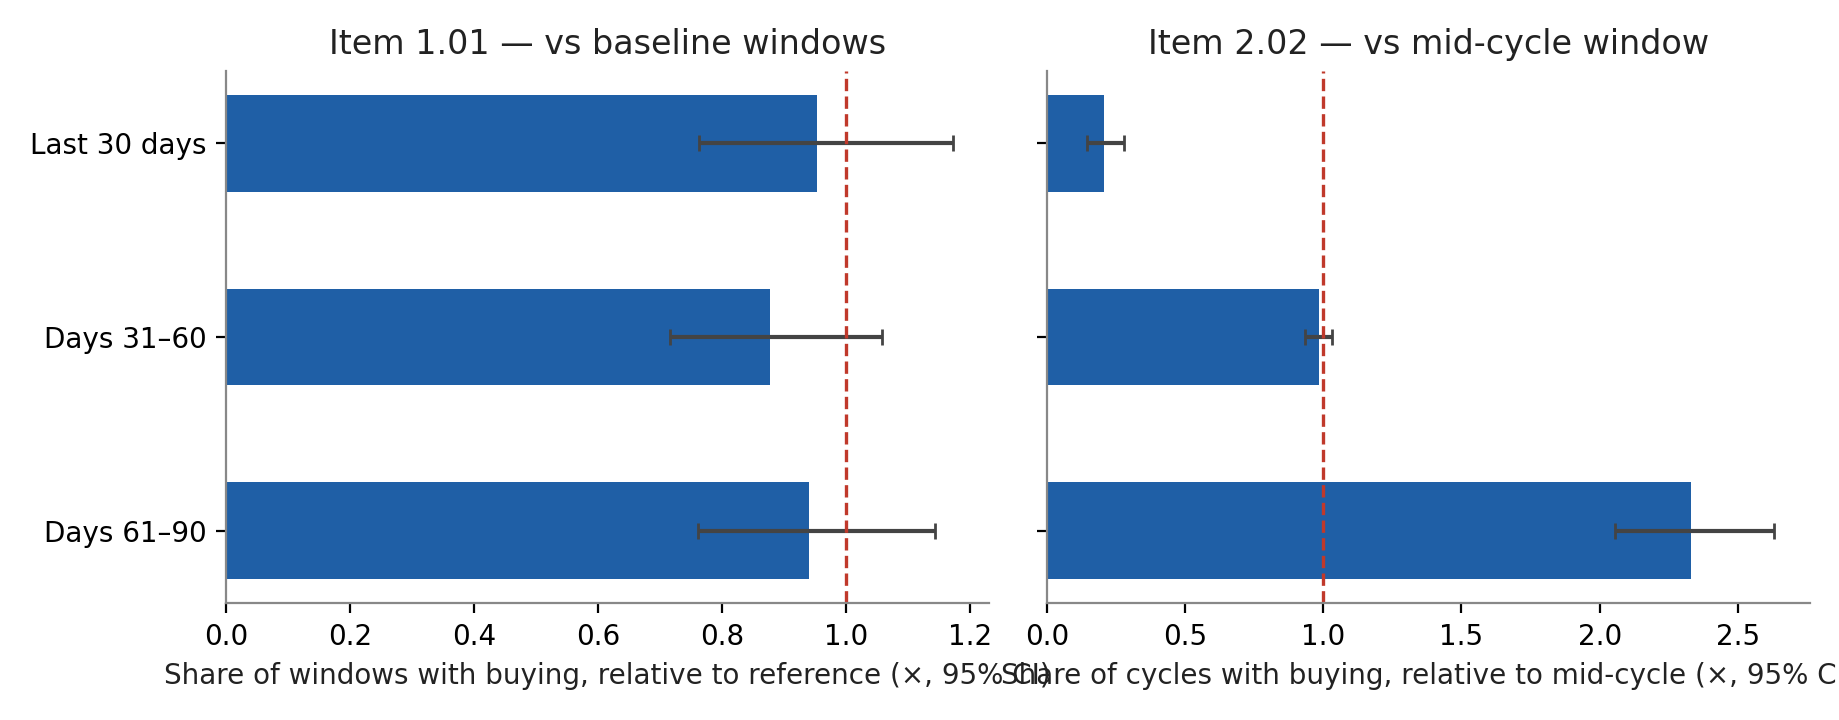
If purchases were informed positioning, they should intensify as the filing approaches. Before Item 1.01 filings they don't: last 30 days ×0.953 of baseline, days 31–60 ×0.878, days 61–90 ×0.941 — a flat line slightly below 1, every interval including 1.
The earnings cycle shows real structure — pointed the opposite way. Reading from the previous filing forward: buying is heaviest in the first month after the previous results are public (11.8% of cycles contain a purchase in that band, 2.33× the mid-cycle rate, 95% CI 2.06–2.63), ordinary at mid-cycle (5.1% of cycles; the adjacent 31–60-days-out band reads 5.0%, ×0.984), and collapses in the final month before the filing: 1.1% of cycles, ×0.207 of mid-cycle (0.145–0.280). At the median 91-day gap, the "days 61–90" band is the first month after the previous release, so the reading is plain: insiders buy when the window opens after results, and stop as the next blackout approaches — the signature of trading-window discipline, not of accumulation ahead of news. It doubles as a positive control: a design that detects a 2.3× cluster and a 0.2× drought is not too blunt to see pre-filing buying if it were there.
The aftermath doesn't separate them either
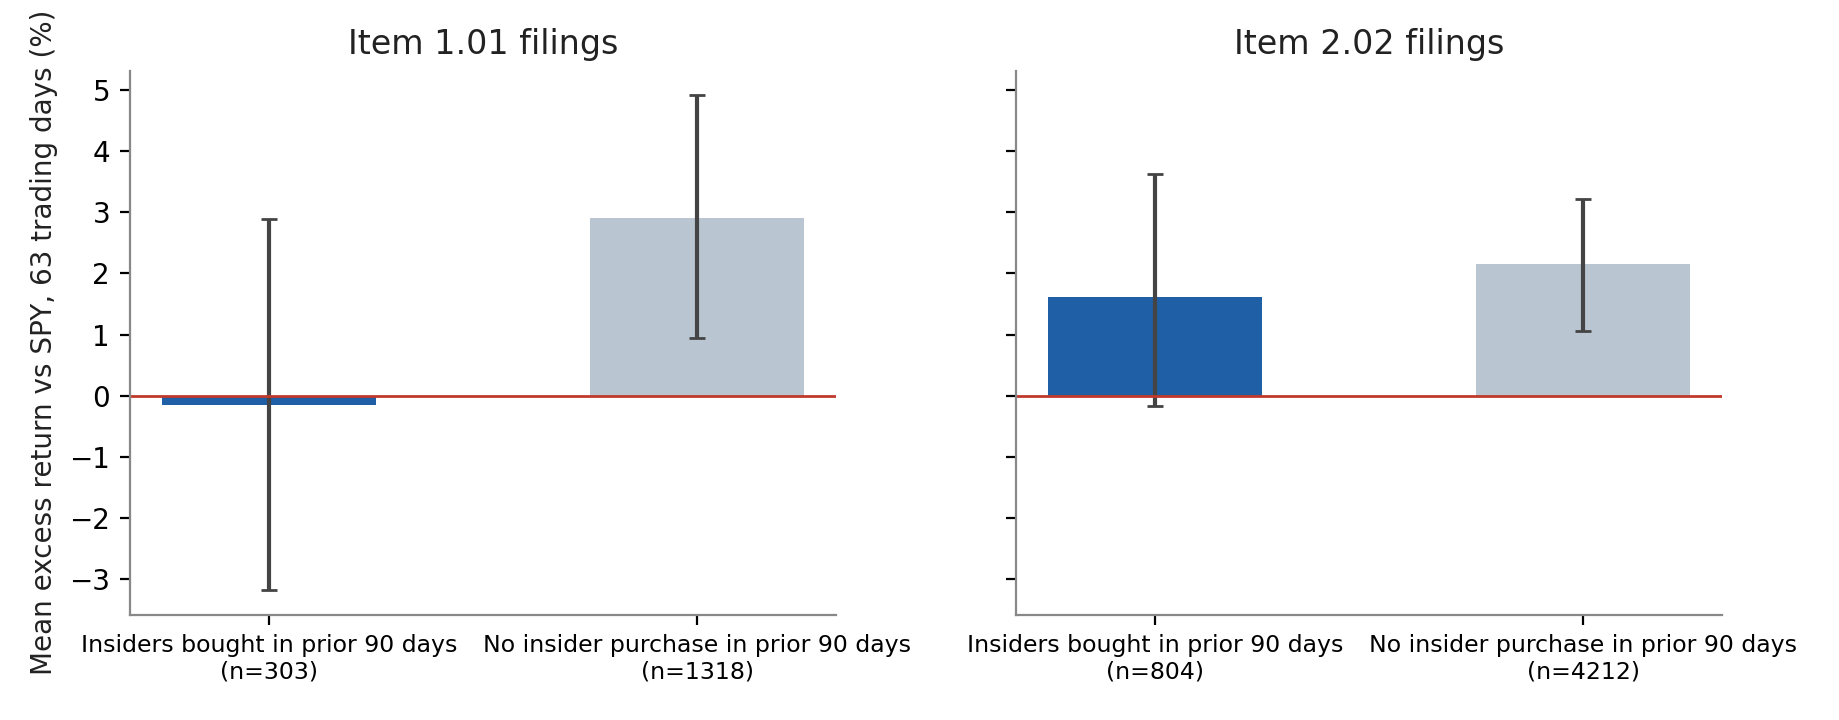
A signal can fail to bunch and still matter if the events it precedes perform differently. They don't. Item 1.01 filings preceded by an insider purchase averaged −0.15% against SPY over the next 63 trading days (n = 303); filings preceded by none averaged +2.90% (n = 1,318). The difference interval runs −6.7 to +0.4 points — it includes zero, the point estimate leans against the pre-bought group, medians are negative for both (−2.46% vs −2.14%), and win rates are a coin flip (46.2% vs 45.3%). Earnings filings: +1.62% pre-bought (n = 804) vs +2.15% (n = 4,212), difference interval −2.6 to +1.8 points. Rank pre-filing purchase dollars against the subsequent excess return and the correlation is effectively zero in both populations (ρ = −0.014 contracts, +0.010 earnings). The 21-day horizon and same-day-entry sensitivity change none of this.
The strongest objections
Our index can't tell a good contract from a bad one. Item 1.01 covers agreements of any sign — a transformational partnership and an unfavorable renegotiation file under the same item. If insiders buy only before good contracts, that effect is diluted here. What the test bounds is the average: across all contract filings, any pre-filing elevation is smaller than roughly 8% relative — and the aftermath test, where a good-news-only effect should still surface, shows pre-bought filings doing no better.
Code P is a narrow door. It captures open-market purchases only — not negotiated placements, option exercises, or grants. That is deliberate: code P is the purchase made by choice, at the market price, with the insider's own money — the act the "insiders are buying" signal claims to detect. Block-scale strategic stakes occasionally enter through it (the largest pre-contract purchase in the sample is a single 49.7-million-share, $250.0 million transaction before a Joby Aviation filing in May 2025), and even including those, the aggregate rate sits at baseline.
The window is 2025–26. Our Form 4 corpus covers those years; nothing here speaks to earlier regimes.
The billion-dollar anecdote, in context
The Tesla case is real, and it is the largest pre-filing purchase total in the earnings sample: 25 Form 4 line items, all dated September 12, 2025, all from one holder — the corpus's own records name Musk Elon — totaling 2,568,732 shares and roughly $1.0 billion, inside the 90 days before the October 2, 2025 Item 2.02 filing. Tesla then beat SPY by 2.3% over the following quarter — about the average for filings nobody bought ahead of (+2.07% overall). One holder, one day, one headline; across 6,085 cycles, final-month buying runs at a fifth of the mid-cycle rate. Individual outcomes still spread wide — a CoreWeave filing preceded by $10.5 million of purchases ran +113.2% over the next quarter, an America's Car-Mart filing preceded by a single 102-share purchase fell −56.8% — what a sample with no signal in it looks like.
How to use this on GetCoattail
Read the Insider lens for what it can actually show: buying that clusters after news is public — the post-earnings open window is where insider purchases genuinely concentrate (×2.33 the mid-cycle rate). Treat "insiders bought in the month before earnings" as what it is — a rare event (1.1% of cycles) at a fifth of the normal pace, in a window most companies black out — not as positioning to front-run. And when a pre-filing purchase appears before a contract filing, the base rate is the context: 17.8% of such filings have one, the same rate as any ordinary stretch of the calendar, and those filings did no better afterward.
Methodology and data
Sources: SEC EDGAR Form 8-K index (GetCoattail collection, Jan 1, 2023–Oct 13, 2026; 62,009 filings, of which 28,221 contain Item 1.01 or Item 2.02) and Form 4 filings (parsed corpus, effectively covering 2025–2026 submissions), all collected by GetCoattail. Test window: filings dated Apr 1, 2025–Oct 13, 2026 — the span whose 90-day look-backs fit inside the Form 4 corpus — de-duplicated so no company contributes two events within 90 days (Item 1.01 population: 2,100 filings at 1,130 issuers; Item 2.02 population: 6,705 filings at 1,420 issuers, of which 6,085 enter the cycle test). Matching is by issuer CIK throughout. Day zero is the filing date; the internal event (report) date is never used for alignment. Purchases are Form 4 non-derivative transactions with code P and acquisition disposition, dated by transaction date; officer/director cuts use the reporting owner's attributes on the filing. Form 144, a notice of proposed sale, has no purchase-side counterpart and plays no role in this test. Baselines: for Item 1.01, up to 20 pseudo-filing windows per event drawn from the same company's timeline in the same period, excluding ±120 days around any of the company's Item 1.01 filings (32,041 realized; the exclusion is keyed to Item 1.01 because quarterly Item 2.02 filings would otherwise blanket the timeline — 71.6% of realized placebo anchors still fall within 90 days before some earnings filing, which makes the baseline conservative). For Item 2.02, the reference is a 30-day window at the midpoint of the same earnings cycle (previous filing to this filing, gaps of 70–200 days; median 91). Intervals for rates and mean differences are company-cluster bootstraps (2,000 resamples); share intervals are Wilson, in the accompanying data sheet. Return tests: entry at the next trading day's close after the filing, 63 trading days (21 as robustness), stock minus SPY over identical dates, adjusted closes from the GetCoattail bars database (coverage through Oct 2, 2026); the 63-day test scores filings through Jul 3, 2026 (Item 1.01: 1,621 of 2,100 scored, 337 past the price runway and 142 with no price file; Item 2.02: 5,016 of 6,705 scored, 1,320 past the runway and 369 with no price file). Items 1.01 and 2.02 are defined in the SEC's Form 8-K (Entry into a Material Definitive Agreement; Results of Operations and Financial Condition). Our verification pass rebuilt every pre-filing count and every 63-day return from the raw Form 4 filings and price files rather than the analysis indexes: all 8,805 events matched, cell for cell. The full scored dataset accompanies this article: scored_events_8k_buying.csv (8,805 events). Companion study: Insiders Sold at Their Usual Rate Before the Leadership 8-K. Past patterns are not a promise of future results. For education only — not investment advice.
Not investment advice. A purchase can reflect liquidity, taxes, diversification, or compensation mechanics as easily as conviction. Past patterns in filing data do not predict future returns.
Revision history
- v1.0 — October 15, 2026: first publication. 8-K index through October 13, 2026; Form 4 corpus covering 2025–2026 submissions; prices through October 2, 2026.