GetCoattail Research — AST SpaceMobile is the market's space-broadband story: satellites built to connect directly to ordinary smartphones, and a stock that peaked at $133.09 in May before falling 34.2% from June 30 to October 2. We ran it through every filing lens we maintain. One of our 83 tracked superinvestors holds it at all — 5,380 shares, unchanged — and short interest, at 65,261,118 shares, has just set the record for the entire collected series.
Start with the narrative: a build-out story running into execution questions. AST SpaceMobile's BlueBird satellites are designed to connect directly to standard smartphones, and coverage counts more than 60 mobile operator partners covering more than 3 billion subscribers, a contracted backlog of about $1.3 billion, pro-forma liquidity of about $3.7 billion after a July 2026 convertible offering (reported at about $1 billion, or $1.15 billion in some reports), and a fiscal 2026 revenue outlook of $150–200 million. The headwinds arrived in the same coverage: a launch vehicle left BlueBird 7 in too low an orbit, tied to a loss of about $125.9 million in the second quarter of 2026; first-quarter revenue of $14.73 million and second-quarter revenue of $31.52 million both missed consensus, in a run coverage described as six consecutive EPS misses; on July 15–16 the convertible offering was announced and the 45-satellite target was pushed from the end of 2026 to early 2027, with shares falling about 17% on July 16 and about 31% from early July to the October 2 close near $58. B. Riley downgraded the stock to Neutral on October 2 (target $85 to $65); a securities class action carries a November 13, 2026 lead-plaintiff deadline; three more BlueBird satellites were reported shipped to Cape Canaveral in early October. The consensus target in Koyfin data carried by Stocktwits is $79.61 (14 analysts: five Buy, seven Hold, two Sell); Roth MKM holds a Buy at $108. AltIndex counted 181 Reddit mentions in the 24 hours to October 8, up 229.1%, Neutral sentiment.
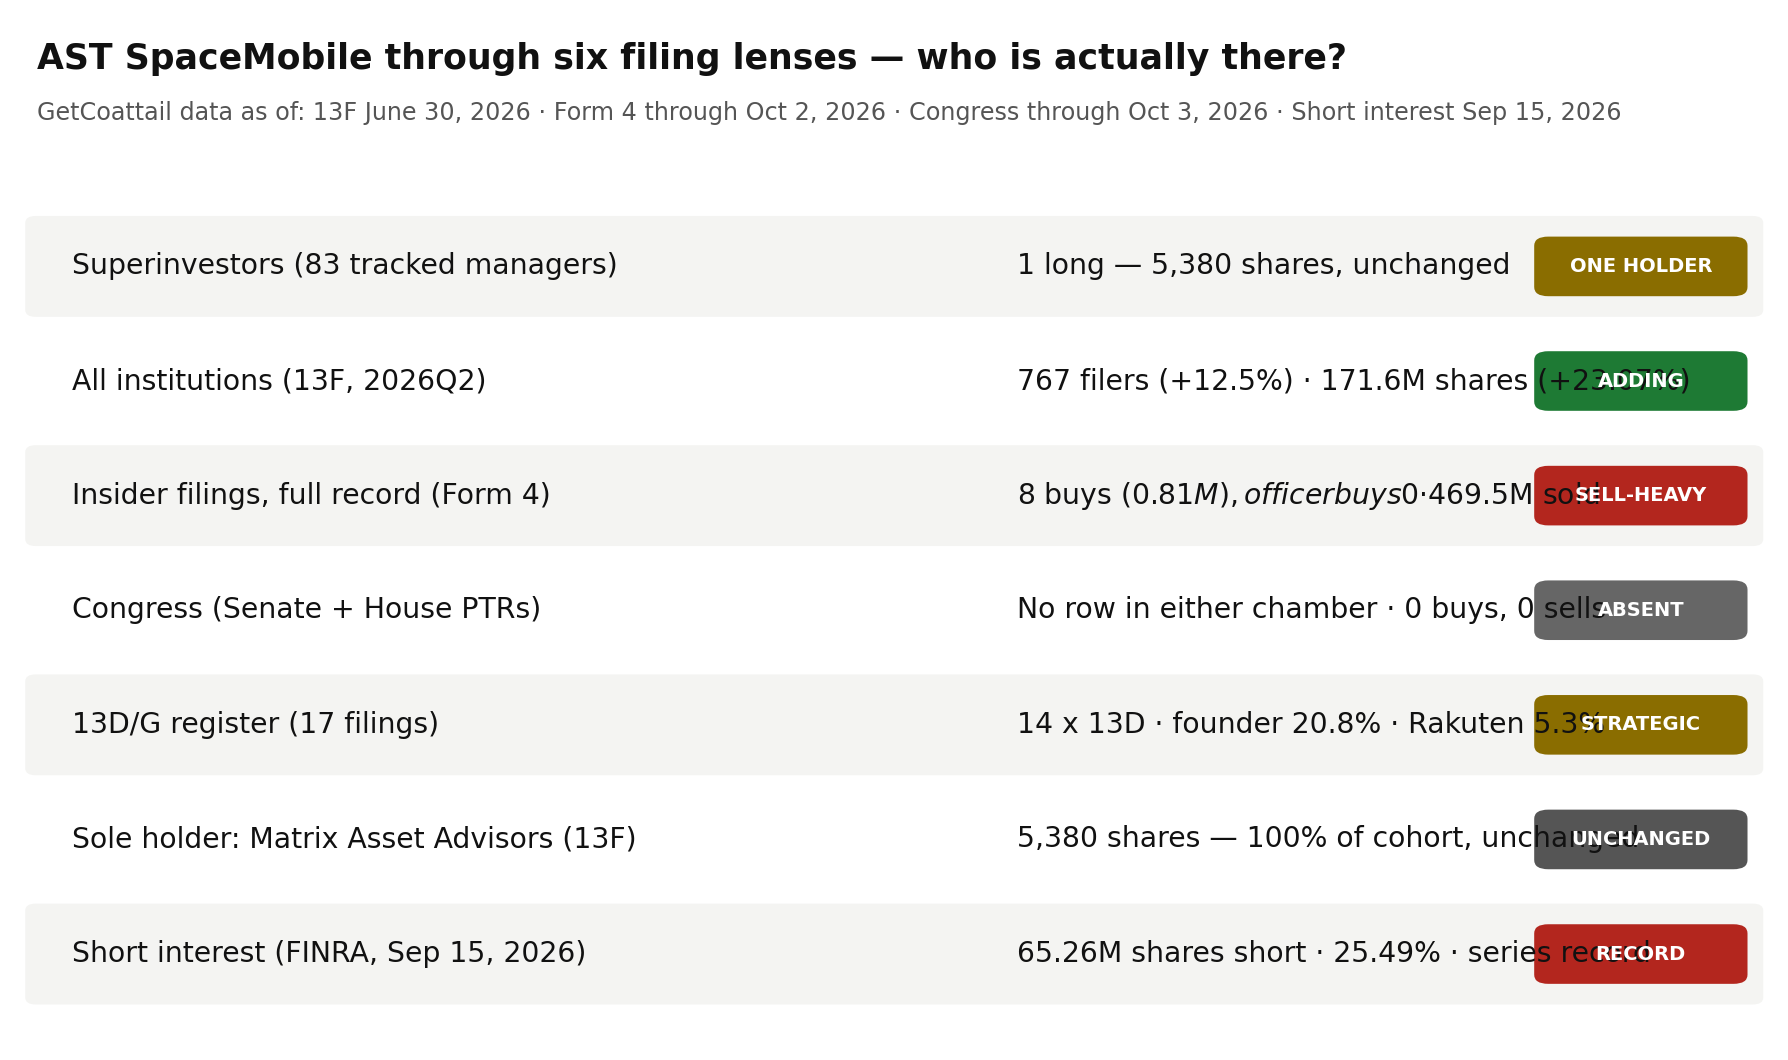
Now the filings. GetCoattail tracks the investors best placed to know any company: superinvestors, institutions, insiders, Congress, and 5% holders. For AST SpaceMobile — the twentieth Filing Tape audit — the story is a tracked cohort that is essentially absent, a broad register that added shares, a 5% register full of strategic names rather than activists, and a borrow that has never been larger.
Lens 1: the superinvestors — one holder, 5,380 shares, unchanged
We track 83 large, mostly long-only managers whose 13F portfolios we collect directly from SEC EDGAR. As of June 30, 2026, one held AST SpaceMobile in a long common-stock position — a long row, with no option rows in the count. That holder is David Katz at Matrix Asset Advisors, with 5,380 shares worth $478,067, a 0.04% portfolio weight. The position did not move in the second quarter: 5,380 shares at March 31 and 5,380 at June 30 — unchanged, 0.0% — in a quarter when the price rose from $82.87 to $88.86 in our price file, up 7.2%. The pipeline and EDGAR-collection share totals agree exactly. The direction count is one line: zero new, zero increased, zero decreased, one unchanged — and the single holder is, by construction, 100% of the entire cohort. The other 82 tracked managers hold no long position at all.
Lens 2: institutions — 12.5% more filers, 23.07% more shares
Zoom out to the whole 13F market and the register is crowded where the tracked cohort is empty. At June 30, 2026, 767 institutions reported positions, up from 682 at March 31 (+12.5%), and 750 reported long positions. Reported shares rose 23.07%, from 139,446,446 to 171,613,694 shares, with 705 filers entering and 620 exiting. Reported aggregate value rose 36.9% to $20,966,650,170; the aggregate includes option rows, so we headline filer and share counts and label dollars "reported" (see methodology). The implied value per share, $122.17, sits 37.5% above the June 30 close of $88.86 — among the largest gaps this series has recorded on this check.
Lens 3: the 5% register — 17 filings, and this one contains 13Ds
Seventeen SC 13D/G filings cover AST SpaceMobile — 14 in the 13D family including amendments, and three 13G filings, 16 amendments, from 12 reporting names, the most recent filed June 23, 2026, maximum reported percentage 25.0%. Unlike most audits in this series, this register does contain 13Ds — but the names are strategic holders, not activists: a founder, carriers and infrastructure partners. We assign no motives. The largest chain is Abel Avellan's, running from 78,163,078 shares (25.0%) as of January 22, 2025 to 78,252,625 shares (20.8%) as of June 22, 2026 — share count essentially flat, percentage diluted down. The Rakuten chain shrank in shares: Rakuten Group and Hiroshi Mikitani reported 26,080,155 shares (8.9%) as of April 14, 2026, then 21,020,155 (7.2%) as of April 22, then 15,510,078 (5.3%) as of May 1. Vodafone reported 14,516,197 shares (6.0% to 5.0%, count unchanged); AT&T reported 6,260,440 shares (2.7%, SC 13D, February 3, 2025); American Tower and ATC TRS reported 2,382,036 shares (0.84%); BlackRock reported 10,582,540 shares (4.7%, 13G/A, March 31, 2025). The Vanguard Group reported 21,488,180 shares (7.68%) as of December 31, 2025, then a 0-share row as of March 13, 2026 — the same sequence seen in several earlier audits; we report rows as filed, without summing them or calling the zero an exit.
Lens 4: insiders — $806,436.31 of buys against $469,547,492.45 of sales; officers bought none of it
One distinction must be stated precisely: the buy side is not empty — one column of it is. Across the parsed Form 4 record (111 filings through October 2, 2026), there are eight open-market purchases totalling 13,587 shares and $806,436.31, by two buyers — and zero of those purchases are officer purchases. Against that stand 27 sales totalling 5,958,630 shares and $469,547,492.45, by nine sellers, 21 of them officer sales. Every purchase falls inside the most recent year (69 filings; the same eight purchases; 16 sales totalling $459,346,189.60, by eight sellers). In the 90 days through October 2, 2026, 16 filings covered three purchases totalling 10,822 shares and $619,200.26, by one buyer — again zero officer purchases — and two sales totalling 52,000 shares and $3,063,880.00, by two sellers. Our site's insider aggregate (October 9, 2026) matches the full-parse 90-day figures exactly. Some selling is mechanical — vesting, tax withholding and pre-arranged plans — and we assign no motives. The record establishes only this: purchases total $806,436.31 against $469,547,492.45 of sales, and the officer-purchase column is empty in every period we can parse.
Lens 5: Congress — no row in either chamber
Across the Senate and House record we maintain (combined record as of October 3, 2026), AST SpaceMobile has no row at all — not in the combined, House or Senate aggregate. There are therefore zero recorded purchases and zero recorded sales: this lens is not quiet, it is absent. Had there been trades, congressional disclosures report value ranges, so we would record direction only; here there is nothing to record.
Lens 6: short interest — a series record, at 25.49% of the share count
As of September 15, 2026 — the most recent FINRA settlement date — 65,261,118 AST SpaceMobile shares were sold short, with days-to-cover of 6.93. That reading is not near the top of the series; it is the top: across all 131 settlements we collect, from April 15, 2021 to September 15, 2026, no settlement has recorded a larger borrow, so the latest reading sits 0.0% below the peak because it is the peak. Year over year, the September 15, 2025 settlement recorded 41,767,317 shares, so the latest reading is up 56.2%. Against the 255,982,592 shares in our fundamentals file, the borrow is 25.49% of the share count — with the caveat, stated in the methodology, that this share count is a weighted-average basic figure as of December 31, 2025 rather than a period-end outstanding count.
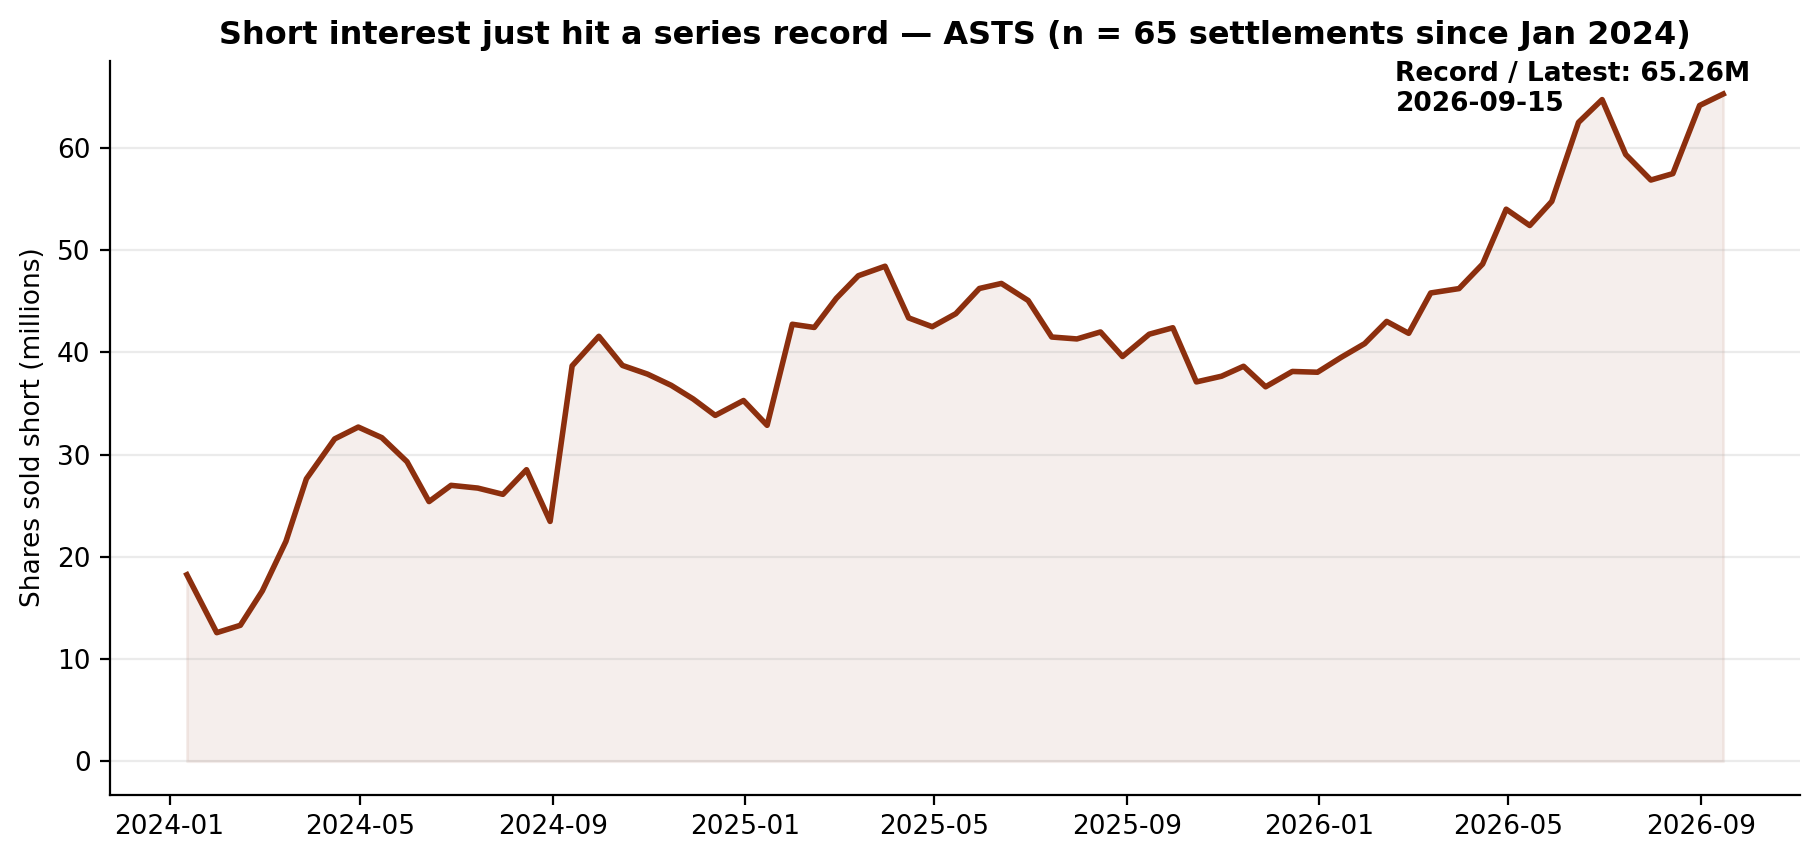
The recent settlements run 59,349,055 on July 15, then 56,847,259, 57,475,212, 64,140,398 and 65,261,118. The series began at 2,198,812 shares on April 15, 2021; the largest settlement in the series is its most recent one.
The gap, stated plainly
The registers disagree on scale. The tracked superinvestors hold 5,380 shares across one manager, unchanged, while the full market holds 171,613,694 shares across 767 filers (+12.5% filers, +23.07% shares in one quarter). The 5% register is dominated by strategic names: a founder chain diluted from 25.0% to 20.8% on a flat count, a Rakuten chain down from 26,080,155 shares to 15,510,078 in under three weeks, carrier rows from Vodafone and AT&T. Insiders bought $806,436.31 across the entire parsed record — none of it by officers — against $469,547,492.45 of sales. Congress has no row. And the borrow stands at a series record: 65,261,118 shares, 25.49% of the share count, up 56.2% year over year, in a stock down 56.1% from its 252-session closing high of $133.09. One plausible reading is that the registers are pricing two different companies — the broad register and strategic holders the network being built, the borrow the losses and delays already filed — while the tracked cohort, with 5,380 shares, has priced neither. The record supports each clause separately; it does not say which register is right.
What would change the picture
Nothing above is a recommendation. It is a record. These are the filings that would change the description:
- 1. The 2026Q3 13Fs (filing window closing mid-November 2026). Q3 contains the drawdown — the price fell 34.2% from June 30 to October 2 in our file. Whether the 5,380 shares (100% of the cohort) survived, and whether any of the other 82 managers opened a first position, is the whole lens: at one holder, a single new row rewrites it.
- 2. A first officer purchase — anywhere, at any size. Eight purchases totalling $806,436.31, all by non-officers, against $469,547,492.45 of sales, with officer purchases at zero in every window. One officer purchase would be the first entry in a column empty for the entire parsed record.
- 3. The next short-interest settlements after a record print. The borrow stood at 65,261,118 shares on September 15 — the peak of all 131 settlements, up 56.2% year over year. The next settlements show whether borrowers treated the record as a ceiling or a waypoint: FINRA publishes every two weeks.
- 4. The next 13D/A prints from the strategic register. Rakuten fell from 26,080,155 shares (8.9%) to 15,510,078 (5.3%) between April 14 and May 1, 2026; Avellan was diluted from 25.0% to 20.8% on a flat count. Further Rakuten cuts, a Vodafone count change after two prints at 14,516,197 shares, or any new carrier row would each change this register.
- 5. A first congressional row, in either chamber. All three aggregates have no AST SpaceMobile row as of October 3, 2026. A first purchase or sale — from either chamber — creates a lens that does not currently exist.
Until one of those prints, the record describes a stock whose broad register added 23.07% more shares in Q2 while its tracked superinvestors stood still at 5,380 shares, whose insiders sold $469,547,492.45 against $806,436.31 of non-officer purchases and zero officer purchases, and whose borrow, at 65,261,118 shares, is the largest in the entire collected series.
Related reading: Eight of 83: Six Superinvestors Cut Fair Isaac as the Price Rose 11.9%. Its Insiders Have Never Bought a Share. — Filing Tape #19; Seven of 83: One Holder Is 94.1% of the Superinvestors' Nike Stake. Short Interest Just Hit a Record. — Filing Tape #18; Zero of 83: The Superinvestors Aren't in IREN — Filing Tape #1. AST SpaceMobile's own page: AST SpaceMobile (ASTS) on GetCoattail.
Methodology and data notes
- Superinvestor lens: 83 managers collected directly from SEC EDGAR Form 13F (managers_13f collection), positions as of June 30, 2026; AST SpaceMobile identified by CUSIP 00217D100. One distinct manager holds a long position totalling 5,380 shares; the single reported row is long (no put or call rows). Quarter-to-quarter cohort totals (5,380 shares across 1 pipeline row at March 31; 5,380 across 1 pipeline row at June 30) are from the site pipeline's holdings files on the same CUSIP basis in both quarters; the change is 0.0% ((5,380 / 5,380) − 1), and the pipeline's second-quarter share total agrees exactly with the EDGAR collection's long total (difference: 0 shares). The holder's share of the cohort is 5,380 / 5,380 = 100%. Direction counts across the one long holder: 0 new, 0 increased, 0 decreased, 1 unchanged.
- Full-market lens: SEC Form 13F Data Sets full-market aggregation (the fixtures underlying our 2026Q1–Q2 market tables). Holders = distinct filers reporting the CUSIP; 750 of the 767 reported long positions. Reported-value caution: the aggregate value ($20,966,650,170 over 171,613,694 shares) implies ≈$122.17 per share against a June 30, 2026 close of $88.86 in our price file, a gap of 37.5%. The aggregate sums the VALUE of every information-table row — including put and call option rows — while the share count covers long common-stock rows only, so we headline filer and share counts and label dollar values "reported."
- Insider lens: full-parse Form 4 aggregation (agg_by_ticker), record as of October 2, 2026 (111 filings). Sale and purchase counts are transaction-code counts (S and P) in non-derivative rows; grants and exercises are not counted as purchases, and one filing can contain many transaction rows. Purchase transactions total eight across the full record (13,587 shares, $806,436.31, two buyers), of which zero are recorded as officer purchases. Sale transactions total 27 across the full record (5,958,630 shares, $469,547,492.45, nine sellers), of which 21 are recorded as officer sales. In the most recent year: eight purchases, $806,436.31, two buyers; 16 sale transactions, $459,346,189.60, eight sellers. In the 90 days through October 2, 2026: three purchases, 10,822 shares, $619,200.26, one buyer; two sale transactions, 52,000 shares, $3,063,880.00, two sellers. The site's insider aggregate (compiled as of October 9, 2026) matches the full-parse 90-day figures exactly.
- 13D/G lens: full-parse SC 13D/G aggregation and parsed filings (17 filings matching CUSIP 00217D100, 12 reporting names), filings through June 23, 2026. Abel Avellan's rows (78,163,078 shares at 25.0% as of January 22, 2025, through 78,252,625 shares at 20.8% as of June 22, 2026), the Rakuten Group / Hiroshi Mikitani / Rakuten Mobile rows (26,080,155 shares at 8.9% as of April 14, 2026; 21,020,155 at 7.2% as of April 22; 15,510,078 at 5.3% as of May 1), the Vodafone rows (14,516,197 shares at 6.0% as of March 10, 2025 and at 5.0% as of January 29, 2026), the AT&T rows (6,260,440 shares at 2.7% as of February 3, 2025), the American Tower / ATC TRS row (2,382,036 shares at 0.84% as of December 9, 2025), the BlackRock row (10,582,540 shares at 4.7% as of March 31, 2025) and The Vanguard Group's rows (21,488,180 shares at 7.68% as of December 31, 2025, and 0 shares as of March 13, 2026) are reported as separate rows, as filed; they are not summed. The aggregation's totalSharesReported field sums overlapping reporters and successive amendments and is not used. Percentages are quoted exactly as reported in the respective filings.
- Congress lens: Senate PTR archive and House PTR archive as maintained on this site, combined record as of October 3, 2026. AST SpaceMobile has no row in the combined aggregate (as of October 3, 2026), the House aggregate (as of October 3, 2026) or the Senate aggregate (as of October 1, 2026), so the lens reports zero purchase and zero sale transactions on the basis of a confirmed absence in all three files.
- Short interest lens: FINRA Equity Short Interest files (biweekly settlement dates), collected directly from FINRA's public distribution; the AST SpaceMobile series covers 131 settlements from April 15, 2021 to September 15, 2026. The latest reading of 65,261,118 shares on September 15, 2026 is the maximum of the full collected series, so it sits 0.0% below the peak ((65,261,118 / 65,261,118) − 1). FINRA publishes each settlement about two weeks after the fact. The share-count ratio uses the fundamentals file's share count of 255,982,592 — a weighted-average basic share count (us-gaap WeightedAverageNumberOfSharesOutstandingBasic) as of December 31, 2025, not a period-end shares-outstanding count, so the 25.49% ratio should be read with that denominator definition in mind.
- Fundamentals note: our fundamentals collection carries AST SpaceMobile's fiscal-2024 revenue of $13,825,000, fiscal-2025 net income of -$341,940,000 and fiscal-2025 assets of $5,014,387,000. The market value of about $16.16 billion uses that file's October 6, 2026 price ($63.12) and reported share count.
- Prices: our own daily-close file for AST SpaceMobile through October 2, 2026 ($58.45 close, −19.5% year to date on that file; 252-session closing high $133.09 on May 28, 2026; 252-session closing low $50.70 on November 20, 2025; closes of $82.87 at March 31, 2026 and $88.86 at June 30, 2026, a second-quarter change of +7.2%; change from June 30 to October 2 of −34.2% ((58.45 / 88.86) − 1)). The drawdown from the 252-session closing high is −56.1% ((58.45 / 133.09) − 1), and the gain from the 252-session closing low is +15.3%.
- Market context sources: operator-partner network (more than 60 mobile operator partners covering more than 3 billion subscribers), contracted backlog of about $1.3 billion, pro-forma liquidity of about $3.7 billion after the July 2026 convertible offering (offering reported at about $1 billion / $1.15 billion), and fiscal 2026 revenue outlook of $150–200 million — company and financial-press coverage, checked October 9, 2026, summarised in our own words; BlueBird 7 orbit shortfall and related loss of about $125.9 million in the second quarter of 2026, first-quarter revenue of $14.73 million and second-quarter revenue of $31.52 million both missing consensus, and a run of six consecutive EPS misses in coverage — earnings coverage, checked October 9, 2026; July 15–16, 2026 convertible-offering announcement and 45-satellite target moved from end-2026 to early 2027, shares down about 17% on July 16 and about 31% from early July to the October 2 close near $58 — market coverage of the July move, checked October 9, 2026 (these two percentages are coverage figures; our own price file is used for all dated closes in this article); B. Riley downgrade to Neutral on October 2, 2026 with target cut from $85 to $65, and securities class action with a November 13, 2026 lead-plaintiff deadline — analyst and legal-notice coverage, checked October 9, 2026; three additional BlueBird satellites shipped to Cape Canaveral in early October — launch-logistics coverage, checked October 9, 2026; consensus target of $79.61 (14 analysts: five Buy, seven Hold, two Sell) — Koyfin data as carried by Stocktwits, checked October 9, 2026; Roth MKM Buy rating with a $108 target — analyst coverage, checked October 9, 2026; social-media attention ranking (181 Reddit mentions in 24 hours, up 229.1%, Neutral sentiment, price shown $56.93, updated October 8, 2026 at 10:15 PM Pacific) — AltIndex, checked October 9, 2026. Figures we could not confirm against two sources were left out.
- AST SpaceMobile is in the GetCoattail stock-page universe: AST SpaceMobile (ASTS) stock page. Series data: asts_lens_data.csv · asts_short_interest_series.csv. Earlier audits: Fair Isaac · Nike · IREN.
This article describes public filings as of the dates stated. It is not investment advice and makes no recommendation. Filings lag reality: 13F positions are as of June 30, 2026, and later trading is not yet public.
Revision history
- v1.0 — October 9, 2026: first publication.