GetCoattail Research — Alibaba is the market's argument about what AI spending is worth: cloud revenue up 45%, a consensus target near $186 against a price near $106, and a stock 44.1% below its October 2025 closing high in our price file. We ran it through every filing lens we maintain. Nine of our 83 superinvestors hold it long — 13,751,597 shares — and one is 72.4% of the cohort. Its insiders bought more than they sold in the last 90 days.
Start with the narrative: growth in the segment the market cares about, paid for with profit elsewhere. Alibaba's June quarter of 2026 — the first quarter of its fiscal 2027, reported in August — was reported with revenue of RMB 268.95 billion, up 9% year over year, and net income down 75% to RMB 10.44 billion. Inside that split sits the AI business: AI Cloud and Compute Services revenue grew 45% to RMB 48.44 billion, segment adjusted EBITA rose 133% to RMB 5.60 billion, and capital spending climbed 75% to RMB 67.70 billion. Coverage of the latest reported quarter put revenue at $39.64 billion, up 8.6% and just above the $39.52 billion consensus, with earnings per share of $1.26 missing the $1.94 consensus by $0.68. Analyst targets frame the disagreement: MarketBeat's average stood at $186.33 from 20 analysts on October 2, 2026, Jefferies raised its target to $192 on October 8, and the stock closed at $105.85 on October 2 in our price file. Insider Monkey's search-volume ranking places Alibaba nineteenth, at 823,000 average monthly searches — the highest-ranked stock we had not yet audited once the names above it, all previously covered or skipped, were set aside.
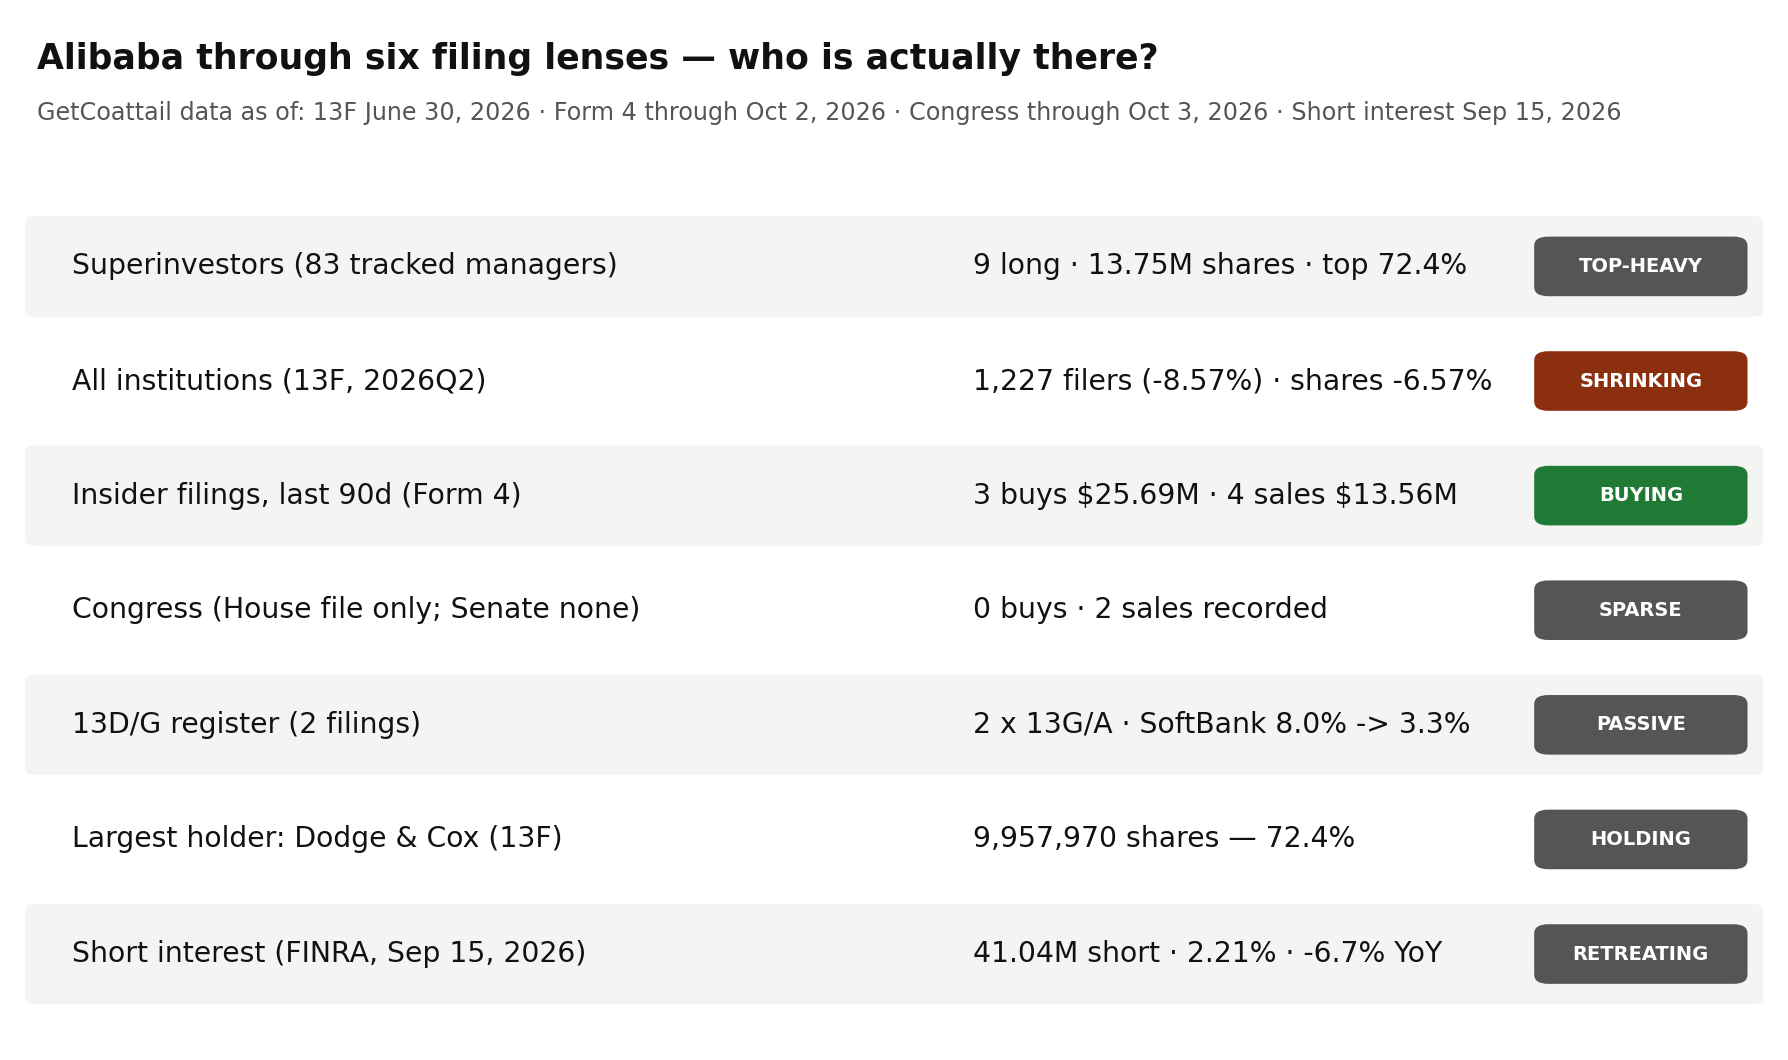
Now the filings. GetCoattail tracks the investors best placed to know any company: superinvestors, institutions, insiders, Congress, and 5% holders. For Alibaba — the twenty-sixth Filing Tape audit — the story is a concentrated superinvestor cohort that trimmed far less than the price fell, a full-market register that shrank by 115 filers in one quarter, a 5% register reduced to a single holder cutting its stake, and insiders whose only purchases in the record all landed in the last 90 days.
Lens 1: the superinvestors — nine holders, and one of them is 72.4% of the cohort
We track 83 large, mostly long-only managers whose 13F portfolios we collect directly from SEC EDGAR. As of June 30, 2026, 9 held Alibaba long — long rows, no option rows — totalling 13,751,597 shares worth $1,319,878,305. The direction count: one new, three increased, four decreased, one unchanged.
The register is top-heavy. Dodge & Cox Funds reported 9,957,970 shares worth $955,765,961, a 0.5% portfolio weight, increased 0.4% — 72.4% of the entire cohort alone. The next two are David Tepper's Appaloosa, with 2,000,000 shares worth $191,960,000, a 2.48% weight, decreased 42.3%, and Causeway Capital Management, with 995,040 shares worth $95,503,939, a 1.03% weight, decreased 6.9%. The top three together are 94.2% of the cohort. The remaining six are small: ShawSpring 409,153 shares (+41.0%, a 16.92% weight); H&H International Investment 301,400 shares, the quarter's one new position; Chou Associates 41,900 (unchanged); Pzena 26,761 (−5.9%); Oakmark 15,413 (+14.7%); Tweedy Browne 3,960 (−2.5%). On both the EDGAR collection and the pipeline's CUSIP basis, the cohort total ran from 14,829,757 shares at March 31 to 13,751,597 at June 30 — down 7.27% — in a quarter when the price fell from $125.46 to $95.98, down 23.5%. The cohort, in other words, trimmed far less than the price fell, and its biggest member marginally added.
Lens 2: institutions — a broad register that lost 115 filers in a quarter
Zoom out to the whole 13F market: the register is broad and shrinking. At June 30, 2026, 1,227 institutions reported positions, down from 1,342 at March 31 (−8.57%), and 1,214 reported long positions. Reported shares fell 6.57%, from 247,019,129 to 230,788,192 shares, with 1,045 filers entering and 1,160 exiting. Reported aggregate value fell 20.43% to $36,618,243,340; the aggregate includes option rows, so we headline filer and share counts and label dollars "reported" (see methodology). The implied value per share, $158.67, sits 65.3% above the June 30 close of $95.98 — a wide definitional gap, and a sign that much of this name's reported value runs through option rows. What is not definitional is the filer count: 115 more institutions left than entered, in the quarter the price fell 23.5%.
Lens 3: the 5% register — two filings, one holder, cutting
Two SC 13D/G filings cover Alibaba in our full parse — zero in the 13D family and two SC 13G/A amendments, one reporting name, most recently filed May 15, 2025. Both belong to SoftBank Group Corp. SoftBank reported 1,526,790,344 shares (8.0%) as of December 31, 2024, filed February 14, 2025, and then 630,790,344 shares (3.3%) as of March 31, 2025, filed May 15, 2025 — a reduction of 896,000,000 shares and 4.7 percentage points. No other reporter appears in the parse, and nothing in this register is newer than May 2025: the 5% tape is one holder, two amendments, then silence. We report the rows as filed, without summing them (see methodology).
Lens 4: insiders — three purchases in the record, all of them in the last 90 days
The parsed Form 4 record holds 36 filings through October 2, 2026, all within the most recent year. Across it there are three open-market purchases totalling 1,790,000 shares and $25,691,200.00, by two buyers, one recorded as an officer purchase of $4,984,000. Against that stand 13 sales totalling 2,013,044 shares and $85,847,273.73, by five sellers, all 13 recorded as officer sales. The timing is the story: all three purchases fall in the 90 days through October 2, 2026, a window holding four sales totalling 999,971 shares and $13,563,303.73 — so the last 90 days ran $25,691,200.00 of purchases against $13,563,303.73 of sales, a net purchase of 790,029 shares. Our site's insider aggregate (October 10, 2026) records exactly the same 90-day figures and flags a chief executive purchase in the window, most recently dated August 25, 2026. Alibaba is a foreign private issuer and this lens counts only filings our parse holds; within that record, the buy column opened recently and outweighs the sell column in this window. Some selling is mechanical — vesting, tax withholding and pre-arranged plans — and we assign no motives.
Lens 5: Congress — no purchases, two sales, no Senate record
Across the congressional record we maintain (combined record as of October 3, 2026), Alibaba's register holds no purchase transactions and two sale transactions, with no most-recent purchase date. The record sits in the House file (as of October 3, 2026); the Senate aggregate (as of October 1, 2026) carries no Alibaba record. The combined aggregate's member-count field reads zero alongside those two sales — a quirk we report rather than resolve (see methodology). Congressional disclosures report value ranges, so this lens records direction and counts only.
Lens 6: short interest — down 46.9% from its 2022 peak, at 2.21% of the reported share count
As of September 15, 2026 — the most recent FINRA settlement date — 41,044,240 Alibaba shares were sold short, with days-to-cover of 5.41, down 2.82% from the prior settlement. The series peak stands at 77,249,322 shares on October 31, 2022, so the latest reading is 46.9% below the peak; the June 30, 2026 settlement recorded 42,358,223 shares, so the borrow has eased 3.1% since quarter-end. Against the 1,858,037,427 shares in our fundamentals file (as of March 31, 2026), the borrow is 2.21% of the reported share count. Year over year, the borrow is down 6.7% from 43,975,803 shares on September 15, 2025.
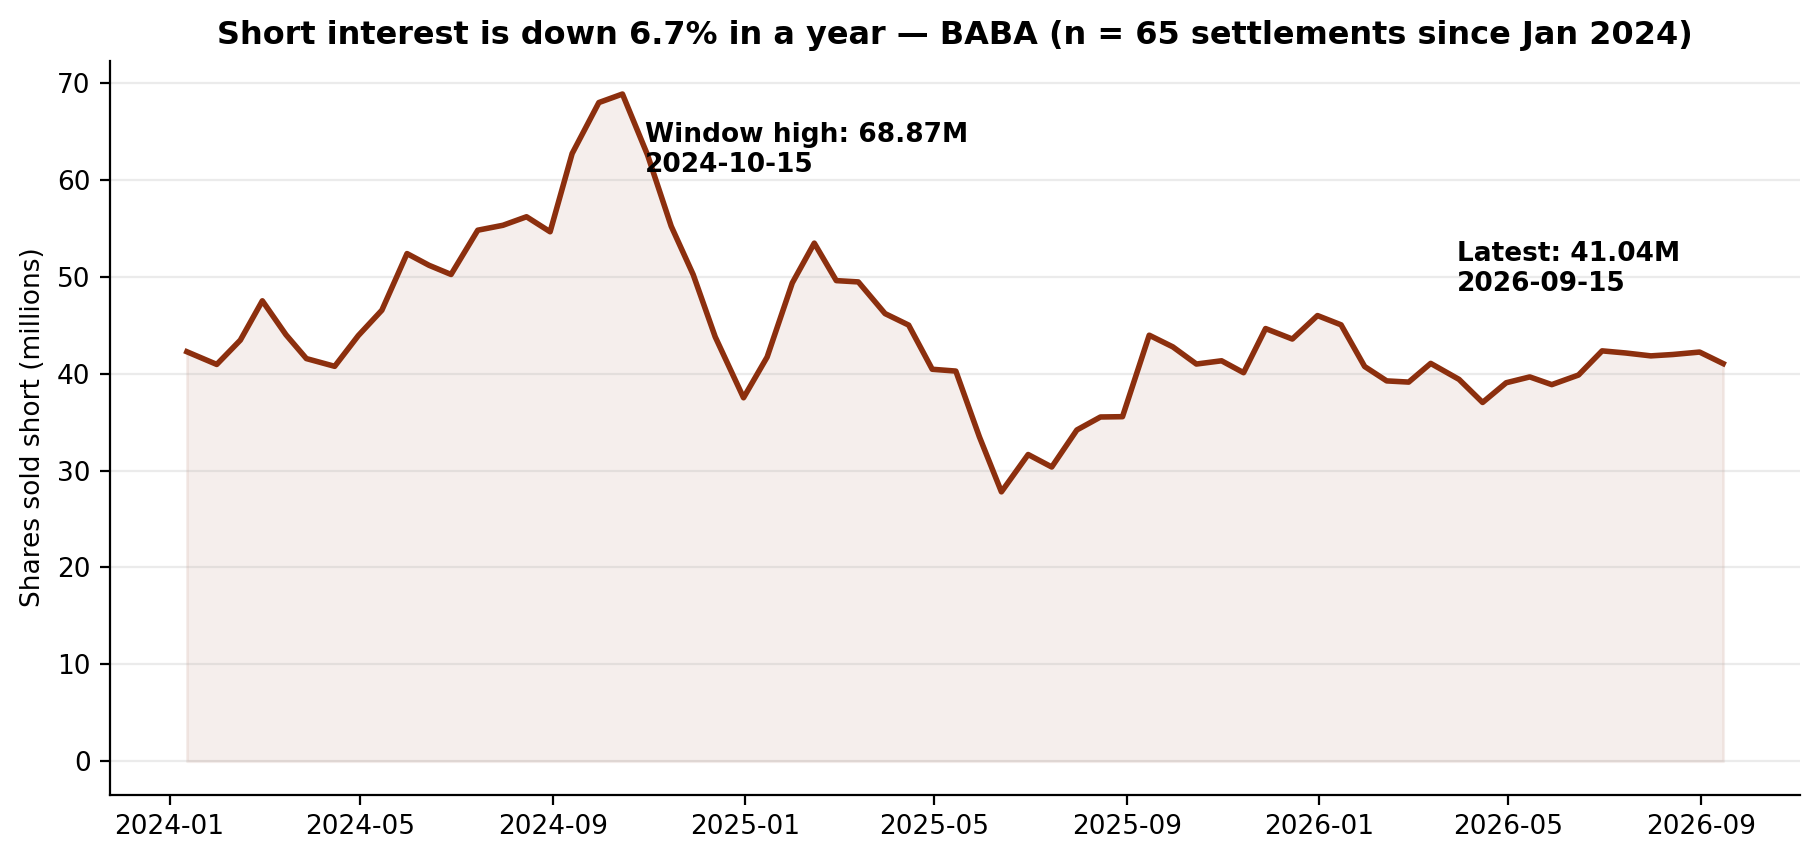
The recent settlements run 42,139,456 on July 15, then 41,841,275, 41,983,108, 42,234,428 and 41,044,240. The series began at 40,453,463 shares on January 15, 2021 — almost exactly where it stands now — and its lowest reading is 27,805,268 on June 13, 2025. Days-to-cover of 5.41 is the one elevated reading here: the borrow equals more than five days of recent average volume.
The gap, stated plainly
The registers describe a stock the filings crowd trimmed without leaving. Nine of 83 tracked superinvestors hold Alibaba, but 72.4% of that cohort is Dodge & Cox alone, the top three are 94.2% of it, and its share count fell 7.27% in a quarter when the price fell 23.5%. The full market moved further: filers fell 8.57% to 1,227. The 5% register is a single name reducing: SoftBank's amendments run from 8.0% to 3.3%, and nothing there is newer than May 2025. Insiders run the other way, on a small base: three purchases totalling $25,691,200.00 against 13 sales totalling $85,847,273.73 — but all three purchases sit in the last 90 days, where they outweigh sales of $13,563,303.73. Congress registers two sales and nothing in the Senate file. And the borrow, at 41,044,240 shares and 2.21% of the reported share count, is down 6.7% in a year. One plausible reading is that sponsorship is narrowing to a few large holders while the register as a whole steps back from a falling price — with the only register adding, insiders, doing so in the most recent window. The record supports each clause separately; it does not say which register is right.
What would change the picture
Nothing above is a recommendation. It is a record. These are the filings that would change the description:
- 1. The 2026Q3 13Fs (filing window closing mid-November 2026). Q3 contains the August insider purchases. Whether Dodge & Cox's 9,957,970 shares survived it, whether Appaloosa's trimmed 2,000,000-share position rebuilds or exits, and whether the holder count moves off nine, is the whole lens: at nine holders with 94.2% in three hands, one filer rewrites this register.
- 2. Insider filings after October 2 — in either direction. Three purchases totalling $25,691,200.00 stand against 13 sales totalling $85,847,273.73 in the parsed record, with the last 90 days running $25,691,200.00 of purchases against $13,563,303.73 of sales. A further purchase would extend a buy column that exists only in the most recent window; one-sided selling would close it.
- 3. Any new 13D/G filing, from anyone. The 5% register holds two SoftBank amendments and nothing newer than May 15, 2025 — 8.0% as of December 2024, then 3.3% as of March 2025. A fresh SoftBank row, a new reporter above 5%, or a first 13D would restart a silent register.
- 4. The next short-interest settlements after a flat year. The borrow stood at 41,044,240 shares on September 15, down 6.7% in a year, 46.9% below the October 31, 2022 peak of 77,249,322, but with days-to-cover of 5.41. The next settlements show whether borrowers treat this level as a floor: FINRA publishes biweekly.
- 5. A first congressional purchase, from anyone. The record holds two sales, no purchases and no Senate record at all. One purchase — in either chamber — would give this register a second direction.
Until one of those prints, the record describes a stock held by nine of our 83 tracked superinvestors — 13,751,597 shares, 72.4% of them one Dodge & Cox position — which 115 more institutions exited than entered in Q2, whose largest historical 5% holder cut its reported stake from 8.0% to 3.3%, whose insiders bought more than they sold in the last 90 days, and whose borrow, at 41,044,240 shares, has fallen 6.7% in a year to 2.21% of the reported share count.
Related reading: Twelve of 83: Pershing Square's New Position Is 54.8% of the Superinvestors' Uber Stake. Its CEO Bought Shares in September. — Filing Tape #25; Two of 83: The Superinvestors Hold Just 1,571,240 SoFi Shares. Short Interest Is 14.63% of the Share Count. — Filing Tape #24; Zero of 83: The Superinvestors Aren't in IREN — Filing Tape #1. Alibaba's own page: Alibaba Group Holding (BABA) on GetCoattail.
Methodology and data notes
- Superinvestor lens: 83 managers collected directly from SEC EDGAR Form 13F (managers_13f collection), positions as of June 30, 2026; Alibaba identified by CUSIP 01609W102. Nine distinct managers hold a long position totalling 13,751,597 shares; all nine reported rows are long (no put or call rows). Direction counts across the nine long holders: 1 new, 3 increased, 4 decreased, 1 unchanged. The largest holder's share of the cohort is 9,957,970 / 13,751,597 = 72.4%; the top three holders total 94.2%. Quarter-to-quarter cohort totals (14,829,757 shares at March 31; 13,751,597 shares at June 30; change −7.27% = (13,751,597 / 14,829,757) − 1) are from the site pipeline's holdings files on the same CUSIP basis in both quarters, and the pipeline's second-quarter total matches the EDGAR collection's long total exactly (difference of 0 shares), so no collection difference needs reporting for this name.
- Full-market lens: SEC Form 13F Data Sets full-market aggregation (the fixtures underlying our 2026Q1–Q2 market tables). Holders = distinct filers reporting the CUSIP; 1,214 of the 1,227 reported long positions. Reported-value caution: the aggregate value ($36,618,243,340 over 230,788,192 shares) implies ≈$158.67 per share against a June 30, 2026 close of $95.98 in our price file, a gap of 65.3%. The aggregate sums the VALUE of every information-table row — including put and call option rows — while the share count covers long common-stock rows only, so we headline filer and share counts and label dollar values "reported."
- Insider lens: full-parse Form 4 aggregation (agg_by_ticker), record as of October 2, 2026 (36 filings). Sale and purchase counts are transaction-code counts (S and P) in non-derivative rows; grants and exercises are not counted as purchases, and one filing can contain many transaction rows. Purchase transactions total three across the parsed record (1,790,000 shares, $25,691,200.00, two buyers), one of them recorded as an officer purchase ($4,984,000); all three fall within the most recent year and within the last 90 days, so the record's one-year and all-time windows are identical (36 filings). Sale transactions total 13 across the record (2,013,044 shares, $85,847,273.73, five sellers), all 13 recorded as officer sales. In the 90 days through October 2, 2026: three purchases, 1,790,000 shares, $25,691,200.00, two buyers; four sale transactions, 999,971 shares, $13,563,303.73, three sellers. The site's insider aggregate (compiled as of October 10, 2026) records the same 90-day figures — three purchases, four sale transactions and $25,691,200.00 of purchases against $13,563,303.73 of sales: it matches the full-parse figures exactly, and we report the match as observed. The aggregate additionally flags a chief-executive purchase in the window and dates the most recent purchase August 25, 2026. Alibaba is a foreign private issuer; this lens counts only filings present in our full parse.
- 13D/G lens: full-parse SC 13D/G aggregation and parsed filings (2 filings matching CUSIP 01609W102 and issuer CIK 1577552, one reporting name in aggregate), filings through May 15, 2025. SoftBank Group Corp.'s rows (1,526,790,344 shares at 8.0% as of December 31, 2024; 630,790,344 shares at 3.3% as of March 31, 2025) are reported as separate rows, as filed; they are not summed. The aggregation's totalSharesReported field (2,157,580,688 shares) sums the same reporter's successive amendments and is not used. Percentages and share counts are quoted exactly as reported in the respective filings, on the basis those filings use. A full-text check for the issuer's name across the parsed archive returns only these two filings about Alibaba's own stock; other matches are filings in which Alibaba appears as a reporter on another issuer, and are excluded.
- Congress lens: Senate PTR archive and House PTR archive as maintained on this site, combined record as of October 3, 2026 — no purchase transactions and two sale transactions, no most-recent purchase date and no party information. The House aggregate (as of October 3, 2026) carries the same record in full; the Senate aggregate (as of October 1, 2026) carries no Alibaba record, and we report that absence rather than omitting the chamber. The combined aggregate's member-count field reads 0 alongside the two recorded sales; we report the transaction counts as recorded and flag the field rather than adjusting either figure. Congressional disclosures report value ranges, so where this lens has data it records direction and counts only.
- Short interest lens: FINRA Equity Short Interest files (biweekly settlement dates), collected directly from FINRA's public distribution; the Alibaba series covers 137 settlements from January 15, 2021 to September 15, 2026. The maximum of the full collected series is 77,249,322 shares on October 31, 2022, so the latest reading of 41,044,240 shares on September 15, 2026 sits 46.9% below the peak ((41,044,240 / 77,249,322) − 1) and 6.7% below the September 15, 2025 reading of 43,975,803; the change from the prior settlement (42,234,428 shares on August 31, 2026) is −2.82%, and the change from the June 30, 2026 settlement (42,358,223 shares) is −3.1%. The latest row's prior-settlement field (42,234,428) matches the prior settlement file's reported figure exactly. FINRA publishes each settlement about two weeks after the fact. The share-count ratio uses the fundamentals file's share count of 1,858,037,427 shares outstanding as of March 31, 2026; that file carries a general foreign-private-issuer note that its share count is recorded on an ordinary-share basis while its price is on an ADS basis, so the 2.21% ratio is computed on the file's recorded count, as reported.
- Fundamentals note: our fundamentals collection carries Alibaba's fiscal-2026 revenue of $148,401,000,000, fiscal-2026 net income of $15,018,000,000 and fiscal-2026 assets of $276,830,000,000. The market value of about $203.01 billion uses that file's October 6, 2026 price ($109.26) and reported share count, subject to the same foreign-private-issuer note.
- Prices: our own daily-close file for Alibaba through October 2, 2026 ($105.85 close, −27.8% year to date on that file; 252-session closing high $189.34 on October 2, 2025; 252-session closing low $94.81 on June 26, 2026; closes of $125.46 at March 31, 2026 and $95.98 at June 30, 2026, a second-quarter change of −23.5%; change from June 30 to October 2 of +10.3% ((105.85 / 95.98) − 1)). The drawdown from the 252-session closing high is −44.1% ((105.85 / 189.34) − 1), and the gain from the 252-session closing low is +11.6%.
- Market context sources: June-quarter 2026 results (revenue of RMB 268.95 billion, up 9% year over year; net income of RMB 10.44 billion, down 75%; AI Cloud and Compute Services revenue of RMB 48.44 billion, up 45%, with adjusted EBITA of RMB 5.60 billion, up 133%, and capital spending of RMB 67.70 billion, up 75%) — earnings coverage of the fiscal-2027 first-quarter report, checked October 10, 2026, summarised in our own words; latest-quarter revenue of $39.64 billion, up 8.6%, against a $39.52 billion consensus, and earnings per share of $1.26 against a $1.94 consensus — MarketBeat figures carried in market coverage, checked October 10, 2026; analyst targets (MarketBeat average target of $186.33 from 20 analysts as of October 2, 2026; Jefferies target raised to $192 on October 8, 2026) and an October 5, 2026 close of $110.80, up 4.68% — market coverage, checked October 10, 2026; an October 2, 2026 closing price of $105.91 in market reporting, against $105.85 in our price file for the same date; search-attention ranking (Alibaba nineteenth at 823,000 average monthly Google searches on Insider Monkey's 20-name list, with the higher-ranked names all previously covered or skipped in this series, and AltIndex's 24-hour Reddit top ten consisting entirely of previously covered or skipped names) — Insider Monkey and AltIndex, checked October 10, 2026. Figures we could not confirm against two sources were left out.
- Alibaba is in the GetCoattail stock-page universe: Alibaba Group Holding (BABA) stock page. Series data: baba_lens_data.csv · baba_short_interest_series.csv. Earlier audits: Uber Technologies · SoFi Technologies · IREN.
This article describes public filings as of the dates stated. It is not investment advice and makes no recommendation. Filings lag reality: 13F positions are as of June 30, 2026, and later trading is not yet public.
Revision history
- v1.0 — October 10, 2026: first publication.