The suspicion writes itself. A member of the Financial Services Committee buys bank stocks. A member of the health committee buys a drugmaker. They hear things in briefings and markups that the rest of us read about later, so their committee-adjacent trades should be the best-informed trades in the disclosure record. We tested that suspicion on the entire record we hold — every filer in the Senate's electronic disclosure system and every House filer in the Clerk's index whose reports we can parse — rather than on a watchlist of famous traders. The answer comes in two parts, and neither flatters the suspicion: members rarely buy inside their own jurisdiction at all, and when they do, the stocks go on to trail the index.
- 10,008 purchases were disclosed in the window (filed Oct 1, 2021 – Sep 30, 2026, duplicates removed). 7,141 could be classified by industry; 406 (5.7%) were inside the buyer's own committee jurisdiction, judged by the seats held on the trade date. The 145 filer names in the window all resolved to a member; 122 members have classifiable buys.
- Baselines: if members bought the classified stock universe at random given their seats, 9.2% of buys would land inside (z = −11.1 against the observed 5.7%). If they bought the industry mix members actually buy, 6.2% would — the observed share sits borderline below that too (p = 0.09, permutation p = 0.03).
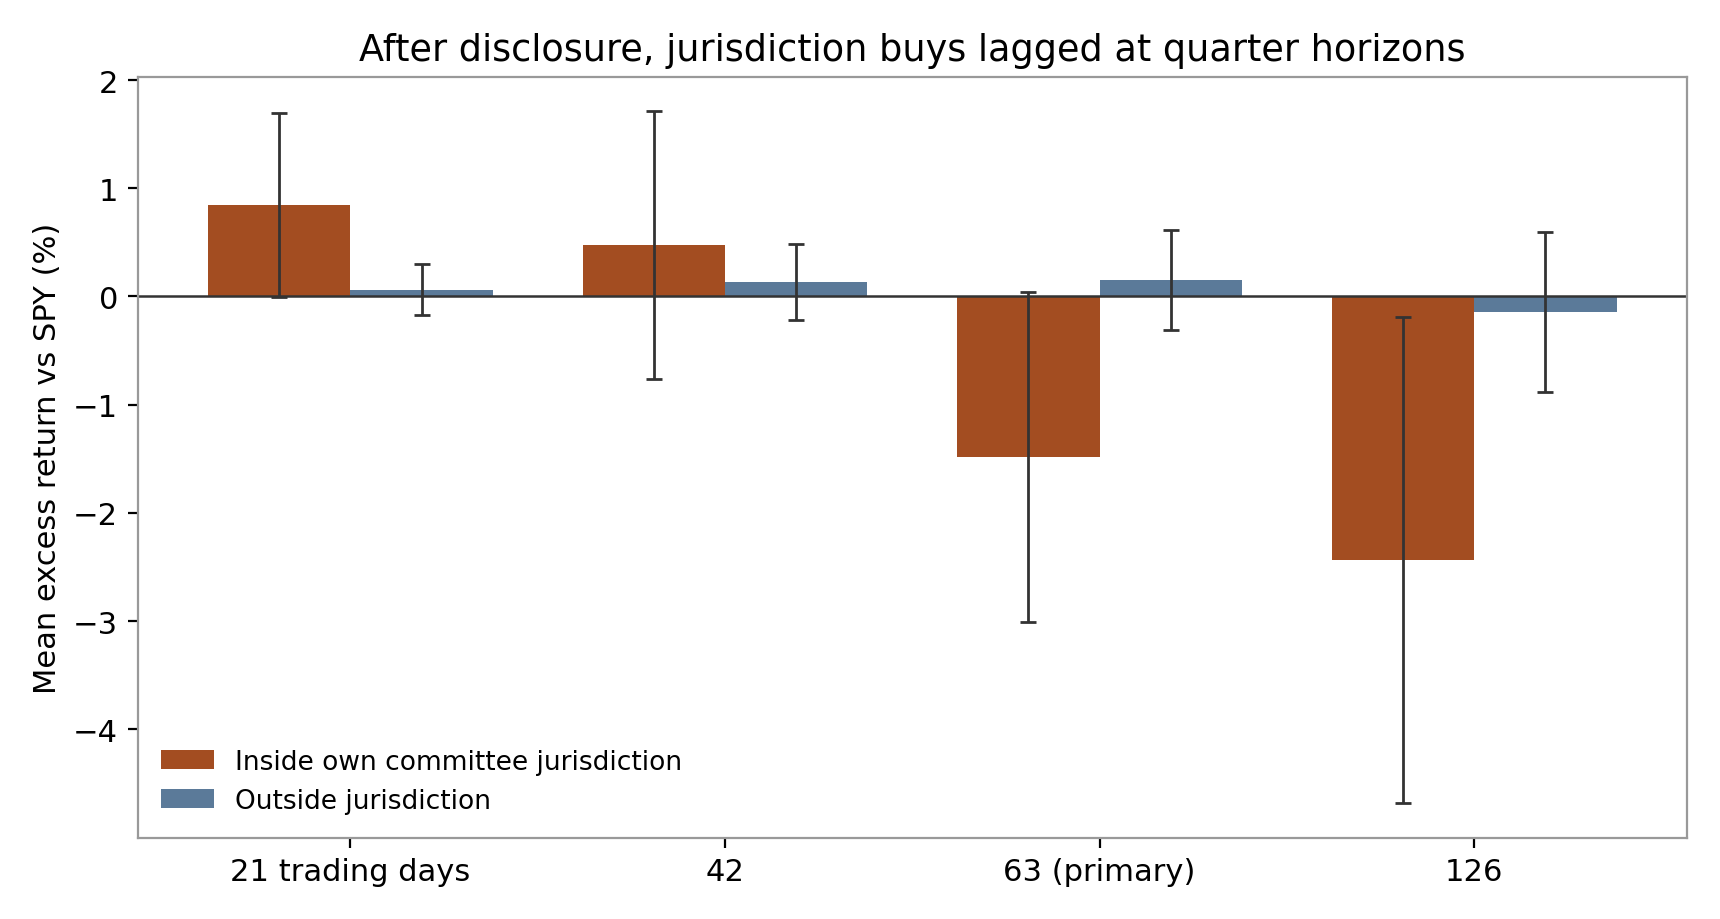
- At 63 trading days after disclosure, the 354 scorable inside buys averaged −1.48% versus SPY (median −2.56%, win rate 40.1%). Members' other buys averaged +0.15%. The gap, −1.63 points, has a naive interval of −3.22 to −0.04 — and a member-clustered interval of −4.59 to +1.90, which includes zero.
- The pooled gap is a House story. Senate inside buys (75 scored) averaged +3.48%; House inside buys (279 scored) averaged −2.81%. Both chambers' difference intervals include zero once clustered by member.
What counts as buying inside
A buy counts as inside when the stock's industry (its SIC code, rolled into nine groups: finance, energy, health, education, defense, agriculture, transport, telecom, mining) falls under a committee the buyer sat on when the trade happened. Thirteen standing committees map to industries — Financial Services and Banking to finance, Armed Services to defense, HELP to health and education, Energy and Commerce to energy, health and telecom together, and so on; the mapping is printed in full in the methodology. Committees without a direct industry remit (Appropriations, Judiciary, Ethics, Intelligence) map to nothing. Three design choices do the heavy lifting, and each one is the stricter version of an easier alternative. First, classification is period-correct: a trade from the 117th Congress is judged against 117th-Congress rosters, not against whoever holds the seat today — assignments turn over, and judging a 2021 trade by a 2026 roster would invent matches that never existed. Second, filers are matched to members by bioguide ID through name variants, never by raw name strings. Third, entry is the close of the first trading day after the disclosure landed — the first price at which anyone outside the member's household could have copied the trade. The trade-date entry, which assumes knowledge nobody had, appears only as a labeled look-ahead reference.
Finding one: they mostly don't buy inside
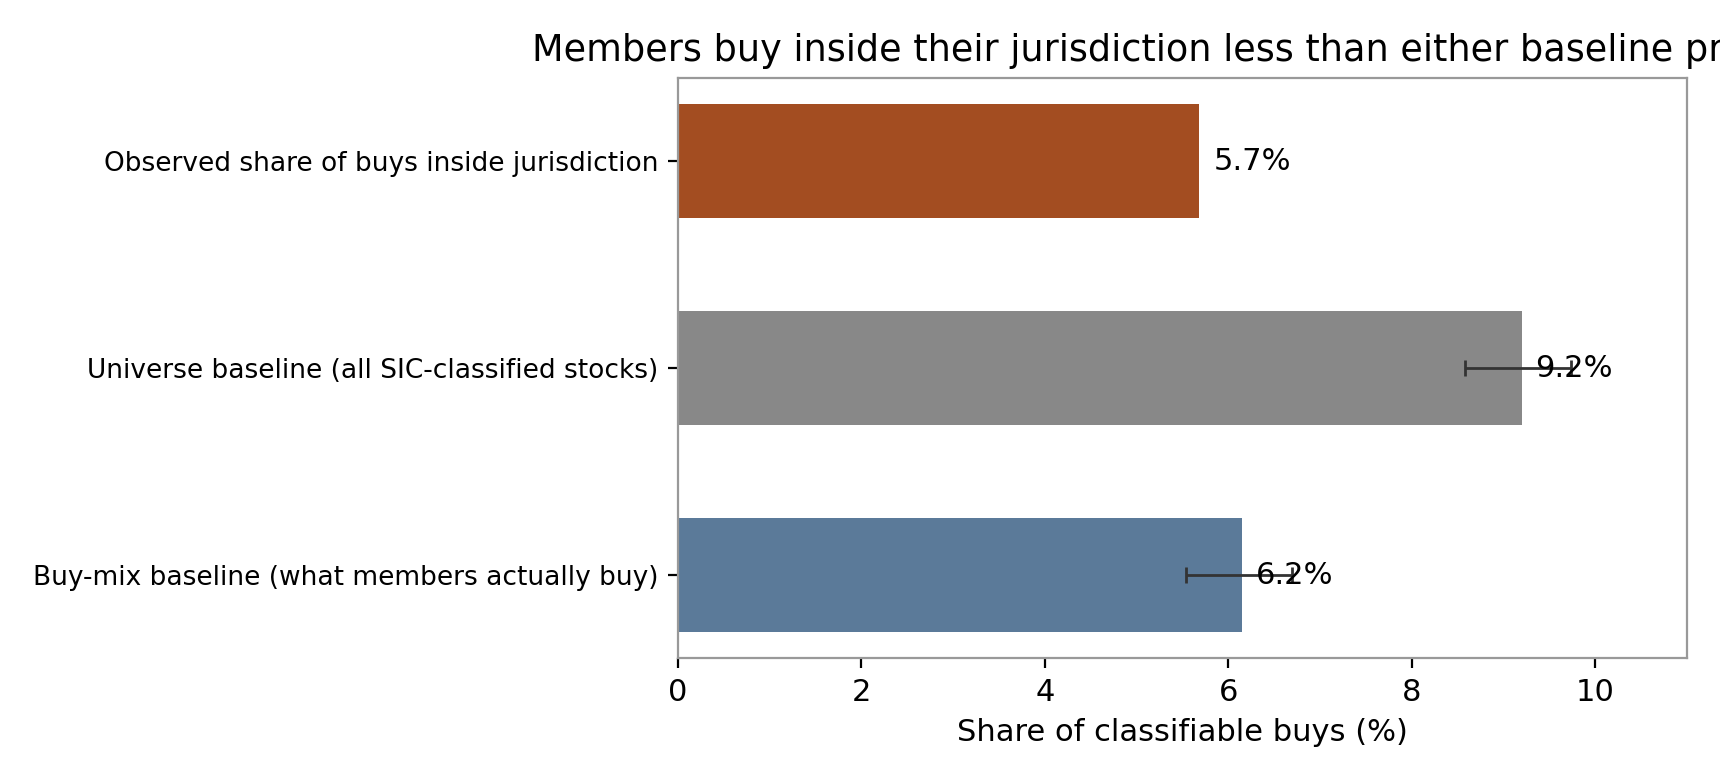
The first surprise is how little committee-adjacent buying there is. Senators land inside 10.6% of the time (109 of 1,031 classifiable buys); House members, 4.9% (297 of 6,110). The share rose across the window — 3.6% of classifiable buys in 117th-Congress trades, 6.0% in the 118th, 6.3% in the 119th — without approaching either baseline. What fills the inside bucket is mostly one committee: of the 354 scorable inside buys, 174 came through House Financial Services and 178 are financial stocks outright; health adds 68 (Senate HELP 44, House Energy and Commerce 43 of them). Education, the smallest mapped remit, contributes two trades in five years. So "buying inside" in practice means finance-committee members buying financials, plus a health tail — a narrow behavior, not a Congress-wide habit. The shortfall against the universe baseline is not subtle (expected 657 inside buys at random, observed 406), and it says the popular picture — members systematically loading up on the industries they oversee — is not in this record. Against the tougher baseline, the mix of what members actually buy, the shortfall shrinks to borderline: members buy financials and health stocks less than their seats would suggest, but only just.
Finding two: the inside buys lagged
| Horizon | Inside (mean · median · win) | Outside (mean · median · win) | Difference (Welch 95% · member-clustered 95%) |
|---|---|---|---|
| 21 trading days | +0.85% · +0.32% · 50.9% (n = 387) | +0.06% · −0.46% · 47.7% (n = 6,270) | +0.78pp [−0.10, +1.66] · [−0.86, +2.51] |
| 42 trading days | +0.48% · −1.02% · 46.5% (n = 383) | +0.13% · −0.95% · 46.4% (n = 6,186) | +0.34pp [−0.94, +1.63] · [−1.71, +2.88] |
| 63 trading days (primary) | −1.48% · −2.56% · 40.1% (n = 354) | +0.15% · −1.36% · 46.0% (n = 5,895) | −1.63pp [−3.22, −0.04] · [−4.59, +1.90] |
| 126 trading days | −2.43% · −2.85% · 42.7% (n = 342) | −0.14% · −2.56% · 45.1% (n = 5,531) | −2.29pp [−4.65, +0.07] · [−6.20, +2.14] |
At the horizons where information should show up as drift, there is none — the point estimates run the wrong way. Inside buys trail the index over the following quarter (−1.48% at 63 days, their own interval −3.00 to +0.04) and trail further by six months (−2.43%, interval −4.68 to −0.19). The typical inside buy did worse than the mean suggests: the median lost 2.56 points to SPY, and only four in ten beat the index. The short horizons are the only friendly ones — +0.85% at three weeks, a difference of +0.78 points over outside buys — and even those intervals straddle zero. A real informational edge does not usually flip sign between week three and month three; noise does.
Why we don't call the gap real
The one number a careless write-up would headline is the 63-day gap's naive interval: −3.22 to −0.04, excluding zero by four hundredths of a point. It treats 354 trades as 354 independent observations. They are not. The inside buys come from just 40 members, and across the whole study the two heaviest traders alone (Josh Gottheimer and Gilbert Ray Cisneros, Jr.) account for 1,138 of the 6,249 scorable buys — trades that share one member's habits, timing and account manager are one observation wearing many coats. Resampling members instead of trades (a cluster bootstrap, 4,000 draws) widens the 63-day gap's interval to −4.59 to +1.90 points, with 84.5% of resamples at or below zero. That is the honest summary of the pooled result: the estimate leans negative — inside buys did worse — and the data cannot separate that lean from no difference at all. We apply the same ladder everywhere in this piece: where the clustered interval includes zero, the claim is "no reliable evidence", whatever the point estimate says.
A House story, not a Senate one
| Chamber, 63 days | Inside (mean · median · win) | Outside mean | Difference (Welch 95% · clustered 95%) |
|---|---|---|---|
| Senate | +3.48% · +2.10% · 56.0% (n = 75) | +1.56% (n = 619) | +1.92pp [−1.29, +5.13] · [−1.28, +5.55] |
| House | −2.81% · −3.06% · 35.8% (n = 279) | −0.01% (n = 5,276) | −2.80pp [−4.61, −0.99] · [−6.31, +1.44] |
Split by chamber, the two halves of Congress point in opposite directions. Senate inside buys averaged +3.48% — their own interval (+0.55 to +6.41) clears zero, the only group mean in the study that does on the positive side — and at six months they still averaged +3.33%. But the Senate difference against senators' own outside buys (+1.92 points) cannot be separated from zero on 75 trades, clustered or not; the narrow four-committee mapping used in earlier Senate work (Banking, Energy, HELP-health, Armed Services) tells the same story louder: inside mean +3.67%, difference +2.06 points, clustered interval −0.09 to +6.80. The House is where the pooled negative comes from: 279 inside buys averaging −2.81% (own interval −4.56 to −1.07), a third of them beating the index, and −4.02% by six months. Even there, the difference against other House buys dissolves under member clustering (−6.31 to +1.44). Two chambers, two point estimates with opposite signs, zero differences that survive the honest interval: the average committee trade carries no measurable edge in either house.
Every other cut we ran
| Cut (63 days) | Inside n | Difference (Welch 95% · clustered 95%) |
|---|---|---|
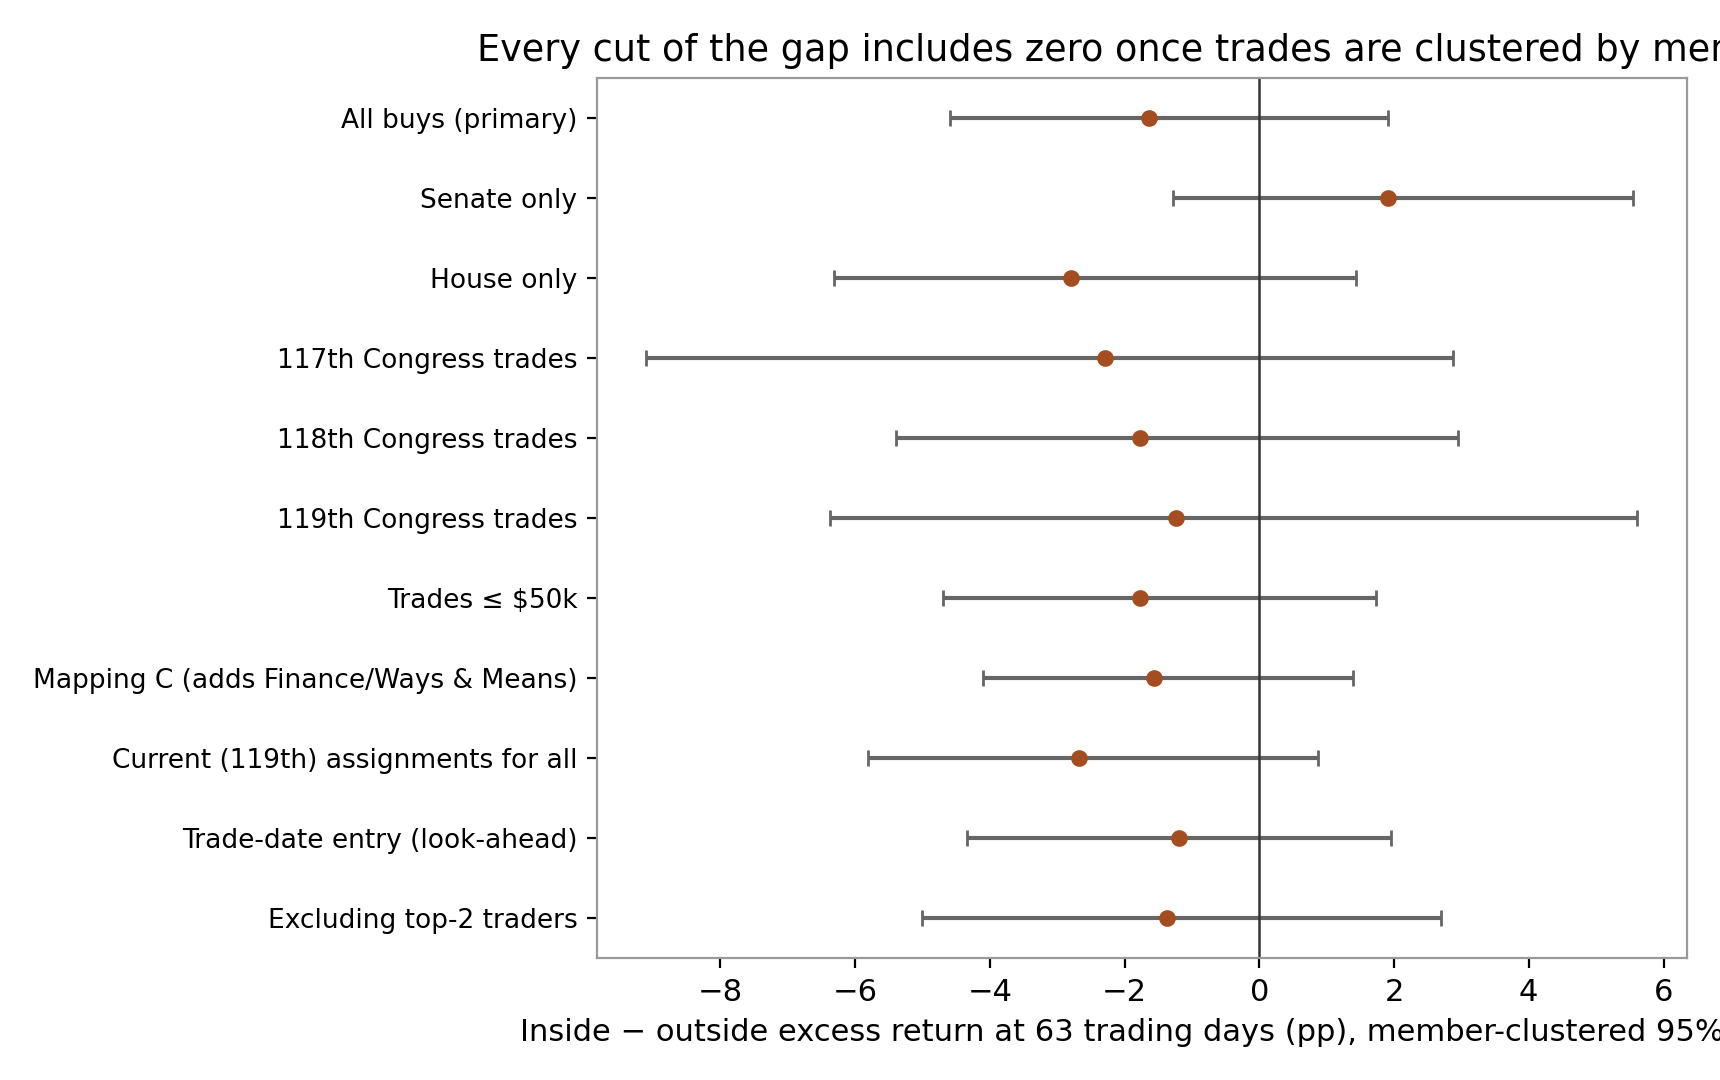
| 117th-Congress trades | 45 | −2.29pp [−7.05, +2.47] · [−9.10, +2.88] |
| 118th-Congress trades | 133 | −1.77pp [−4.16, +0.61] · [−5.40, +2.94] |
| 119th-Congress trades | 176 | −1.24pp [−3.64, +1.17] · [−6.37, +5.61] |
| Trades of $50,000 or less | 342 | −1.78pp [−3.39, −0.17] · [−4.70, +1.74] |
| Trades of $50,001–$250,000 | 11 | +6.12pp [−4.20, +16.43] · [−4.49, +40.35] |
| Disclosed within 30 days | 177 | −1.08pp [−3.38, +1.22] · [−5.24, +4.37] |
| Disclosed in 31–45 days | 85 | −1.91pp [−5.15, +1.33] · [−5.01, +1.02] |
| Disclosed after 45 days | 92 | −1.78pp [−4.83, +1.27] · [−6.75, +6.25] |
| Mapping C (adds Senate Finance, Ways and Means) | 409 | −1.56pp [−3.03, −0.09] · [−4.11, +1.39] |
| Current (119th) assignments applied to all trades | 332 | −2.67pp [−4.31, −1.04] · [−5.80, +0.88] |
| Trade-date entry (look-ahead reference) | 386 | −1.19pp [−2.79, +0.40] · [−4.34, +1.95] |
| Excluding the top-2 traders | 290 | −1.37pp [−3.09, +0.35] · [−5.01, +2.69] |
| Member-equal paired (37 members with both sides) | 37 members | −2.59pp [−6.89, +1.71] (t interval) |
No cut rescues an edge, and none manufactures one in the other direction either. The gap's point estimate is negative in all three Congresses, in small trades (which are nearly all of them: 342 of 354 scorable inside buys are $50,000 or less), under the wider mapping, under today's assignments, at the trade date itself, and with the two heaviest traders removed. Filing delay — the one place an information story might hide, since a member trading on committee knowledge might also file late — shows no gradient: the three delay bands' estimates sit within each other's intervals. And the cell where a big-bet story would live is empty: above $250,000, exactly one scorable inside buy exists in five years of disclosures. Whatever members do with real size inside their jurisdictions, the disclosure record does not contain it, and we say nothing about it.
Two case files bound the distribution. The best inside buy in the study belongs to Senator Markwayne Mullin, who sits on the HELP Committee: Eli Lilly, bought December 11, 2024 — and disclosed on August 12, 2025, eight months later. Even entering at that late disclosure, the stock beat SPY by 43.8 points over the next quarter. The worst is a timely one: Representative Josh Gottheimer of Financial Services bought Affirm on October 12, 2021 and filed within five weeks; it trailed the index by 67.1 points over the following quarter. One late-filed winner and one prompt loser, at the two ends of 354 trades, average out to the finding above: nothing systematic.
What this doesn't show
Averages acquit no one individually. This study cannot see a single well-timed trade, a sale ahead of bad news (we scored buys only), or information shared with someone whose trades never appear in a PTR. The mapping is coarse by construction: Energy and Commerce's remit covers most large-cap industries, so some "inside" matches are jurisdictionally true and informationally meaningless, while a member can hold real oversight knowledge of a company whose SIC code sits outside our nine groups. Roster snapshots are taken near each Congress's end, so mid-Congress committee moves, and the 412 buys by members missing from their trade-date Congress's roster, fall out of the study rather than into the wrong bucket. Amounts are disclosure ranges, not fills. None of that cuts toward an edge: every shortcut version of this test (current assignments, trade-date entry, naive intervals) was run, and the stricter version is the one in the headline — it is also the one whose interval includes zero.
Methodology
Data. Purchases from the Senate's electronic financial disclosure records (our canonical file: 2,295 reports, 16,719 transactions) and the House Clerk's financial-disclosure index for 2021–2026 with report text parsed from our document cache (476 scanned reports were unreadable and are counted as a coverage gap; our House backfill file ends in 2020 and contributes no reports to this window — verified). Filings dated Oct 1, 2021 – Sep 30, 2026; exact duplicates (same filer, stock, trade date and amount) removed once. Buys only; spouse and joint accounts are included as filed. 10,008 buys enter the waterfall; 144 had trade dates before the 117th Congress (no roster exists for them here) and 412 lacked a roster record for their trade's Congress, leaving 9,452 committee-judgable buys, of which 7,141 carry an SIC code (the rest are funds, ETFs and unclassified names). Rosters: congress-legislators committee-membership snapshots — 117th Congress as of Nov 29, 2022; 118th as of Dec 17, 2024; 119th current file — with subcommittee seats rolled up to parent committees. Industry: SEC SIC codes for 2,197 tickers, grouped as FIN 6000–6999; ENR 1220–1249, 1300–1399, 2900–2999; HLT 2833–2836, 3841–3845, 8000–8099; EDU 8200–8299; DEF 3484, 3489, 3721–3724, 3728, 3731, 3761, 3764, 3769, 3812; AGR 0100–0999, 2000–2099; TRN 4000–4799; TEL 4800–4899; MIN 1000–1499. Mapping A (primary): Agriculture (both chambers) → AGR; Armed Services → DEF; Financial Services / Banking → FIN; Education and Workforce → EDU; HELP → HLT + EDU; Energy and Natural Resources → ENR; Energy and Commerce → ENR + HLT + TEL; Natural Resources → MIN; Transportation and Infrastructure → TRN; Commerce (Senate) → TRN + TEL. Mapping C adds Senate Finance and House Ways and Means → FIN. Filer names resolve to bioguide IDs via recorded name variants (including former names) plus an era-uniqueness rule; a diminutive-prefix rule (Chris ↔ Christopher) closes the last case, and all 145 filer names in the window resolved.
Scoring and inference. Entry is the close of the first trading day after the filing date, using our split- and dividend-adjusted daily bars; SPY must trade on the same entry date. Horizons 21/42/63/126 trading days, 63 primary. Excess = stock return minus SPY return over identical dates. At 63 days, 6,249 of 7,141 classifiable buys scored (87.5%); attrition was balanced (inside 12.8%, outside 12.5% — price file missing 403, horizon incomplete 489). Group uncertainty is a t interval on the mean; difference uncertainty is printed both ways — Welch, and a bootstrap that resamples members (bioguide clusters, 4,000 draws, seed fixed) — and the conclusion ladder keys on the clustered interval. The share baselines compute, for each buy, the probability that a random classified stock (universe baseline) or a random classified buy (buy-mix baseline) would match that buyer's seat mask, and test the observed count against the resulting Poisson-binomial; the buy-mix baseline is also permuted 2,000 times. Robustness cuts (chambers, Congresses, amount bands by range lower bound, filing-delay bands, mappings B and C, current assignments, trade-date entry, excluding the two highest-volume traders, member-equal pairing) were specified with the design, not after the results. Every classified buy, with its committee match and scored returns, is published below. An independent re-implementation of the full pipeline — extraction, matching, classification, scoring, statistics — reproduced every number in this piece with zero mismatches.
Data download
All 7,141 classified buys with filer, bioguide ID, committee match, SIC group, filing delay, amount band and 21/42/63/126-day excess returns: signals_committee_jurisdiction_returns.csv
Revision history
Oct 17, 2026: First published.