The fails-to-deliver data comes from the National Securities Clearing Corporation's Continuous Net Settlement system: for every stock, on every trading day, the aggregate balance of shares that failed to be delivered and are still outstanding. The SEC publishes it in two files a month, roughly two weeks after the fact. A print here is one stock at one biweekly settlement — the same calendar as FINRA's short-interest file, which we scored in a companion study — and the balance is a stock, not a flow: fails that remain open, plus new ones, minus the ones that settled. We took 136 of the SEC's 138 semi-monthly files (May 2026's two files are listed on the SEC's page but return 404 — disclosed below), 7,900,699 rows in all, and kept the 1,624 tickers in our price universe: 220,455 stock-settlements.
A percentage band needs a floor in this data, because fail balances are small and twitchy: the median positive balance is 849 shares, and at tiny bases half of all prints "surge" by 50% or more. So a band requires at least 10,000 shares failed on both sides of the print, the previous settlement's balance present, no stock-split flag on the print or the next one, and the stock present in FINRA's file for the split flags and ratios. That classifies 17,783 prints: 424 stable balances (a move of −10% to +25%), 181 moderate jumps (+25–50%), 301 surges (+50–100%), 1,321 extreme jumps (+100% or more), 1,541 appearances from zero to at least 100,000 shares, and 14,015 collapses (a balance that at least halved). Entry is the close of the first trading day on or after settlement + 14 calendar days — the SEC releases the first half of a month at month-end and the second half around the 15th of the next month, so that is about when a reader could first act — and returns run 21, 42 and 63 trading days against SPY. Between 78% and 85% of each group could be scored at 63 days, at similar rates in every group, and the full scored list is published with this piece.
One structural fact shapes everything below: fail balances almost never sit still. The stable-balance baseline — a large balance that moved within ±25% over two weeks — occurred 424 times in five and three-quarter years, against 1,622 jumps of 50% or more and 14,015 collapses. Fails appear, and within a print or two they are mostly gone. The baseline's thinness is why the difference intervals below are wide even where the event groups are large; we print group means and differences side by side so it is clear which is doing the work.
- A fails surge on its own — the fail balance up 50% or more, whatever short interest did: 1,622 classified, 1,322 scored at 63 trading days. Mean excess return versus SPY: +0.97% (95% CI −1.15 to +3.42). Stable balances averaged +3.05%; the difference, −2.08 points, has an interval of −7.02 to +2.15.
- New appearances (balance from zero to 100,000+ shares): 1,541 classified, 1,306 scored, +0.58% (CI −0.75 to +2.04); difference versus stable balances −2.46 points (CI −6.87 to +1.39).
- The overlap is a sliver: only 114 of 1,622 fails surges (7.0%) coincided with a short-interest surge in the same print, and only 2.6% of short-interest surges came with a fails surge. Fails-only surges averaged +1.43% (CI −0.75 to +4.00).
- The combination separated: after the 114 both-surge prints (93 scored), stocks averaged −5.14% (CI −9.46 to −0.93), trailed stable balances by 8.18 points (CI −14.43 to −2.47), and beat SPY 36.6% of the time.
The headline: on its own, a fails spike was followed by nothing
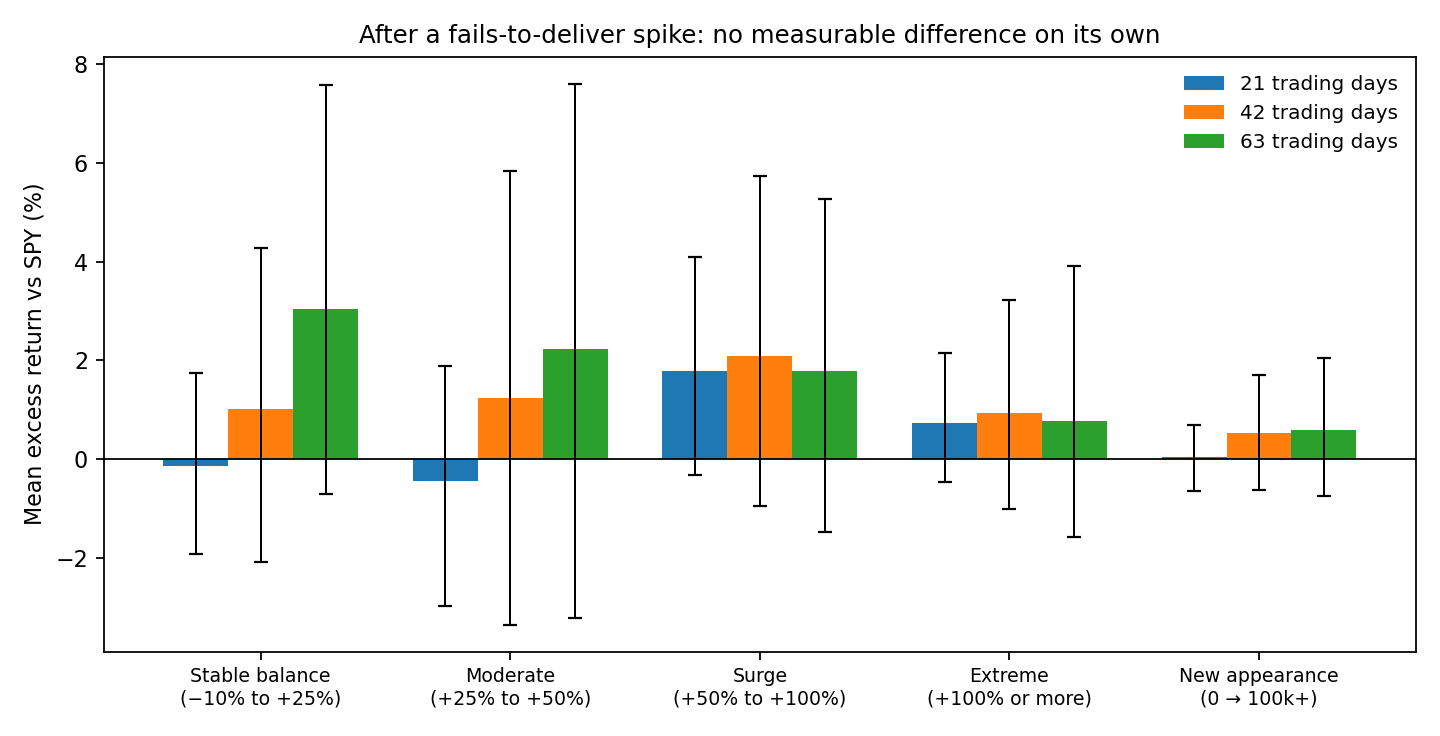
| Group | 21 days | 42 days | 63 days |
|---|---|---|---|
| Stable balance (n = 347 at 63d) | −0.13% [−1.93, +1.74] | +1.02% [−2.08, +4.28] | +3.05% [−0.70, +7.57] |
| Moderate (+25–50%) | −0.44% [−2.98, +1.89] | +1.25% [−3.35, +5.84] | +2.23% [−3.21, +7.61] |
| Surge (+50–100%) | +1.78% [−0.32, +4.09] | +2.10% [−0.96, +5.74] | +1.78% [−1.47, +5.26] |
| Extreme (+100% or more) | +0.74% [−0.47, +2.15] | +0.93% [−1.01, +3.23] | +0.78% [−1.57, +3.90] |
| New appearance (0 → 100k+) | +0.03% [−0.65, +0.70] | +0.53% [−0.62, +1.70] | +0.58% [−0.75, +2.04] |
Read as differences against stable balances, the 63-day column is −0.82 points for moderate jumps, −1.27 for surges, −2.26 for extreme jumps and −2.46 for new appearances — every interval wide, every interval including zero. At 21 days the combined surge difference is +1.06 points (interval −1.07 to +3.18), the tightest bound in the study: whatever a fails spike means, the market does not spend the next month repricing it by much in either direction. The typical stock trailed the index whatever the fails did — median 63-day excess was −2.02 points after fails surges and −0.88 after stable balances; fails-surge stocks beat SPY 43.5% of the time. And entering at settlement, two weeks before anyone outside the clearing system could see the number, changes nothing: the surge group averaged +0.96% (interval −1.17 to +3.32), a difference of −1.66 points whose interval also includes zero. The information was not hiding in the lag.
The collapse group deserves a sentence because its raw mean looks alive: after a balance at least halved, stocks averaged +1.14% with an interval (+0.49 to +1.87) that excludes zero. Against stable balances, though, collapses differ by −1.90 points (interval −6.57 to +1.97), which does not — and in the level test below, prints with zero fails averaged +0.37% too. A resolving fail balance is what an ordinary print looks like in this universe and window; the positive mean is the background, not a signal.
Two signals that mostly ignore each other
Because the fails data and the short-interest data share a calendar, we could ask whether a fails surge is just a short-interest surge in a settlement costume. It is not. Of the 1,622 fails surges, 1,508 had no short-interest surge in the same print; of 4,412 short-interest surges in the same classification pool, only 2.6% came with a fails surge. Fails measure a settlement failure, not a position — the SEC itself notes that fails arise from long sales and market-making as well as short sales. Which is what makes the sliver of overlap worth its own section: when the position data says the shorts piled in and the settlement system says shares then failed to arrive, the print describes something narrower than either series alone — a crowded trade that strained delivery.
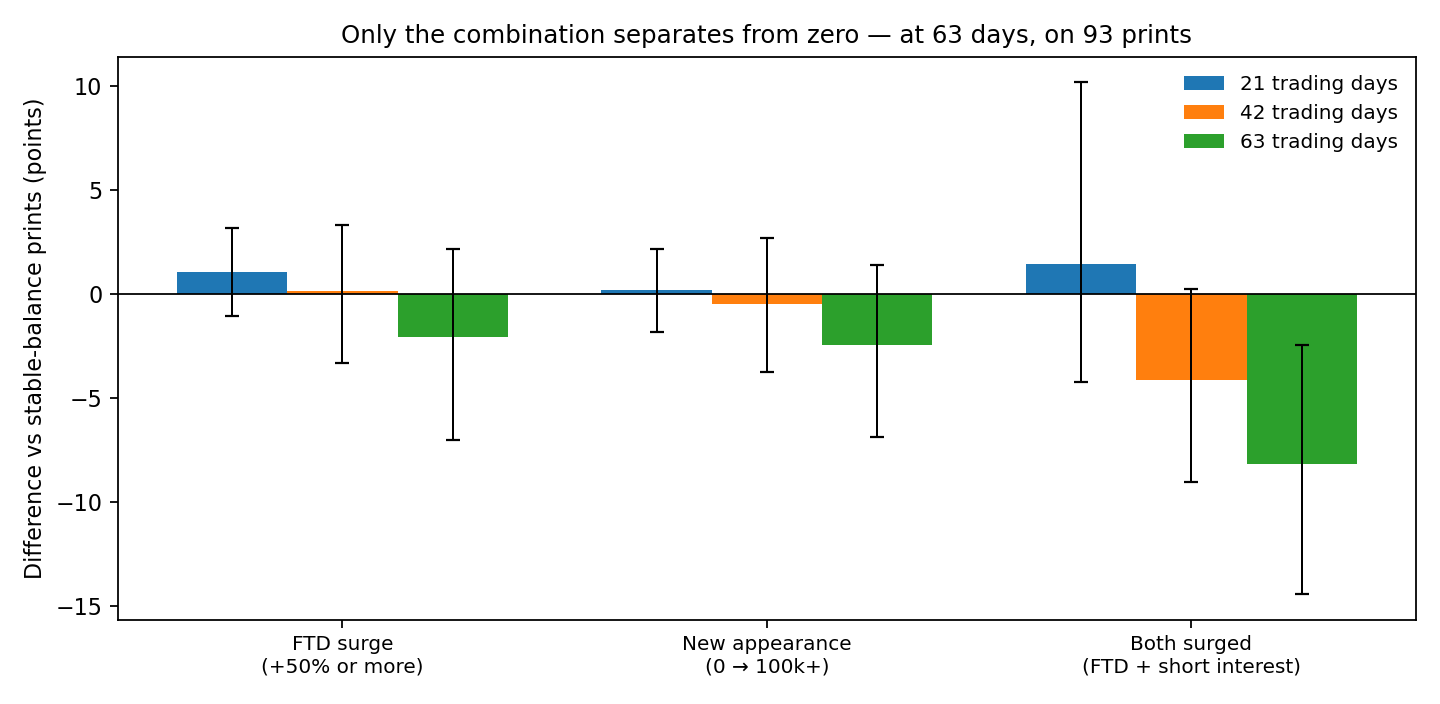
The one combination that separated
After the 114 both-surge prints — 93 of them scorable at 63 days — the average stock trailed SPY by 5.14 points over the following quarter and trailed stable-balance prints by 8.18 points, interval −14.43 to −2.47 (issuer-cluster bootstrap, 2,000 resamples: the same test that returns zero everywhere else in this piece). The shape matters. At 21 days there is nothing: the difference is +1.45 points (interval −4.22 to +10.18). At 42 days it is −4.12 (interval −9.04 to +0.22, just touching zero). By 63 days it is −8.18. That is a slow bleed, not a squeeze snap-back and not a one-week air pocket — consistent with a crowded position being ground down, and inconsistent with the delivery failure mechanically forcing buy-ins, which would show up fast and positive.
Two checks lean the same way. Entering at settlement instead of at publication makes it slightly worse, not better (−6.32% mean, interval −10.60 to −2.03; difference −8.94, interval −14.55 to −3.55), so the effect is not born in the publication lag. Dropping 2021, the meme-stock year, leaves a difference of −7.27 points (interval −13.88 to −1.09) on 78 scored prints, so it is not one episode. The prints are spread across all six years — 32 in 2021, 31 in 2022, 17 in 2023, 14 in 2024, 10 in 2025, 10 in 2026 — and 69 tickers, and the most frequent are ETFs (VTEB five times, COPX and FNDF four each), where fails also arise from creation-and-redemption plumbing. That last fact is one more reason to size the claim honestly: in a family of 24 difference cells, exactly one excludes zero, and chance produces a cell like that sometimes. A cell that survives the look-ahead entry, survives removing its most suspicious year, and grows with the horizon instead of evaporating is the kind we report — as what it is: 114 prints of evidence, not 1,622 of proof.
The level leaned; persistence did nothing
The change is not the only way to read fails. Across every print where short interest was at least 100,000 shares — 193,565 observations; prints repeat biweekly and windows overlap, so the cluster bootstrap carries the uncertainty — we sorted by how large the fail balance was relative to the short position itself. Fails are usually a rounding error next to the position: balances reaching 10% of shares short are a roughly 1% tail, 836 prints. That tail leaned down: −1.63% at 63 days (interval −3.87 to +0.65), 2.00 points below zero-fail prints (interval −4.27 to +0.44), and the date-matched gap was nearly identical at −2.03 points. The interval includes zero, so this is a lean, reported as one — the same standard we applied to days to cover in the short-interest study.
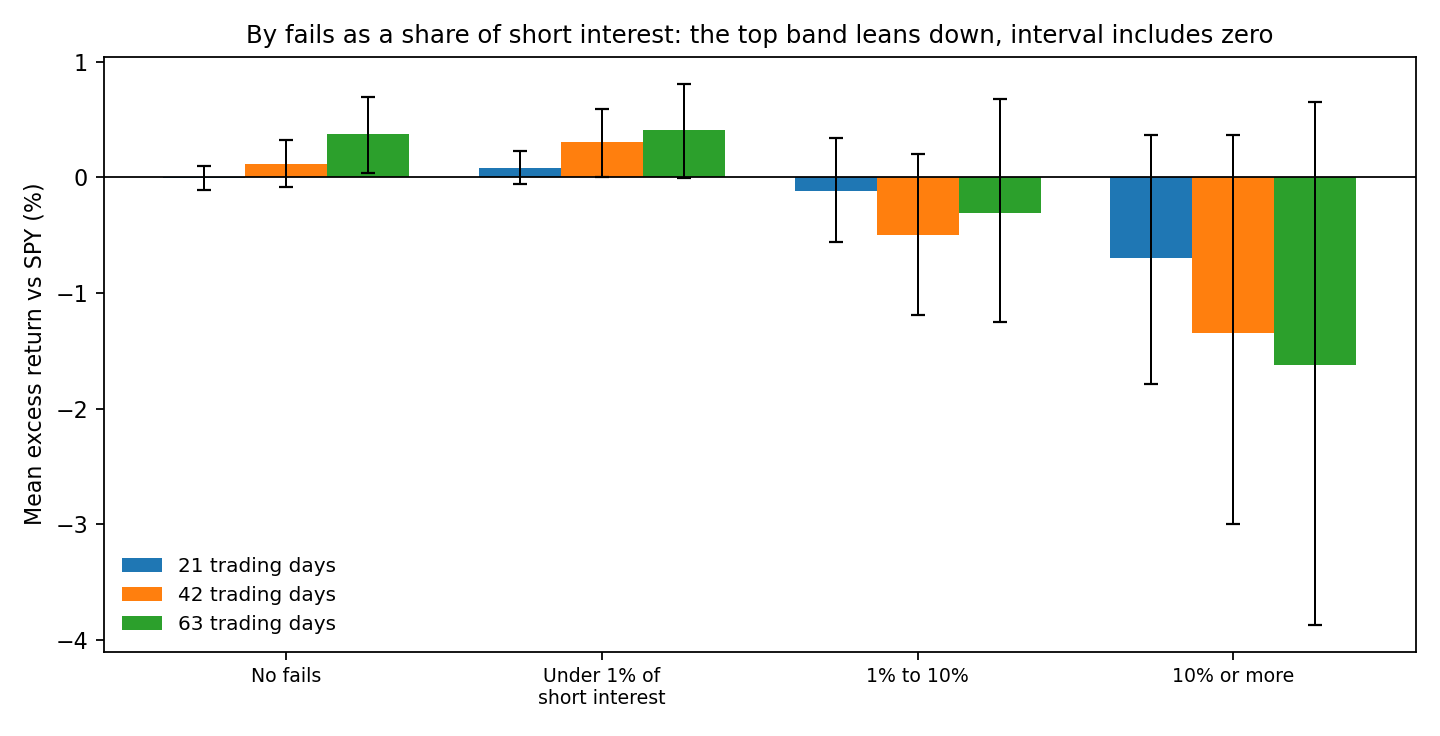
Persistence was flatter still. Balances of at least 10,000 shares that had already persisted for four or more consecutive settlements (891 prints) differed from first appearances (12,910 prints) by −0.43 points at 63 days, interval −4.60 to +4.67. A fail balance that refuses to clear is, on this evidence, neither a warning nor an all-clear; it behaves like a property of the stock that is already in the price, or never was.
Two defects in our own collection, disclosed
First, the collection nearly shipped broken. The SEC's zip archives name their inner data file with a '.txt' extension in the early years and without one from around May 2022. Our first collector pass filtered on the extension and silently dropped 89 of 136 files, understating the dataset at about 2.9 million rows. The raw archives were untouched on disk, so the fix was a filter change and a re-parse — 7,900,699 rows — and the panel builder carries the same fix so the pipeline cannot reintroduce it. Every number in this piece comes from the corrected build. Second, two files are simply missing: the SEC's download page lists May 2026's two halves (1.22 MB and 1.21 MB), but the files return 404 at their standard addresses. The May 15 and May 29, 2026 settlements therefore have no fails data here — 3,266 panel cells — and prints chained to them drop out of the change test. We disclose the hole rather than fill it with a stale prior balance.
Methodology
Data. SEC Fails-to-Deliver semi-monthly files, collected directly from sec.gov (136 of 138, January 2021 – September 2026; May 2026 missing at the source, above). Each row is one security on one date: the aggregate fails-to-deliver balance outstanding in the NSCC's Continuous Net Settlement system, as the SEC describes it — a cumulative balance, not a daily flow, with no record when the balance is zero. We aligned each FINRA settlement date to the fails balance of the same date (the files carry daily balances; every available settlement matched its own date exactly). Universe: the 1,624 tickers with a price history in our bars database that appear in the fails files, of 1,633 with price histories. Short interest, average daily volume and split flags come from our FINRA panel (see the companion short-interest study). We do not use fails as a percent of shares outstanding: the only share counts available to us are a current snapshot, and applying them to 2021 settlements would misdate the denominator. Fails as a share of the short position, and of average daily volume, are period-correct.
Definitions, fixed before scoring. Chain: the previous biweekly settlement's balance must exist in the panel (the May 2026 gap breaks chains that cross it; those prints are counted in our datasheet waterfall, not silently dropped). Bands, with at least 10,000 shares failed on both sides of a percentage change and no FINRA split flag on the print or the next (the same guard applies to the level and persistence tests, where a split would mechanically inflate the balance): baseline −10% to +25%; moderate +25–50%; surge +50–100%; extreme ≥ +100%; collapse ≤ −50%. New appearance: a rise from zero to at least 100,000 shares. Entry: close of the first trading day on/after settlement + 14 calendar days (publication proxy; the SEC publishes the first half of a month at month-end and the second half around the 15th of the following month). An entry that would land more than 10 days after the intended date is unscored — the guard our short-interest study added after catching silent late entries there. Horizons 21/42/63 trading days. Excess = stock return − SPY return over identical dates. Uncertainty: issuer-cluster bootstrap, 2,000 resamples; differences draw the same tickers for both groups. Prices are split-adjusted closes, unadjusted for dividends (our standard convention).
Limits. No transaction costs, borrow fees or taxes. A fails balance has no attributed cause — long sales, market-making and short sales all contribute — so nothing here identifies abusive or "naked" shorting in any individual name, and the SEC cautions against reading it that way. The baseline (a large balance that barely moved) is rare by the data's construction, which widens every difference interval; group means are printed alongside for that reason. The both-surge cell is 114 classified prints (93 scored), one cell in a 24-cell difference family; its checks support it but cannot enlarge it. The date-matched adjustment for the surge group (+14-day entry dates with at least five baseline prints) covers only 380 of 1,322 scored surge prints and lands materially below the headline difference (−6.21 points versus −2.08); because the matched subset is selected on baseline-dense dates, we weight it low and say so. Stocks that left the price universe mid-window are unscored. Nothing here is a recommendation.
Data download
Full scored event list (17,783 classified prints with fail balances, fails-to-short ratios, persistence runs and 21/42/63-day excess returns): scored_ftd_events.csv
Revision history
Oct 17, 2026: First published.