FINRA collects short interest from broker-dealers twice a month and publishes it about two weeks after each settlement date. We took the full FINRA files — 137 settlements from January 15, 2021 to September 15, 2026, 2,780,352 rows across all listed markets — and kept the 1,624 tickers in our price universe: 206,377 ticker-settlements. Each print carries the short position, the previous position, and days to cover (the position divided by average daily volume).
A surge is a print in which FINRA's reported change in short interest is +50% or more — the 97.6th percentile of prints with a prior position of at least 100,000 shares — with at least 100,000 shares short on both sides of the print, the ticker present in the previous settlement, and no stock-split flag on the print or the next one (a split multiplies the share count mechanically, and we refuse to call that a surge). That leaves 4,520 surge prints: 3,033 in the +50–100% band and 1,487 doublings or more. The comparison group is 146,236 ordinary prints (change between −10% and +25%, same floors). Prints down more than 10% — 34,164 of them — are neither, and sit outside this test.
The entry rule matters more than usual here, because the data is stale on arrival. FINRA publishes roughly two weeks after settlement, so we enter at the close of the first trading day on or after settlement + 14 calendar days — the earliest a reader of the print could act on it — and measure 21, 42 and 63 trading days forward against SPY over the same dates. Of the classified prints, about 85% in every group could be scored at 63 days; the rest fall outside our price history (which starts September 27, 2021) or run past its end (October 2, 2026). The dropout rates are nearly identical across groups — 85.0% of ordinary prints scored, 83.6% of the +50–100% band, 86.7% of doublings — and we publish the full scored list so the selection is auditable.
- Surge events (short interest up 50% or more in one biweekly print, prior position at least 100,000 shares): 4,520 classified, 3,825 scored at 63 trading days. Mean excess return versus SPY: +0.09% (95% CI −1.05 to +1.52). Ordinary prints averaged +0.41%; the difference, −0.32 points, has an interval of −1.45 to +1.07.
- No intensity ordering: moderate jumps (+25–50%) averaged +0.38%, the +50–100% band +0.25%, and doublings or more −0.23% — every interval includes both zero and the ordinary-print line.
- The typical stock trailed the index whatever happened to its short interest: median 63-day excess was −1.6 points after surges and −1.6 points after ordinary prints; the win rate against SPY was 42.8% versus 45.5%.
- The level leaned, the change did nothing: stocks at 7+ days to cover trailed stocks under 2 days by 0.74 points per quarter on point estimates — but that interval (−1.59 to +0.10) includes zero, so we report a lean, not a finding.
The headline: a surge was followed by nothing in particular
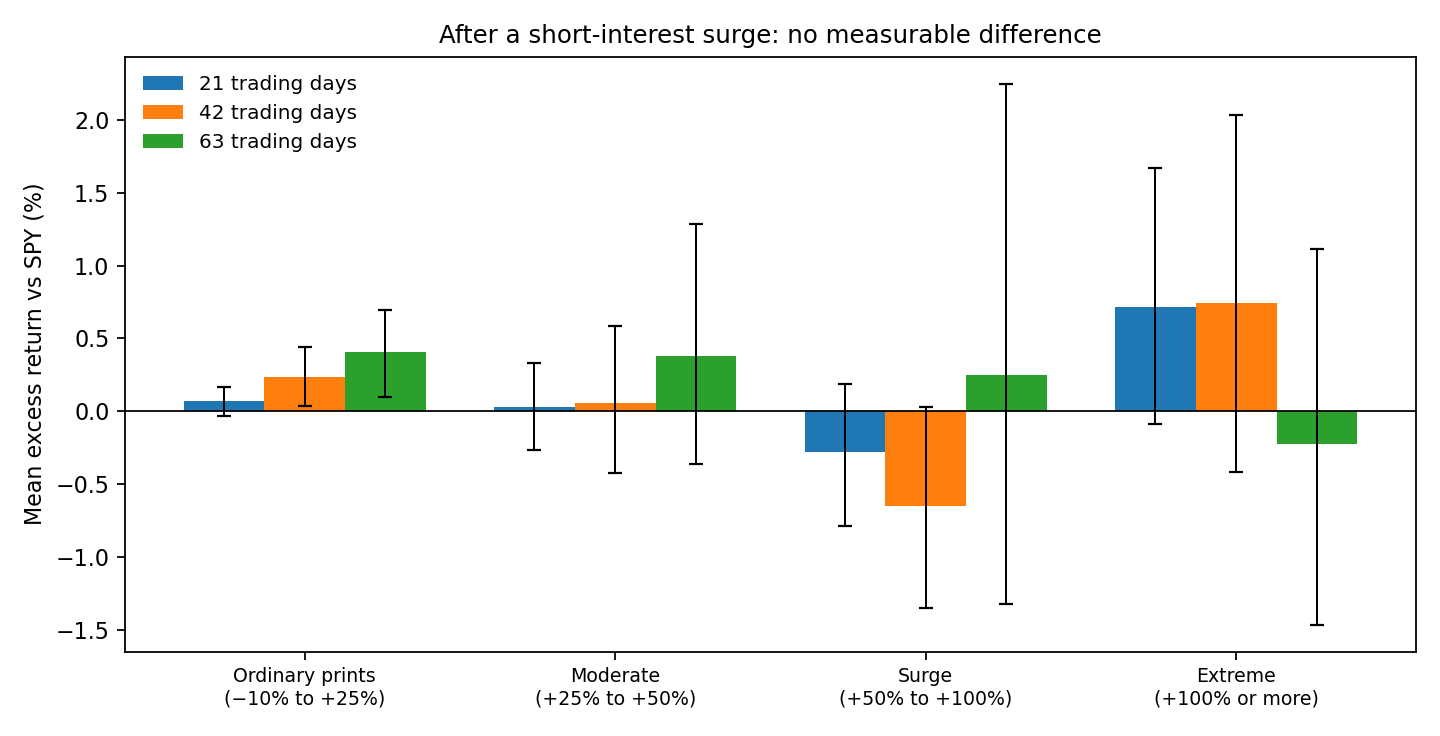
| Group | 21 days | 42 days | 63 days |
|---|---|---|---|
| Ordinary prints (n = 124,314 at 63d) | +0.07% [−0.03, +0.17] | +0.24% [+0.04, +0.44] | +0.41% [+0.10, +0.70] |
| Moderate (+25–50%) | +0.03% [−0.26, +0.33] | +0.06% [−0.42, +0.59] | +0.38% [−0.36, +1.28] |
| Surge (+50–100%) | −0.28% [−0.78, +0.19] | −0.65% [−1.35, +0.03] | +0.25% [−1.32, +2.25] |
| Extreme (+100%+) | +0.72% [−0.08, +1.67] | +0.74% [−0.42, +2.04] | −0.23% [−1.46, +1.12] |
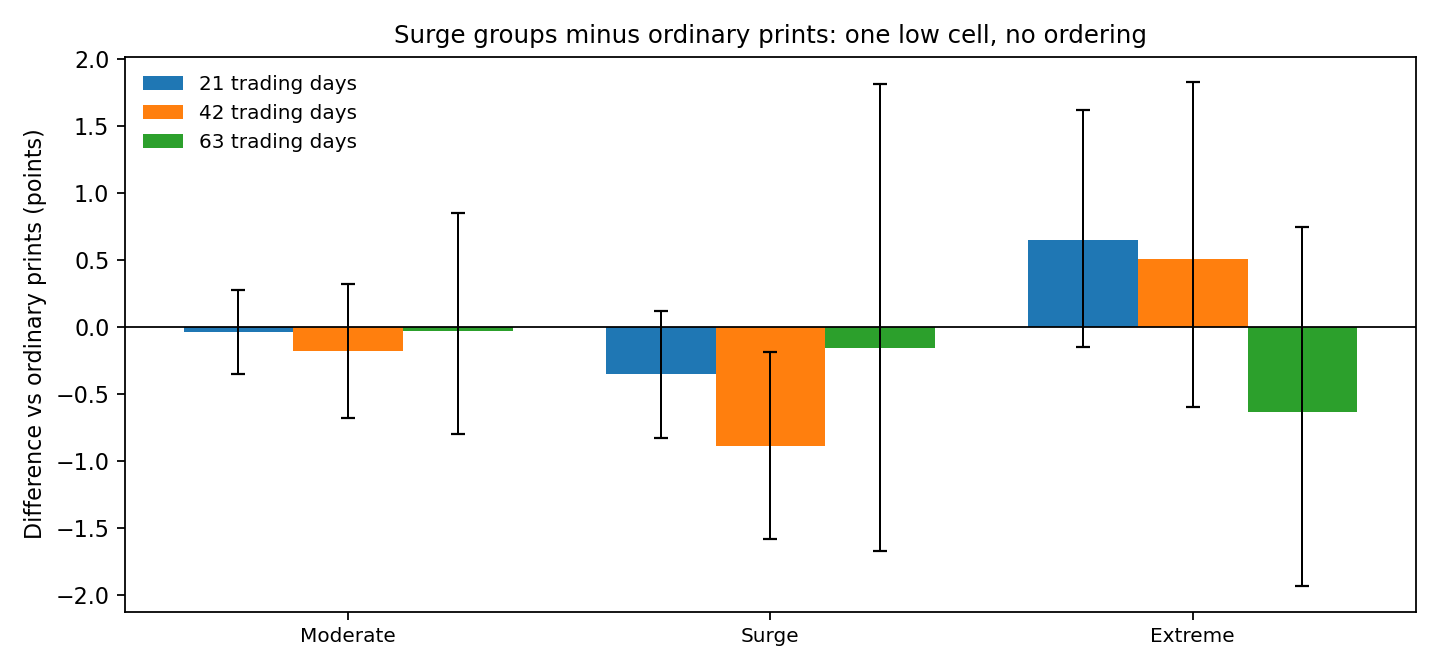
Read the table as differences and it gets quieter still. Against ordinary prints, the combined surge group (all jumps of 50% or more) differed by −0.02 points at 21 days (interval −0.44 to +0.41), −0.42 at 42 days (−1.05 to +0.24) and −0.32 at 63 days (−1.45 to +1.07). The 21-day interval is the informative one: whatever a surge means, the market does not spend the next month repricing it by more than about half a point in either direction. At 63 days the bound widens to roughly a point and a half — we rule out a large effect, not a small one, and we say so rather than dress the point estimate (−0.32) up as a finding.
One cell out of twenty-four group-and-difference intervals excludes zero: the +50–100% band at 42 days, −0.89 points against ordinary prints (interval −1.58 to −0.19). We do not believe it, and the table shows why: the more extreme band — doublings or more, where any real effect should be larger — points the other way at the same horizon (+0.51, interval −0.59 to +1.83), and by 63 days the −0.89 has dissolved to −0.16. A signal that skips the strongest dose and expires before the quarter ends is what chance produces in a family this size.
Even cheating didn't help
The obvious excuse for a null here is the calendar: by the time FINRA publishes, the print is half a month old and the squeeze, if any, already happened. So we re-ran the test entering at the first close after the settlement date — using the number two weeks before anyone outside the clearing system could see it. The surge group averaged −0.14% at 63 days (interval −1.13 to +0.93), statistically the same nothing. The information was not hiding in the lag. Re-scoring on an independent, dividend-adjusted price history (which covers fewer of the events — 1,638 of 4,520) gives a higher point estimate, +1.27%, but its interval (−0.57 to +4.09) also includes zero. On the 1,436 events all three price histories can score, our standard prices give +1.17% and the adjusted history +1.48% — so most of the gap is which events that history can price, not what the prices say. Adjusting each surge for what ordinary prints did on the same entry date moves the 63-day difference from −0.32 to −0.16 points. Every road back from the headline ends within noise of it.
The level leaned the expected way — and only leaned
Short interest has a second, quieter use: not the change, but the level. We lined up every floored print — 196,701 of them — by days to cover and scored what followed, print by print. The point estimates step down the way the "heavily shorted stocks are in trouble" story wants: under 2 days to cover, +0.91% at 63 days (interval +0.44 to +1.46); 2–4 days, +0.20%; 4–7 days, +0.23%; 7 days and more, +0.17%. Matching on entry date barely moves it: the date-matched gap between the top and bottom buckets is −0.79 points.
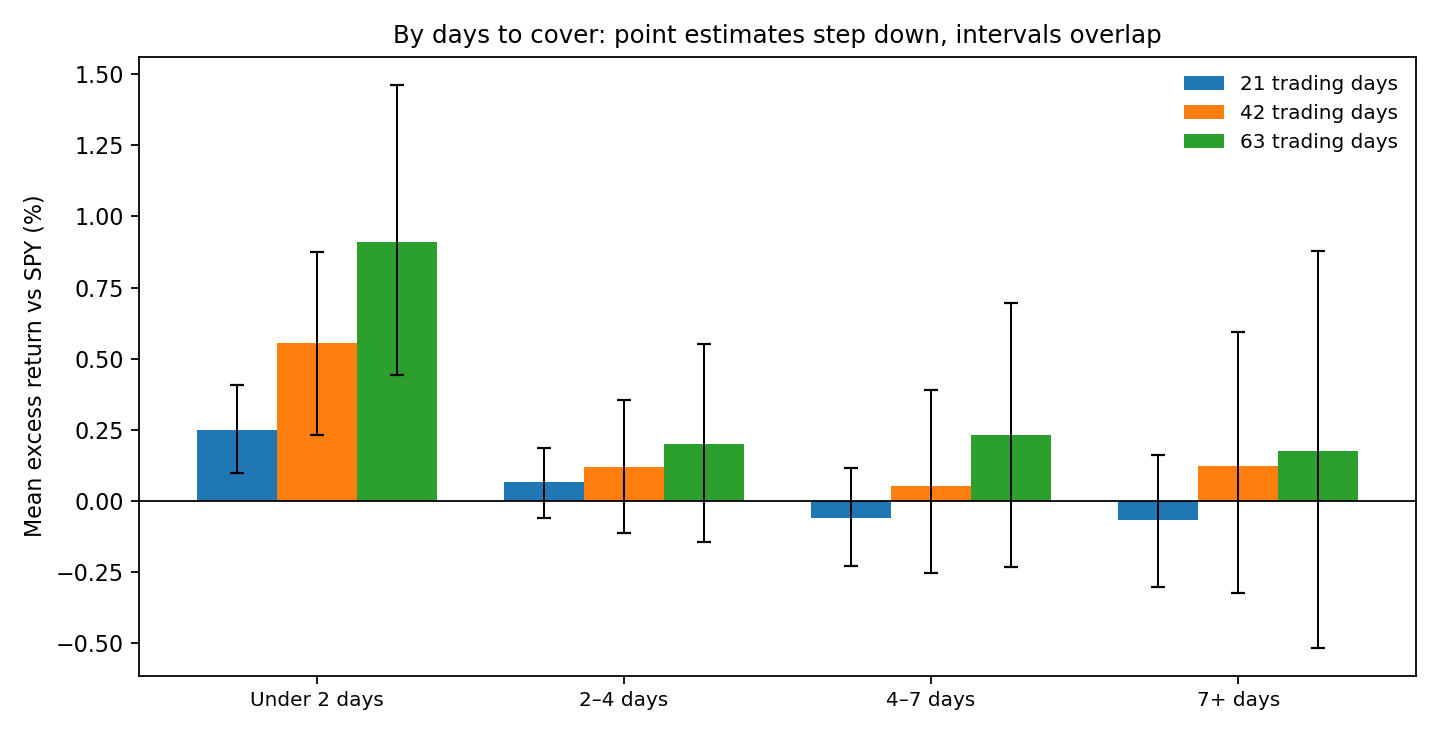
But hold the standard this site applies to its own headlines: the top-minus-bottom difference at 63 days is −0.74 points with an interval of −1.59 to +0.10 — it includes zero (at 42 days likewise; only at 21 days, −0.32 [−0.61, −0.04], does it clear). And the texture underneath is humbler than the means: the median stock trailed SPY in every bucket (−0.9 points under 2 days, −2.4 points at 7+), because in this window the average print in our universe beat the index while the typical stock did not. Days to cover also travels with size and liquidity — a small, thin name mechanically needs more days to cover the same dollar position — so the lean may be a size effect wearing a short-interest costume. We report it as what it is: a consistent lean across three horizons that this dataset cannot quite certify.
An error we caught in our own scoring
The first run of this study scored prices with a routine that, when a stock's price history began after the event window — a recent listing, a ticker whose history starts late — silently entered at the first available bar instead. 16,137 of the 152,200 events scored at 63 days in that run had entered more than 10 days after the intended date; the worst entered 1,765 days late, in a different market regime, wearing the settlement's date. We found it by auditing entry dates against publication dates, fixed the scorer (an entry more than 10 days late is now unscored, and the benchmark exit is matched to the stock's exit date), and recomputed everything. The fix moved the ordinary-print average from −0.22% to +0.41%, the surge group from −0.72% to +0.09%, and the days-to-cover gap from −1.21 points to −0.74. The surge conclusion never changed; the level conclusion got weaker, which is exactly why the audit mattered. Every number above is post-fix.
Methodology
Data. FINRA Equity Short Interest files, collected directly from FINRA's CDN (137 of 138 settlements, January 15, 2021 – September 15, 2026; the September 30, 2026 file was not yet published at collection). Universe: the 1,624 tickers with a price history in our bars database — listed, more liquid names; the all-market files hold 2,780,352 rows, of which 206,377 fall in this universe. We do not use percent-of-shares-outstanding: the only share counts available to us are a current snapshot, and applying them to 2021 settlements would misdate the denominator. Days to cover is FINRA's own period-correct level measure.
Definitions, fixed before scoring. Surge: FINRA-reported change in short interest ≥ +50% (97.6th percentile of floored prints), prior and current position ≥ 100,000 shares, ticker present in the previous settlement, no split flag on the print or the next. Bands: +25–50% (moderate), +50–100% (surge), ≥ +100% (extreme). Baseline: −10% to +25% (ordinary). Entry: close of the first trading day on/after settlement + 14 calendar days (publication proxy). Horizons 21/42/63 trading days. Excess = stock return − SPY return over identical dates. Prices are split-adjusted closes, unadjusted for dividends (our standard convention); the robustness section prices the same events on a dividend-adjusted history. Uncertainty: issuer-cluster bootstrap, 2,000 resamples. Level test: every floored print (shares ≥ 100,000), bucketed by days to cover; prints are biweekly, so holding windows overlap and the same stock appears many times — the cluster bootstrap, not the raw count, carries the uncertainty.
Limits. No transaction costs, borrow fees or taxes. A surge print is two weeks stale at publication and up to four weeks stale at our entry; the test measures what a reader of FINRA's file could have earned, nothing faster. Stocks that left the price universe mid-window are unscored. Nothing here is a recommendation, and a null on the change says nothing about any individual crowded name — only that, across 4,520 cases, the crowd's arrival predicted nothing in particular.
Data download
Full scored event list (160,047 classified prints with 21/42/63-day excess returns): scored_short_interest_events.csv
Revision history
Oct 16, 2026: First published. An earlier internal run with an entry-date defect was discarded before publication; the defect and its effect on the numbers are disclosed in the article ("An error we caught in our own scoring").