In the same month, at the same company, two insiders can file opposite intentions. A Form 4 reports that an insider bought shares in the open market — real money, the loudest bullish act in the disclosure system. A Form 144 reports that someone at the same company intends to sell — and in our earlier matching study, those notices became real sales 83.9% of the time. When the two land within 30 days of each other, one of them should be wrong. We found every such collision in the 2025–2026 filing record — 732 events at 446 companies — and scored what the stock did once both filings were public. Neither side won.
What counts as a collision
A collision pairs one buy episode — an insider's open-market purchases on Form 4 (code P), collapsed to one line per insider per day — with one Form 144 notice at the same company, where the two filing dates fall within 30 days of each other. The event completes on the later of the two filing dates, the first day a reader could have seen both, and we enter at the next trading day's close. Pairs that complete on the same day merge into one event, and a company cannot fire a second collision within 30 days of the first. That turns 6,042 raw pairs into 732 events. Two comparison groups get the same treatment: insider buys with no notice within 30 days on either side (1,786 episodes, restricted to companies that appear anywhere in the Form 144 record — outside that collection's universe, “no notice” is a gap in our data, not an observation), and notices with no buy within 30 days (18,926 events).
One structural fact first, because it shapes how much evidence exists: collisions are rare — rarer than the filings themselves predict. Shuffle the “buy” and “notice” labels within each company, keeping each side's count and the company's own filing dates, and the same density of filings produces about 12,079 candidate pairs. The real record has 6,042, roughly half. Inside a company, buys and sale notices run on different clocks — buys cluster when trading windows open, notices cluster around vesting and plan calendars — and the two streams are almost scheduled to miss each other. 641 of the 732 collisions (88%) could be scored at 63 trading days; most of the rest completed too late in 2026 for a full quarter to fit inside our price calendar.
The headline: the pair is worth no more than either filing alone
- Collisions (641 scored at 63 trading days): mean excess return versus SPY +1.28% (95% CI −0.95 to +3.58). Median −1.49 points; the stock beat SPY in 46.2% of events.
- Insider buys alone (1,612 scored): +2.82% (CI +0.16 to +5.82), median −1.18.
- Sell notices alone (16,545 scored): +1.91% (CI +0.74 to +3.12), median −2.18.
- The differences are the test, and they are empty: collisions trailed buys alone by 1.53 points (CI −5.37 to +1.86) and notices alone by 0.63 points (CI −3.15 to +2.07). At 21 and 42 days the differences are +0.85 and −0.22 against buys, +0.14 and −0.59 against notices — every interval includes zero, at every horizon, against both parents.
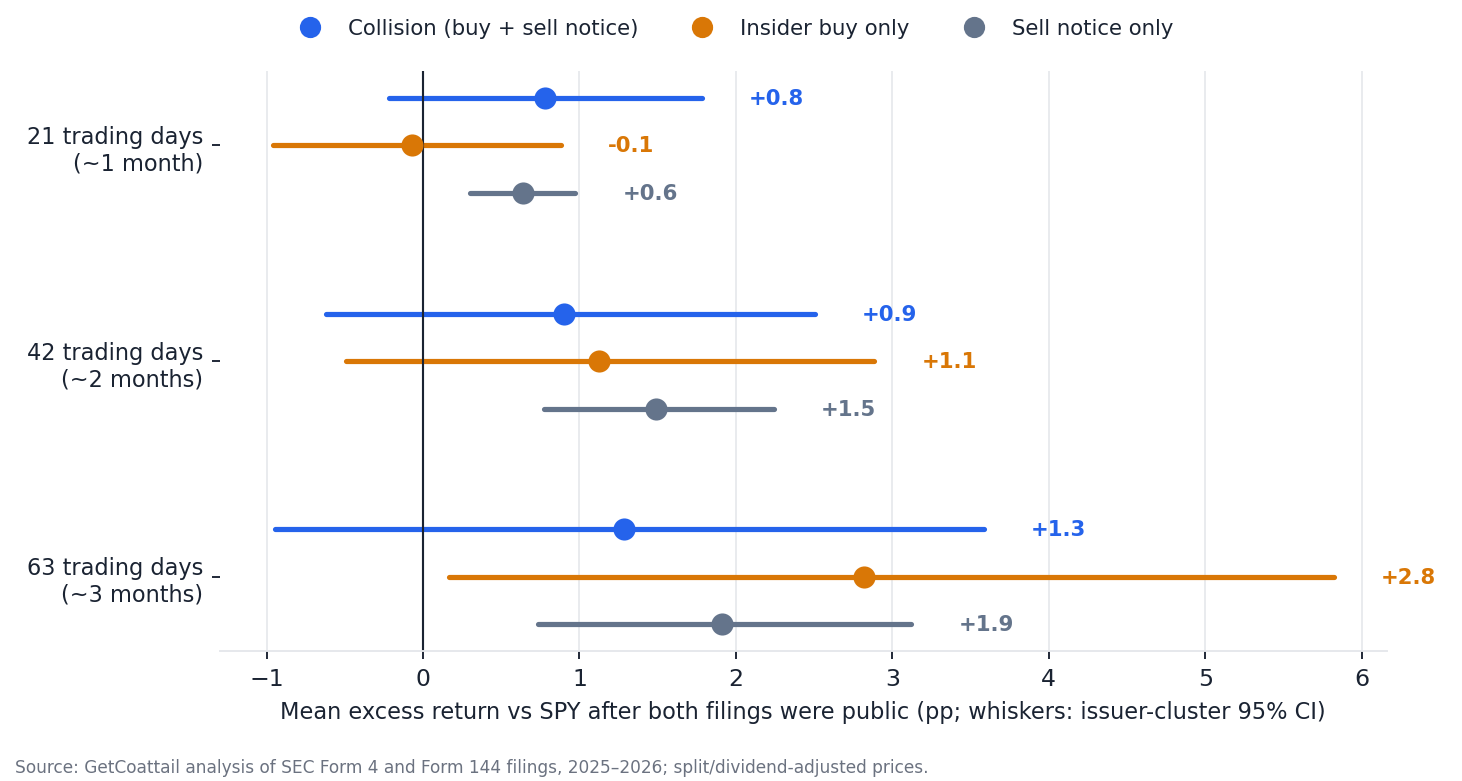
| Group | 21 trading days | 42 trading days | 63 trading days |
|---|---|---|---|
| Collision (buy + sell notice) | +0.78 [−0.22, +1.78] | +0.90 [−0.62, +2.51] | +1.28 [−0.95, +3.58] |
| Insider buy only | −0.07 [−0.96, +0.88] | +1.12 [−0.49, +2.89] | +2.82 [+0.16, +5.82] |
| Sell notice only | +0.64 [+0.30, +0.97] | +1.49 [+0.77, +2.24] | +1.91 [+0.74, +3.12] |
Read the levels naively and there is a story available — buys positive, collisions a notch lower, as if the notice taxed the buy. The difference intervals refuse to sign it. And the sign is fragile besides: score the buys against the all-issuer buy universe instead of the notice-universe one and the 63-day difference flips to +1.04, with an interval just as wide. The point estimate moves with the comparison universe; the nothing does not. A collision does not dilute an insider buy, an insider buy does not neutralise a sale notice, and the pair carries no information beyond what each filing carried alone — which, in our previous studies of both signals, was little enough.
The average is a tail, for the third insider study running
The typical collision trailed the index: median −1.49 points, and collisions beat SPY only 46.2% of the time — the same shape as buys alone (median −1.18) and notices alone (−2.18). The positive means live in the right tail. Drop the top 1% of outcomes and the collision mean flips to −0.24 points, the buy mean falls to +0.53 and the notice mean to +0.34; trim 5% off both tails and all three sit at or below zero (−0.66, +0.04, −0.41). The single best collision was Babcock & Wilcox, +345.6 points after a $30,142 buy met two notices totalling $6,270 — the tail is built from small, volatile names. The worst was Rocket Pharmaceuticals, −63.5 points. The median event was a Biogen collision — a $151,559 buy against a $480,508 notice — that trailed by 1.49 points. Averages say the filings did nothing; the tails say a few stocks did something enormous, in both directions, for reasons the filings do not contain.
Every split we pre-registered came back empty
Same person. The sharpest version of the question is one person on both sides — selling under a notice while buying in the open market. We matched on CIK, the identifier both forms carry, never on names. It almost never happens: 32 of 732 collisions (4.4%), 29 of them scorable, averaging −0.36 points with an interval of −11.50 to +12.11. That interval is an honest shrug: the data does not contain enough of the sharpest case to judge it, and we do not.
Pre-planned notices. A notice carrying a Rule 10b5-1 adoption date at least 90 days old is, on the supply story, the mechanical kind — scheduled long before the buy. Those collisions averaged +3.79 points (CI −0.36 to +8.90, n=232), against −0.14 for collisions whose notices showed no old plan date (n=409). The difference, +3.93 points (CI −0.62 to +9.36), includes zero — and its sign runs against the supply story anyway: if anything, collisions with a mechanical notice behaved like plain buys.
Size. If announced supply were the mechanism, a bigger notice relative to the buy should hurt more. It does not, at any dose. Sorting collisions by notice dollars per buy dollar (tertile boundaries 1.2× and 15.6×), the means are +3.10, −2.41 and +3.19 points — the middle third is the negative one, every interval includes zero, and there is no dose response to explain away.
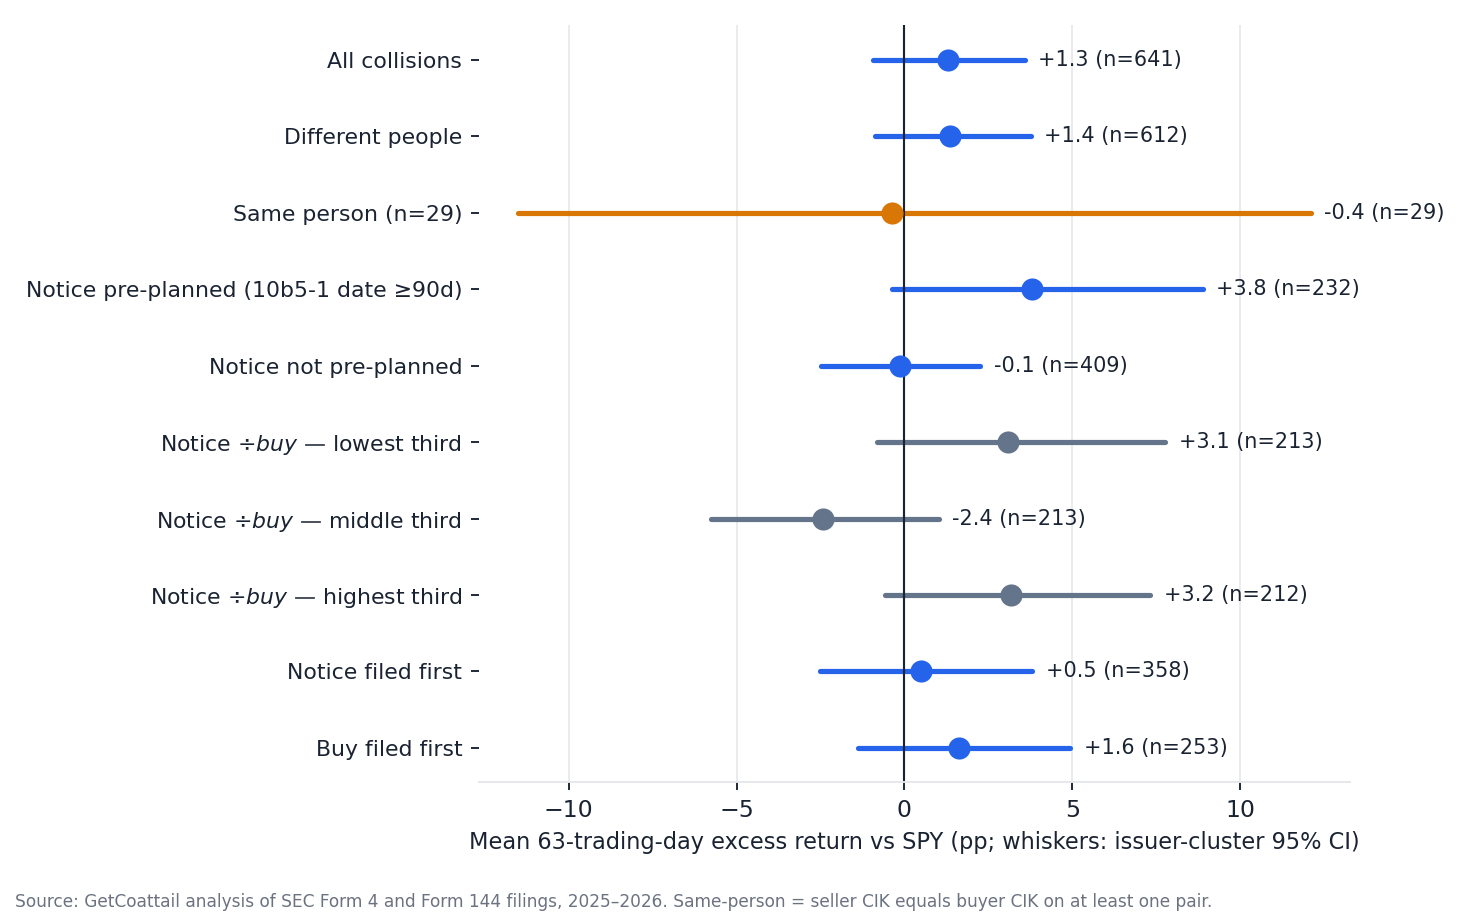
Everything else. Director-involved buys +1.06 (n=498), officers only +2.11 (n=85), 10%-owner involved +2.44 (n=55), a CEO or CFO among the buyers +1.77 (n=145), an officer on the notice −0.02 (n=479). Notice filed first +0.50 (n=358), buy filed first +1.63 (n=253). One buy episode in the collision +1.72 (n=446) versus several +0.29 (n=195). No split separates, in either direction, at any horizon.
The holdout, and the tighter window
The split was fixed in advance: 2025 completions derive, 2026 completions must repeat. At 63 days the collision average goes from +1.68 (CI −1.29 to +4.84, n=414) in 2025 to +0.57 (CI −2.77 to +3.95, n=227) in 2026 — both intervals span zero, so there is nothing to repeat. At 21 days it is worse than nothing: +2.26 (CI +0.93 to +3.78) in 2025 flips to −1.41 (CI −2.68 to −0.10) in 2026, the one horizon where both years' intervals exclude zero — in opposite directions. Narrow the collision window to 14 days and the same nothing returns: 582 events, +1.71 at 63 days, differences against both parents still spanning zero.
A note on plans: the two sides of the market are not symmetric
On the sell side of Form 4, about half of parsed filings carry the 10b5-1 plan flag (48.5% of the sell filings in the same corpus) — planned selling is the sell side's normal state. Open-market buys are almost never plan trades. For this study we collected the flag from EDGAR full text for every buy filing behind a collision or a comparison buy — 100% coverage, not a sample — and 2.1% of collision buy filings carry it. Dropping the 17 collisions with a flagged buy leaves the headline untouched (+1.29, difference vs buys −1.53), because there was almost nothing to drop. The buy in a collision is a discretionary buy, made with the filer's own money, next to a live sale notice — and it still does not win.
How to read the two lenses together
Both filings appear side by side on our stock pages, and the practical reading of this study is a refusal: when they collide, do not net them, and do not use either as a tiebreaker for the other. A Form 144 still means a sale is likely — that is a statement about the notice, from a study of notices. An insider buy is still the only insider act with any pooled signal in our testing — a weak, tail-driven one, from studies of buys. The pair is not a third signal. It is two weak signals sharing a calendar month, and the stock, on average and typically, ignored both.
Methodology
Data. Form 4: our form4full corpus — 316,796 parsed Form 4 and Form 4/A documents, filings submitted 2025-01-02 to 2026-10-02. Every finding in this piece is a statement about that filing window; the corpus holds no Form 4 filings outside 2025–2026. Form 144: our full collection of 63,013 notices (2023-04-13 to 2026-10-13), enumerated for a 1,684-ticker universe; 34,463 notices fall in the pairing window. Prices are split- and dividend-adjusted closes from our bars database and caches; where a series ends before a required bar, exchange closes from our daily files are spliced on at the last common date at the adjusted ratio. Benchmark and trading calendar: SPY adjusted closes through 2026-10-09.
Definitions, fixed before scoring (pre-registered in our study spec of Oct 19, 2026). Buy episode: non-derivative code-P acquisitions on original Form 4 filings, collapsed to (issuer, insider, trade date); the episode's filing date is its earliest contributing filing. Collision: a buy episode and a notice at the same issuer with filing dates ≤30 days apart; completion is the later filing date; pairs sharing a completion date merge; a 30-day issuer cooldown follows each event. Pure buys: episodes with no notice within ±30 days, one per (issuer, insider) per 30 days, restricted to issuers appearing in the Form 144 corpus (1,465 issuers) — with the all-issuer variant (13,485 episodes) reported as a sensitivity. Pure supply: notices with no buy episode within ±30 days, one per (issuer, seller) per 30 days. Anchor cutoffs (pure buys to Sep 13, 2026; pure supply to Sep 2, 2026) guarantee every ±30-day absence window is fully observed in the opposite corpus. Entry is the close of the next trading day after the anchor — never the anchor day itself. Horizons 21/42/63 trading days. Excess = stock return minus SPY return over identical dates. Uncertainty: issuer-cluster bootstrap, 2,000 resamples (event-level intervals agree closely throughout). Same-person matching is by CIK on both forms. The pre-planned proxy is a notice whose earliest plan adoption date precedes its filing by ≥90 days; it is a filing attribute, not proof a given sale was scheduled. Form 144 seller roles are the filing's own relationship text, keyword-normalised; buyer roles are the Form 4 header flags of the period.
Counts. Candidate pairs 6,042 = 2,700 inside fired events + 3,342 absorbed by cooldowns. Scored at 63 days: collisions 641 of 732, pure buys 1,612 of 1,786, pure supply 16,545 of 18,926; dropout is dominated by windows running past the price calendar and is similar across groups (9.7–12.6%), and every waterfall closes exactly in our datasheet. The frequency baseline permutes buy/notice labels within each issuer (counts and the issuer's pooled filing dates preserved, 1,000 draws).
Limits. A Form 144 is an intention to sell within 90 days, not a sale; the 83.9% conversion figure comes from a companion study bounded to filings of Jan 2025–Jul 2026 and is not re-estimated here. 287 event tickers had no price series in any cache; we recovered 7 from Yahoo and disclose the rest (mostly delisted names and malformed symbols printed in the source filings) rather than remap them. No transaction costs, borrow or liquidity modelling; no causal claim — the design measures association after both filings were public. The same-person cell (29 scored events) is reported under the pre-registration and supports no conclusion. Nothing here is a recommendation.
Data download
Full scored event list — all three groups, with anchors, entry dates, values and 21/42/63-day excess returns: scored_collision_study_events.csv
Revision history
Oct 20, 2026: First published.