The claim deserves a fair statement before it gets a verdict. Executives, the argument goes, buy their own company's stock for one reason — they think it is going up — and a Form 4 with transaction code P is the receipt: an open-market or private purchase, the insider's own money, disclosed within two business days. One buyer might be noise. The recipe's filter is the cluster: two or more different insiders buying inside the same 30 days. Coincidences that cost real money are supposed to be too expensive to fake, so the recipe says to buy only those names and let the executives do the research.
We test claims like this for a living, and this one is testable to the share. Our earlier studies covered neighbouring definitions: three or more insiders inside 90 days across 2021–2026, which trailed the index on average, and two or more inside 14 days in 2025–26, whose average was positive but indistinguishable from a lone buy's. The video's window is neither of those — it is 30 days, the exact number in the claim — so this piece runs the recipe at its own specification, with one test the earlier pieces did not carry: a pre-registered holdout. Clusters completed in 2025 derive the claim. Clusters completed in 2026 must repeat it, or it falls.
How the test is built
An insider-day is one insider buying at one company on one day: open-market purchases only (transaction code P), non-derivative shares, as first reported in an original Form 4. Option exercises, grants and gifts never enter — none of them is the insider's own money moving. Amended filings are set aside; the originals are what the market saw first.
A cluster fires when, scanning an issuer's trade dates in order, the trailing 30 calendar days hold purchases by two or more distinct insiders. One insider buying five times is one insider. The event is dated by the completion date — the day the second buyer's Form 4 made the cluster public — and returns start at the close of the next trading day, the first price at which a follower of the recipe could actually have bought. After a cluster completes, the same company cannot start a fresh 30-day count for another 30 days. The comparison group is the lone buy: an insider purchase with no other insider buying within 30 days on either side — same filings, same entry rule, same clock. Scores are the stock's return minus the S&P 500's over the next 21, 42 and 63 trading days, on split- and dividend-adjusted prices.
From 316,796 parsed filings we get 27,993 insider-days, of which the rules yield 3,025 cluster events at 1,628 companies and 5,125 lone buys at 2,747 companies. At the 63-day horizon, 73.5% of clusters and 73.7% of lone buys could be scored; the rest are mostly micro-cap and over-the-counter names with no usable adjusted price history, plus events completed too late for a full quarter inside a price record that ends on October 2, 2026.
- Cluster buys under the recipe (2+ insiders within 30 days), 63 trading days after the cluster became public: 2,224 scored of 3,025 events. Mean excess return versus the S&P 500: +2.32 points (95% CI −0.02 to +5.17). Median: −3.33 points. Beat the index in 42.4% of events.
- Lone buys on the same clock: 3,778 scored of 5,125. Mean −0.72 points (CI −2.14 to +0.74); median −3.56 points.
- The pooled gap — cluster minus lone — is +3.04 points with an interval of +0.34 to +5.80: the first pooled insider-buying gap in our testing whose interval clears zero.
- The holdout takes it back. Clusters completed in 2025: +4.50 (CI +1.06 to +8.57). Completed in 2026: −1.47 (CI −4.01 to +1.39). Under the rule fixed in advance — same sign, interval clear of zero — the recipe does not survive.
- The average is a tail: removing the top 1% of cluster outcomes (23 events) turns +2.32 into −1.50.
The headline, pooled: the best numbers this signal has produced
Intellectual honesty cuts both ways, so start with what the recipe's defenders can fairly quote. At 63 trading days — roughly one quarter — the average cluster beat the S&P 500 by +2.32 points, lone buys lost −0.72, and the gap between them, +3.04 points [+0.34, +5.80], clears zero. Our 14-day version of this signal could not say that (its gap was +2.48 with an interval covering zero), and neither could the 90-day version. At 21 and 42 days the 30-day gaps are +0.46 [−0.94, +1.63] and +1.44 [−0.60, +3.89] — positive point estimates that do not clear. The cluster's own 21-day average is the one other pooled figure whose interval clears zero: +0.79 [+0.02, +1.58].
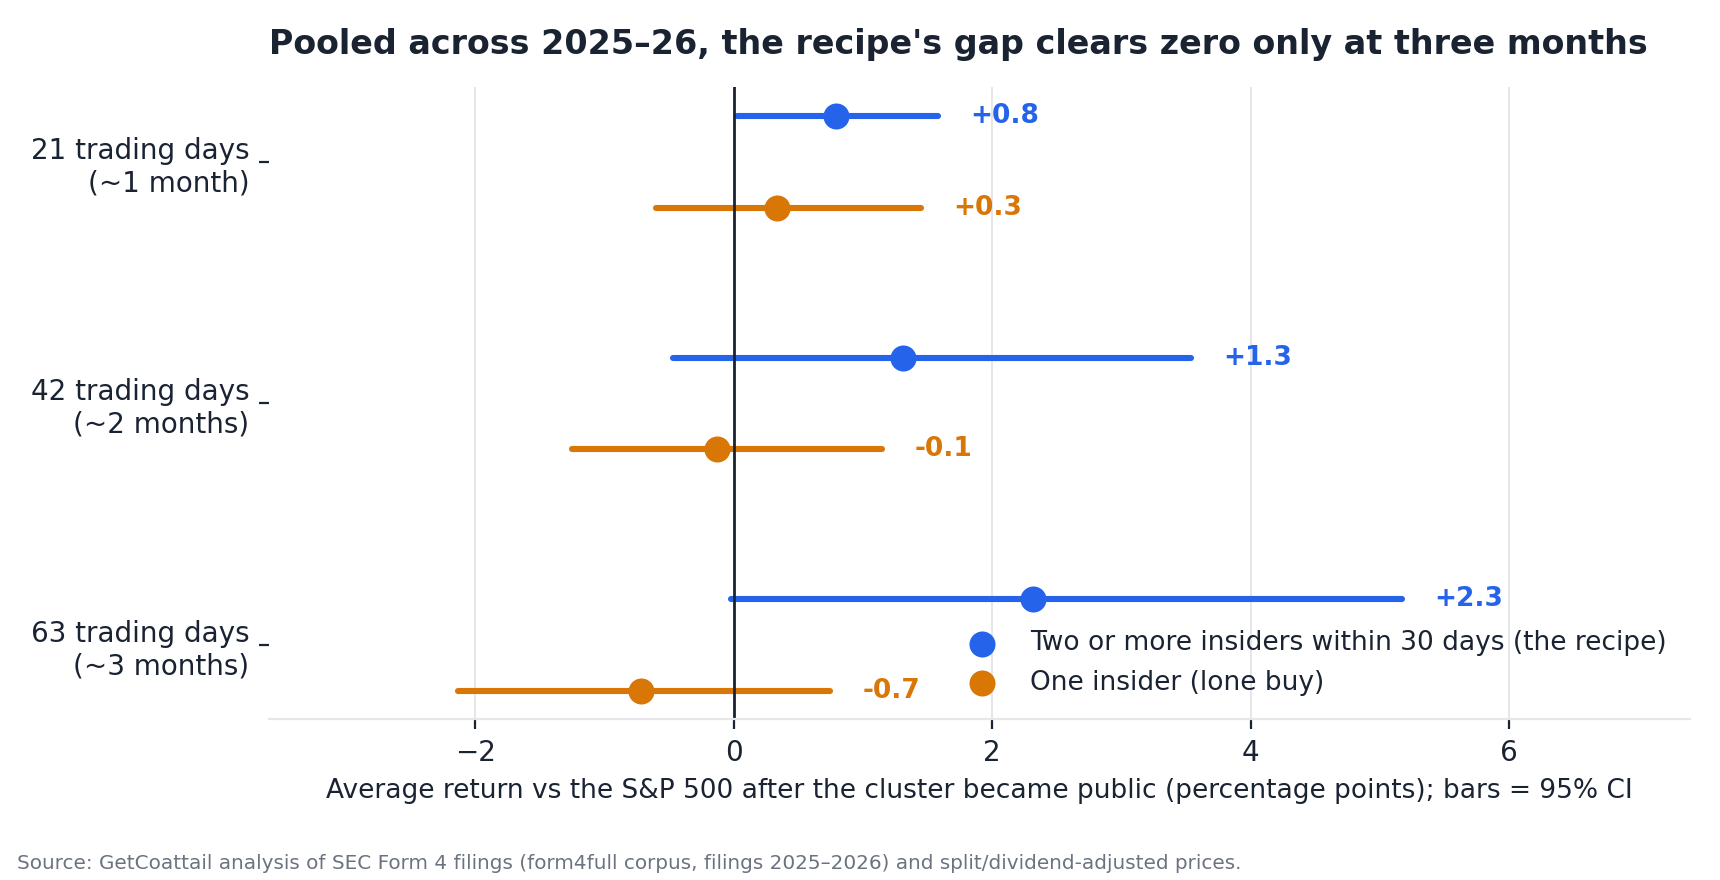
| Group | 21 days | 42 days | 63 days |
|---|---|---|---|
| Cluster buys (recipe) | +0.79 [+0.02, +1.58] (n = 2,474) | +1.31 [−0.47, +3.54] (n = 2,287) | +2.32 [−0.02, +5.17] (n = 2,224) |
| Lone buys | +0.33 [−0.60, +1.45] (n = 4,254) | −0.13 [−1.25, +1.15] (n = 3,936) | −0.72 [−2.14, +0.74] (n = 3,778) |
| Cluster − lone | +0.46 [−0.94, +1.63] | +1.44 [−0.60, +3.89] | +3.04 [+0.34, +5.80] |
That pooled table is exactly the kind of evidence that launches a recipe video. It is also, on its own, the wrong evidence to trade on — because it averages together the window the claim was noticed in and the window after it. The next section separates them.
The holdout: the 2025 pattern did not repeat in 2026
The verdict rule was fixed before the split was run: clusters completed in 2025 are the derivation window; clusters completed in 2026 are the validation window; the recipe survives only if the validation interval excludes zero and carries the derivation's sign. The 2025 window is everything the video promises. At 63 days the derivation clusters averaged +4.50 points with an interval of [+1.06, +8.57] — the two strongest quarters in the sample, 2025 Q2 (+9.26) and Q4 (+5.82), sit inside it. Then the calendar turned. Validation clusters averaged −1.47 points [−4.01, +1.39]: the sign flips and the interval covers zero, at 42 days (−1.71) and at 21 days (−0.46) as well. The gap over lone buys fails the same way — derivation +3.65 [−0.07, +8.19], validation +1.78 [−1.57, +5.18] — and notice that lone buys themselves deteriorated in 2026 (−3.25 at 63 days), so 2026 was simply a window in which following insider buys of any kind lost money; the cluster version lost less than the lone version, inside an interval too wide to bank.
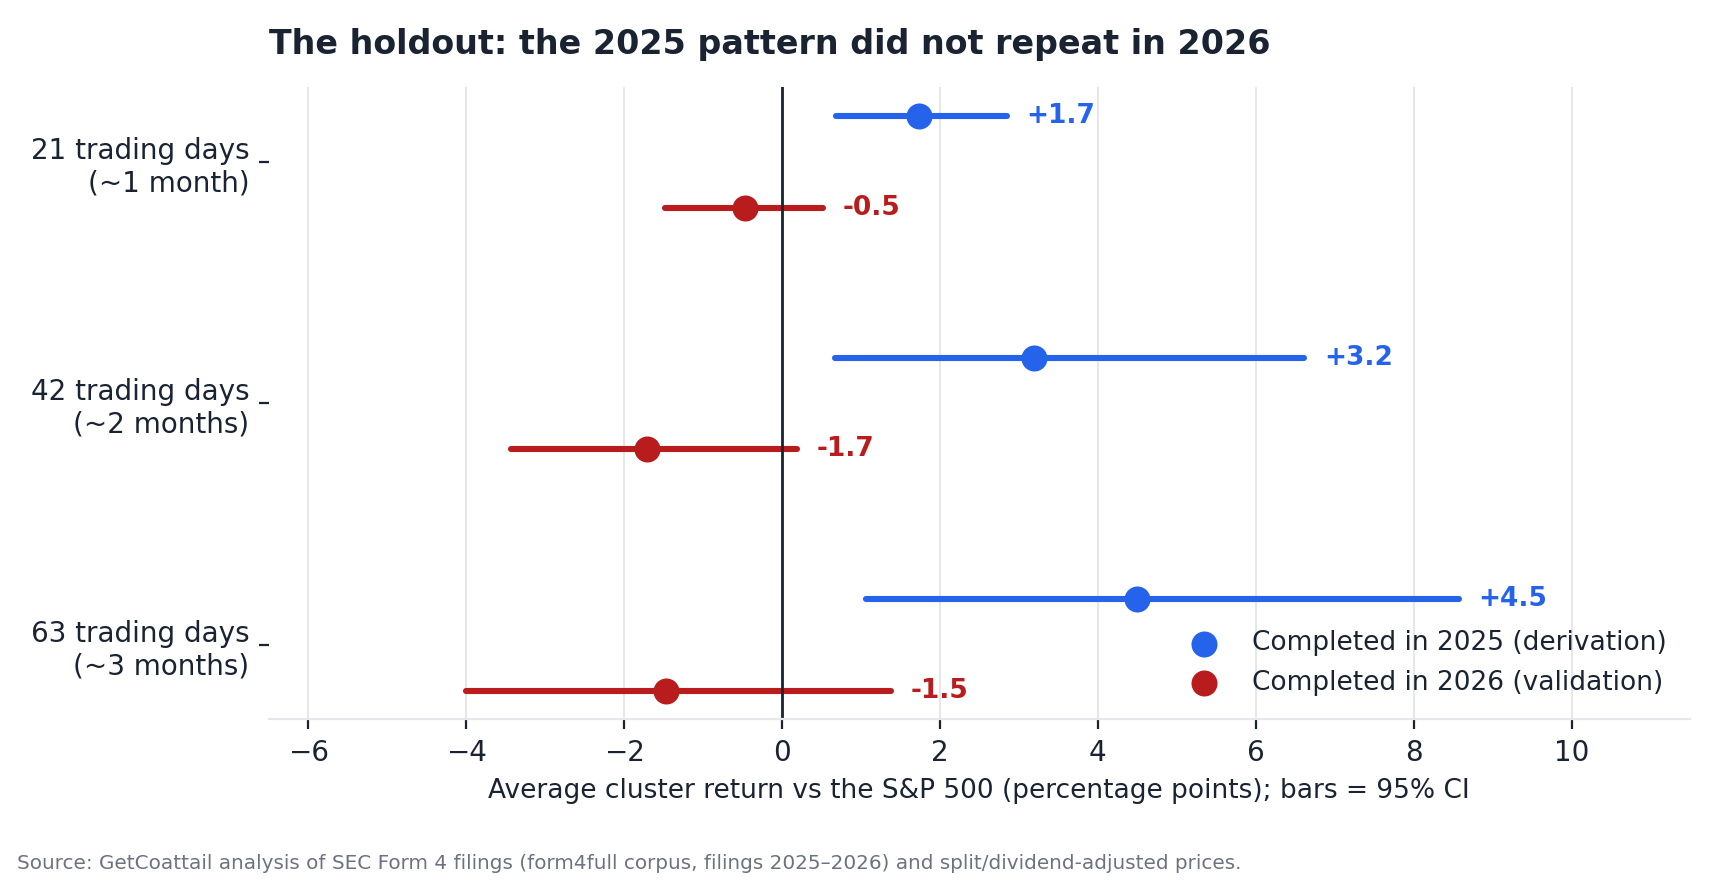
| 63 trading days | 2025 completions (derivation) | 2026 completions (validation) |
|---|---|---|
| Cluster buys | +4.50 [+1.06, +8.57] (n = 1,410, median −2.93) | −1.47 [−4.01, +1.39] (n = 814, median −3.86) |
| Lone buys | +0.85 [−1.06, +2.87] (n = 2,331, median −3.06) | −3.25 [−5.28, −0.95] (n = 1,447, median −4.24) |
| Cluster − lone | +3.65 [−0.07, +8.19] | +1.78 [−1.57, +5.18] |
One caveat belongs in the open, because it cuts into the validation window specifically. The adjusted-price record ends on October 2, 2026, so a cluster completed after early July 2026 cannot be scored at 63 days at all: 60.5% of validation clusters were scored at that horizon against 83.9% of derivation clusters, and the scored validation set is its earlier completions only. That truncation is disclosed here rather than smoothed over. It blurs the validation estimate; it does not explain a sign flip of this size — the flip is present at 21 days too, where 79% of validation clusters are scored — and it is a reason to re-run this test when a fuller 2026 exists, not a reason to override the verdict the pre-registered rule returns.
The typical trade the recipe produces
Set the windows aside and look at the trade itself. The median cluster trailed the index by 3.33 points at 63 days, pooled — and the median trailed in the derivation window (−2.93) and the validation window (−3.86) alike. Only 42.4% of clusters beat the S&P 500. The average win was +29.8 points; the average loss −17.9. This is the familiar insider-buying shape: a long left side of slow bleeders, a thin right tail of stocks that multiplied, and an average that lives entirely in the tail.
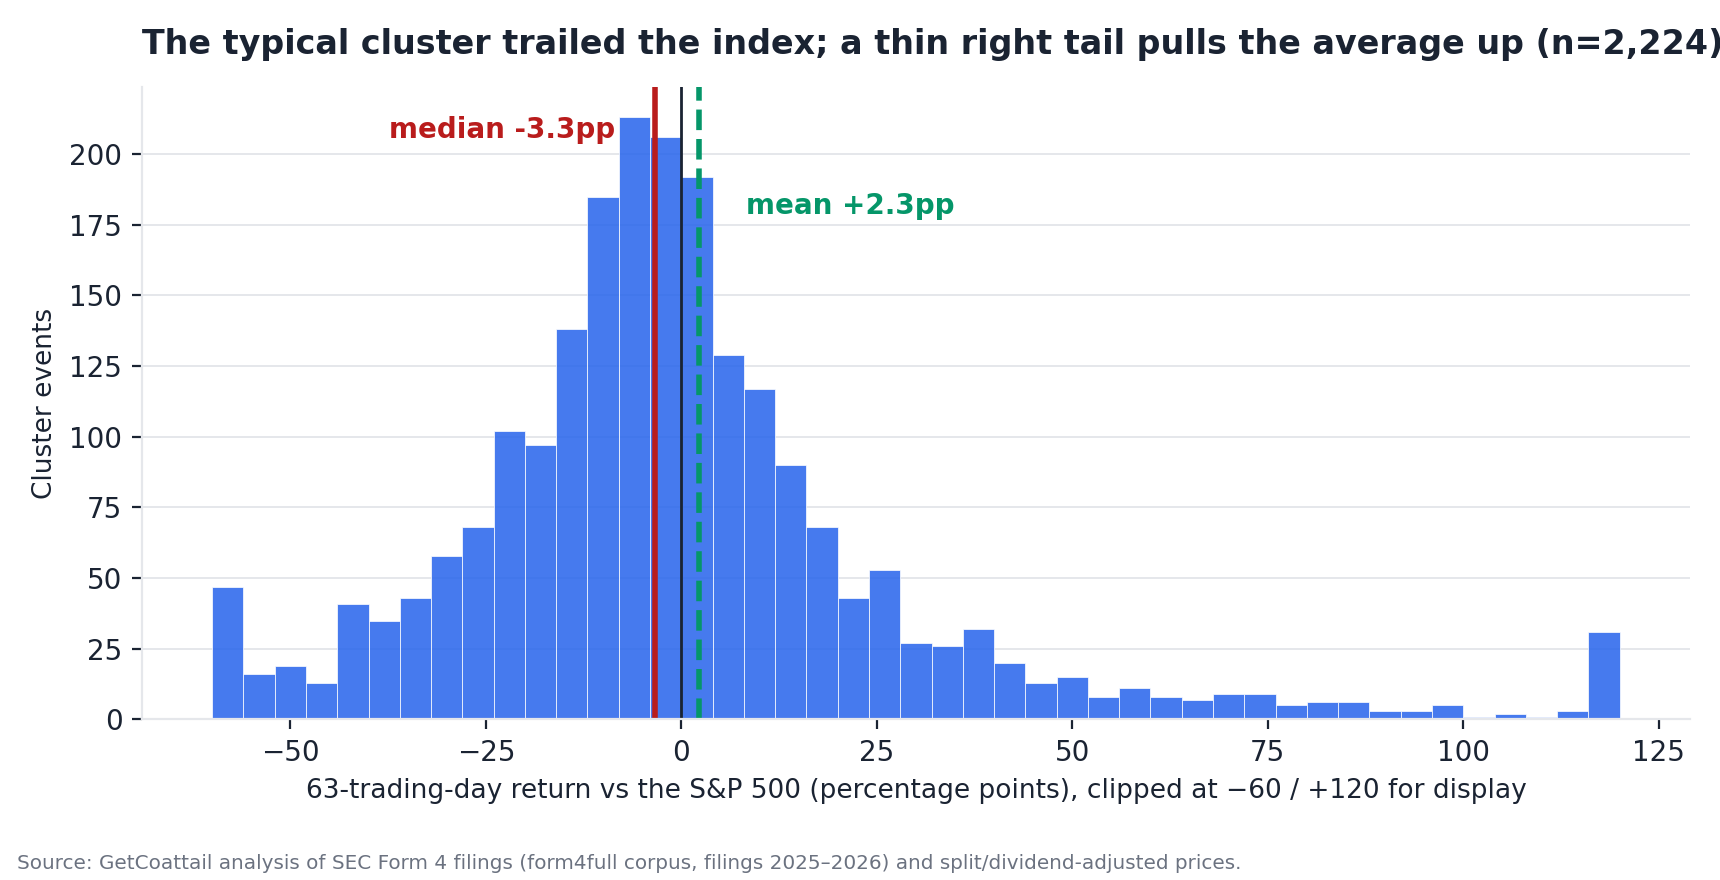
The robustness check that matters most is brutal and simple. Remove just the top 1% of cluster outcomes — 23 events — and the pooled +2.32 average becomes −1.50. Trim 1% from both tails and it is −0.73. Of the scored clusters, 126 (5.7%) gained 50 points or more and 38 (1.7%) gained 100 or more; those events are the pooled average, in both windows and in the gap over lone buys as well. Everything else about this signal lives near or below the index line.
The obvious upgrades do not rescue it
A recipe that fails invites amendments, so we tested the three a follower would reach for first. More buyers. If clustering is the signal, three buyers should beat two. They do not: exactly-two clusters are the entire pooled result (+2.63 at 63 days [+0.18, +5.46] on 1,618 scored events), while three-or-more clusters average less (+1.49 [−3.73, +8.76], n=606) and are negative at 21 and 42 days (−0.36, −0.96) where exactly-two is positive. In the holdout the order hardly matters — exactly-two flips from +4.78 to −1.15, three-or-more from +3.75 to −2.28.
Require the CEO or CFO. Just over half the clusters (1,569 of 3,025) include a buyer whose title says chief executive or chief financial officer. Pooled, they average more (+3.08 [−0.46, +7.39], n=1,185) than clusters without one (+1.45 [−1.55, +4.98], n=1,039) — but the difference between the two rows, +1.63, carries an interval of [−2.99, +6.69], and the CEO/CFO row is the one that flips hardest in the holdout: +6.44 [+1.20, +12.72] in derivation, −3.09 [−6.42, +0.44] in validation, with a validation median of −5.37. Seniority did not protect anyone in 2026. (By role rather than title, the fattest point estimate again belongs to clusters involving a 10% owner, +7.85 — with an interval from −1.42 to +19.11 that cannot hold the claim still.)
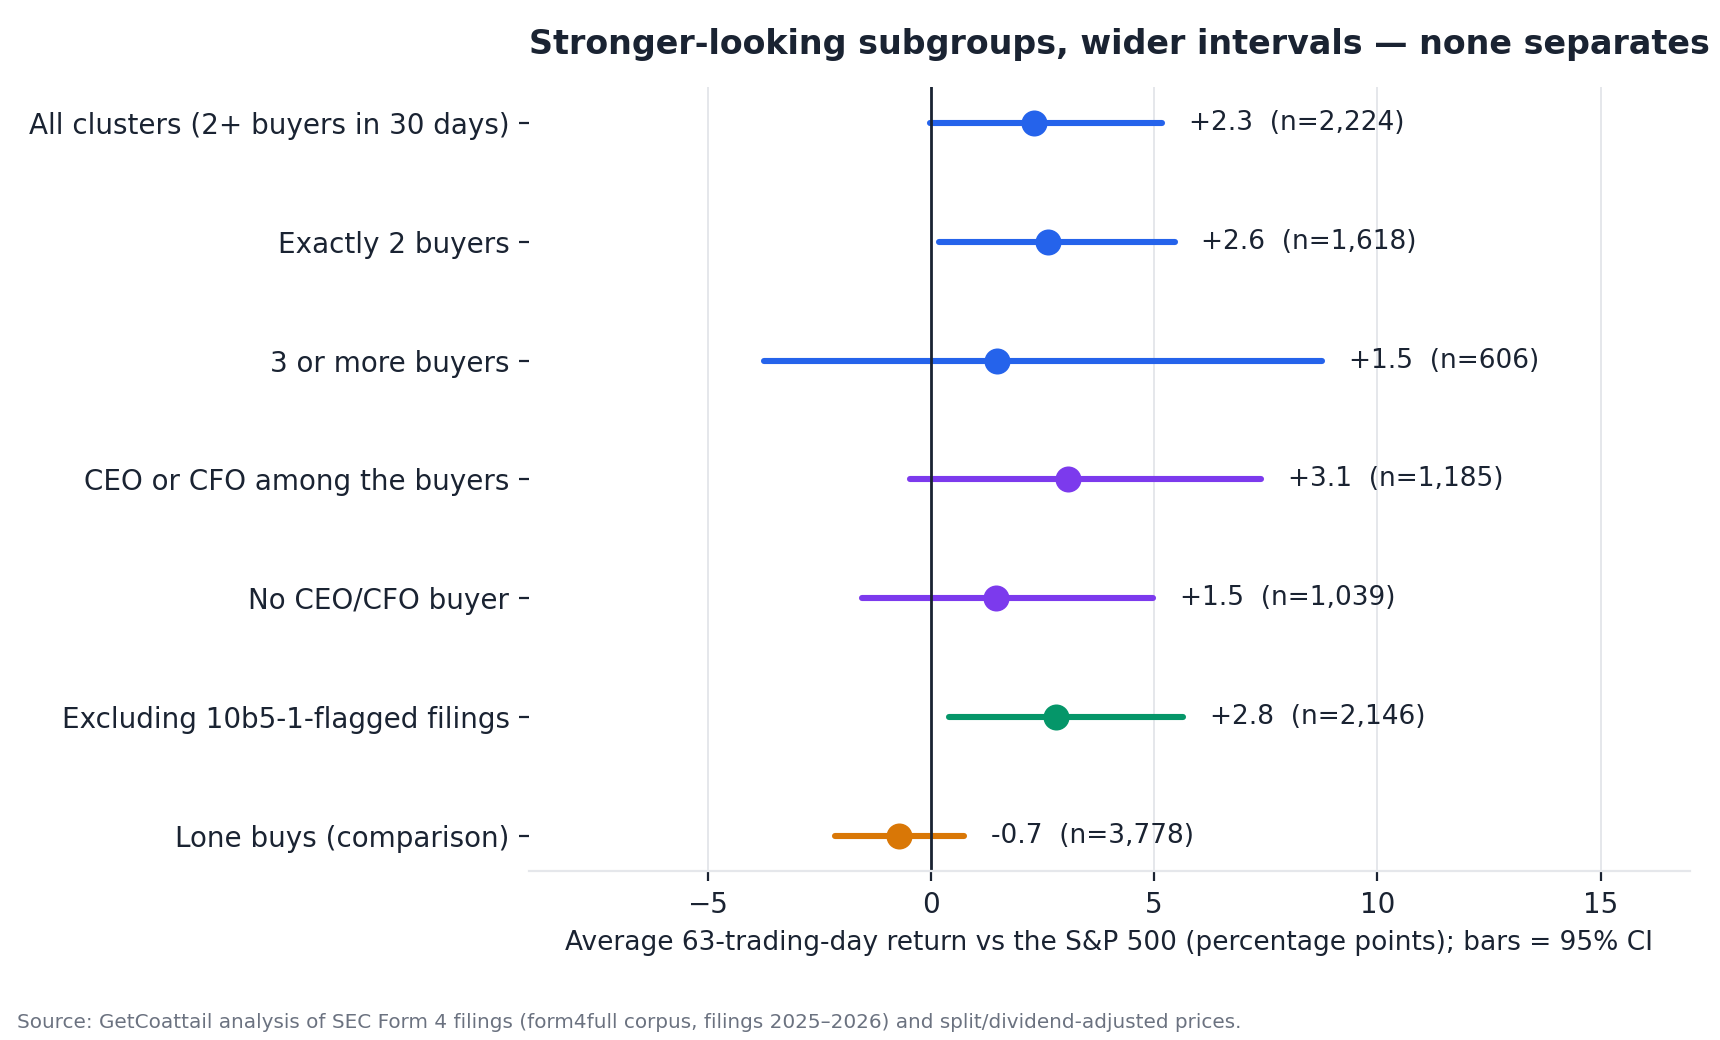
And pre-planned trades do not explain the average either: 458 of the 16,150 filings that form these events (2.8%) carry the filer's own Rule 10b5-1 flag, and dropping every event that touches one — 84 clusters, 129 lone buys — leaves the pooled cluster average at +2.8 [+0.4, +5.6] and the pooled difference at +3.8 [+1.1, +6.8]. Planned buying is not what props the number up. That variant is pooled, like the headline; it does not change the holdout verdict above.
Three events, honestly labelled
The best cluster with real money behind it: BluSky AI (BSAI) — two buyers whose titles read CEO/CFO, $45,629 of purchases, the cluster completed on 4 June 2025, and over the next 63 trading days the stock returned +880% against the index's +9% — an excess of +870.9 points. That is the right tail at full size, and it is real. The worst cluster is FibroBiologics (FBLG): three insiders including the chief executive and the chief financial officer, $48,181, completed 3 March 2026 — then a collapse worth −96.2 points against the index. The senior titles the recipe's defenders would ask for were all present. It changed nothing.
And the median event — the one that best represents what following the recipe actually delivered — is Cumberland Pharmaceuticals (CPIX): four insiders, including the chairman and chief executive, bought $6,374 of stock in July 2025, and the shares then trailed the S&P 500 by 3.3 points over the next quarter. Small money, senior titles, index-lagging outcome. One more event belongs in the open because it sits inside every average above: the single largest excess in the data is MGT Capital (MGTI), +1,595 points — a sub-penny over-the-counter name whose filings record the purchases at a price of $0.00. The filings are real and the price record is real; no follower of the recipe could have sized that trade. It stays in the dataset; it should not stay in anyone's head as evidence.
What would change the answer
Two honest gaps remain. First, coverage: 26.5% of clusters never got scored, because their tickers have no usable adjusted price history — overwhelmingly the smallest, least liquid names — and another slice of the 2026 window is still unscorable at 63 days until the price record extends. This test's verdict covers the measurable universe, stated as such. Second, time: the corpus holds filings from 2025–2026 only, one market regime, and the holdout is a single year of it. The recipe's fairest next test is mechanical — re-run this exact definition once 2026 can be scored in full, and again on the next year. What the record already rules out is the video's framing: a standing rule that grows an account. In the first full window after the window it was noticed in, the identical steps trailed the index on the average trade and on the median trade. Insider buying may be a reason to look at a company. On this evidence it is not, by itself, a reason to expect the stock to beat the market — in any window we can currently measure.
Methodology
Corpus. All 316,796 parsed Form 4 and Form 4/A documents in our form4full corpus (filings submitted 2025-01-02 to 2026-10-02). Findings describe this filing window only; the corpus contains no earlier filings, and nothing here generalises beyond it. Insider-day. One insider (owner CIK) × one issuer × one trade date, from non-derivative rows with transaction code P and acquired disposition in original Form 4 filings; an insider-day's filing date is the earliest filing reporting it, its symbol and officer title are that filing's (ties broken alphabetically so results do not depend on processing order), and its role flags are the OR over all filings reporting it. Days are built from 36,689 buy rows; 441 rows reported no price (counted as $0 in purchase values; the buys themselves count); 206 rows carried a timezone suffix on the trade date and were normalised to the date part. Original filings only — Form 4/A amendments carried 821 buy rows (2.2%) and are excluded. Cluster (the recipe). Scanning each issuer's insider-days by trade date — evaluation is by trade date, so every purchase made on the firing date counts — a cluster fires on the first trade date whose trailing 30 calendar days (that date included) contain purchases by ≥2 distinct insiders. The completion date is the second-earliest first-filing date among the window's buyers: the day the second purchase became public. After a cluster completes, the same issuer cannot fire another cluster whose trigger trade date falls within 30 calendar days after that completion date. Every insider-day inside a firing window is a cluster member and cannot also be a lone buy; one insider's repeat purchases count once. Lone buys. Insider-days that are not cluster members, have no purchase by a different insider within ±30 calendar days, and are the first counted episode for that insider at that issuer in any 30-day span. Batch disclosures. Events in the same group at the same issuer sharing a completion date are merged into one (0 clusters — the cooldown absorbs them — and 103 lone buys); the market sees one disclosure. Eligibility. Trigger trade on/after 2025-02-01; completion between 2025-02-01 and 2026-10-09. Scoring. Entry is the adjusted close of the first trading day after the completion date; horizons of 21, 42 and 63 trading days on the SPY trading calendar; excess return is the stock's return minus SPY's over identical dates, in percentage points. Prices are split- and dividend-adjusted closes from, in priority order, our 5-year bar files, price files collected for the earlier insider-cluster studies, and fresh Yahoo chart pulls for remaining event tickers. Unmeasured events, by horizon-63 waterfall (sequential, non-overlapping): no price series (380 clusters, 568 lone buys), no entry bar (54, 98), 63-day window incomplete at the end of the price record (364, 679), no exit bar (3, 2) — leaving 2,224 clusters (73.5%) and 3,778 lone buys (73.7%) scored. Intervals. Issuer-cluster bootstrap, 2,000 resamples, seed 20261019; differences resample both groups over the union of issuers with shared weights. Holdout. Derivation = events completed in calendar 2025; validation = completed in 2026; the recipe survives only if the validation interval excludes zero with the derivation's sign. CEO/CFO. A cluster counts when any member insider-day's reported officer title matches CEO / chief executive or CFO / chief financial officer (case-insensitive); titles exist only where an officer reported one. 10b5-1. For every filing that forms an event (16,150 in all) we read the aff10b5One element from the filing's full text on EDGAR: 458 filings (2.8%) assert the trade was made under a Rule 10b5-1 plan and the rest assert it was not. The headline includes flagged buys; the robustness variant excluding every event that touches a flagged filing is reported above. Roles. A cluster's continuity bucket is set by the most senior category present among its buyers: 10% owner, then director, then officers-only. Not measured. Transaction costs, bid-ask spreads, liquidity and taxes; market-capitalisation controls and any matching on prior returns; quarter rows are descriptive only. Formation cross-check: the earlier 14-day study's engine re-run at a 30-day window forms 2,994 clusters and the identical 5,125 lone buys, with a pooled 63-day cluster mean of +2.13 against this package's +2.32 — the holdout failure is not an artefact of the formation rule. Code, the scored event list (CSV) and the independent verification report are in the research package.
Data download
Full scored event list (3,025 cluster events and 5,125 lone buys with completion dates, buyer counts, CEO/CFO flags, purchase values and 21/42/63-day excess returns, or the reason an event could not be measured): scored_insider_cluster_30d_events.csv
Revision history
Oct 19, 2026: First published.