Insider buying is the one insider signal with a respectable evidence base: officers and directors buying with their own money, in the open market, tend to know things. The cluster version sharpens it. One buyer can be noise — a diversification quirk, a tax plan, a new director establishing a position. Two or three buying at once, the argument goes, is a coincidence too expensive to fake.
We have tested a version of this before. Our earlier study, Three Insiders Bought. The Stock Still Didn't Beat the Index, required three or more insiders inside a rolling 90-day window, across 2021–2026 filings, and found the average cluster slightly behind the index. That left a corner open, and readers found it: what about two insiders — the cluster most screens actually flag — inside a tight window, the way the signal is usually sold? A fortnight, not a quarter. And what about the recent tape only?
This piece is that test, run on every Form 4 in our form4full corpus, submitted in 2025 and 2026. Everything below is a statement about those two years — not about insider buying across history.
How the test is built
An insider-day is one insider buying at one company on one day: open-market purchases only (transaction code P), non-derivative shares, as first reported in an original Form 4. Option exercises, grants and gifts never enter. Amended filings are set aside — they carried 2.2% of all open-market buy rows, and the originals are what the market saw first.
A cluster fires the moment a second distinct insider's purchase lands within 14 calendar days of another's at the same company. The event is dated not by the trades but by the confirmation date — the day the second buyer's filing made the cluster public knowledge. You cannot trade a signal before it exists, so returns start at the close of the next trading day after that filing, and run 21, 42 and 63 trading days against the S&P 500 over the identical dates. A company cannot fire two clusters in a fortnight, and if a late filer dumps months of trades into one day's filings, that is one disclosure and counts once.
The comparison group matters as much as the signal. A single buy is an insider purchase with no other insider buying within two weeks on either side — the same filings, the same entry rule, the same clock. If clusters are special, they have to beat that, not just the index.
From 316,796 parsed filings we get 27,993 insider-days, of which the rules yield 3,053 cluster events at 1,540 companies and 6,492 single buys at 2,872 companies. Prices were available for 73% of clusters and 74% of singles at the 63-day horizon; the rest are mostly micro-cap and over-the-counter names with no usable adjusted price history.
- Cluster buys, 63 trading days after the cluster became public: 2,231 scored of 3,053 events. Mean excess return versus the S&P 500: +2.1 points (95% CI +0.03 to +4.69). Median: −2.9 points. Beat the index in 43.3% of events.
- Single buys on the same clock: 4,812 scored. Mean −0.4 points (CI −1.84 to +1.15); median −3.5 points.
- The difference the folk rule predicts — cluster minus single — is +2.5 points with an interval of −0.3 to +5.2: inside the noise at 63 days, and at 21 and 42 days too.
- The average is a tail: removing the top 1% of cluster outcomes (23 events) turns +2.1 into −1.2.
The headline: a positive average, carried by the tail
At 63 trading days — roughly one quarter — the average cluster beat the S&P 500 by +2.1 percentage points, and the interval just clears zero: 95% CI [+0.03, +4.69]. At 21 days the average is +0.7, with an interval that touches zero [+0.00, +1.50]; at 42 days +0.5, with an interval that includes it. Single buys averaged +0.1, +0.1 and −0.4 points across the same horizons — indistinguishable from the index throughout.
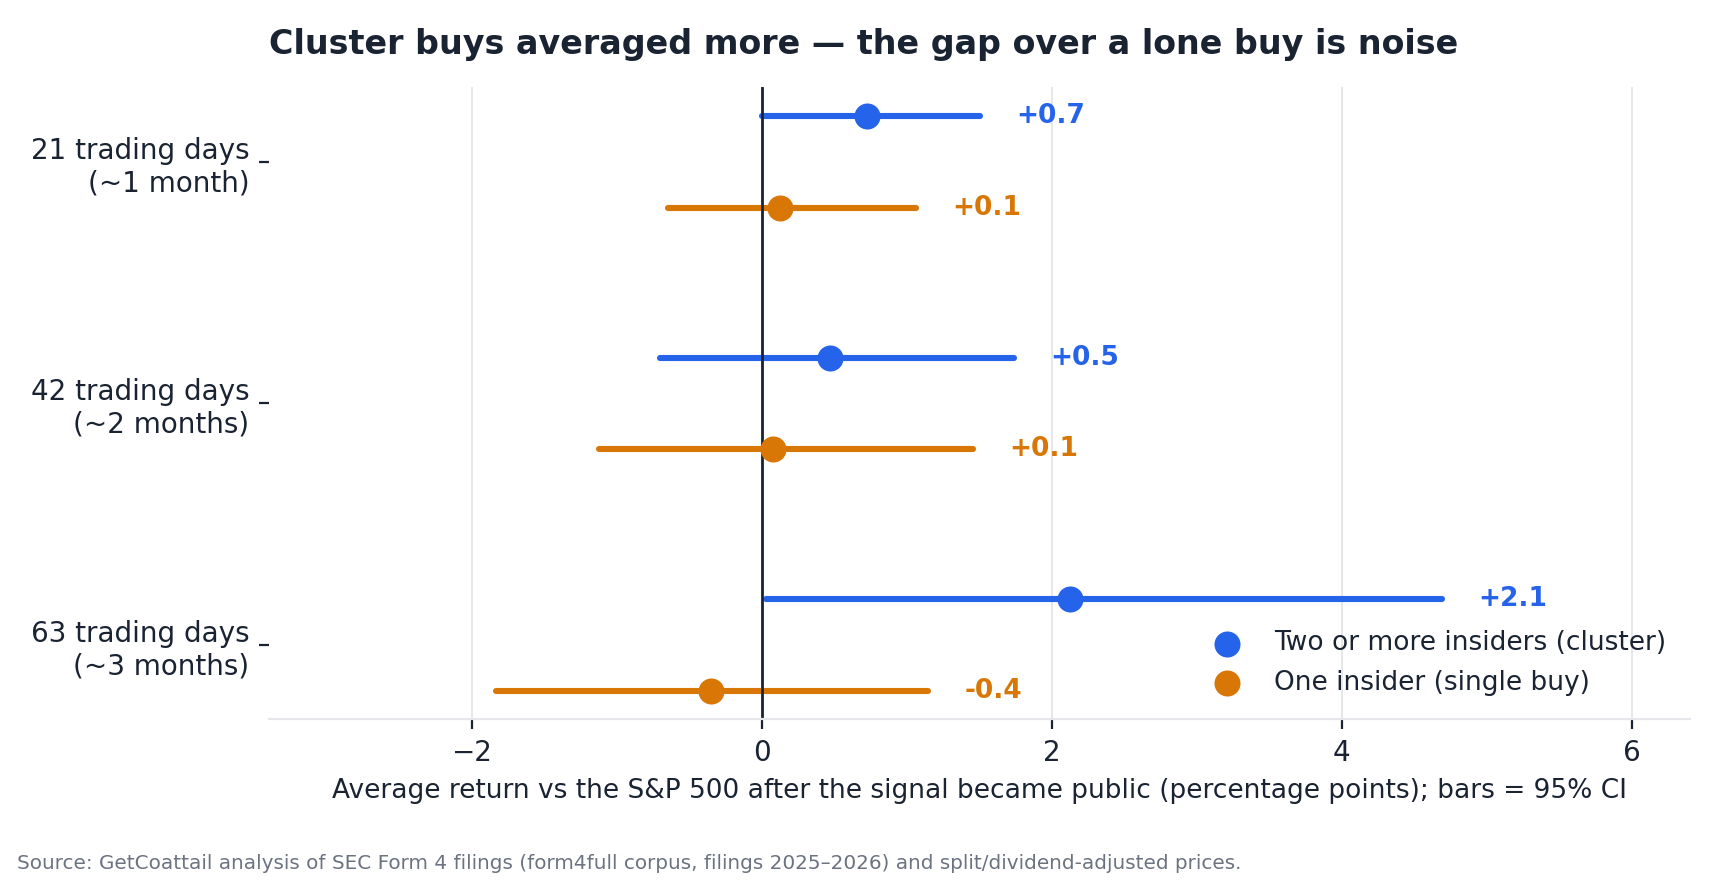
| Group | 21 days | 42 days | 63 days |
|---|---|---|---|
| Cluster buys | +0.73 [+0.00, +1.50] (n = 2,482) | +0.47 [−0.70, +1.74] (n = 2,301) | +2.12 [+0.03, +4.69] (n = 2,231) |
| Single buys | +0.12 [−0.65, +1.06] (n = 5,417) | +0.08 [−1.12, +1.46] (n = 5,012) | −0.35 [−1.84, +1.15] (n = 4,812) |
| Cluster − single | +0.60 [−0.51, +1.71] | +0.40 [−1.34, +2.04] | +2.48 [−0.25, +5.21] |
But an average is a summary, and this one is doing heavy lifting. The median cluster trailed the index by 2.9 points at 63 days. Only 43.3% of clusters beat the S&P 500 at all. The distribution is a familiar insider-buying shape: a long left side of slow bleeders, and a thin right tail of stocks that doubled. The average win was +28.4 points; the average loss −17.9.
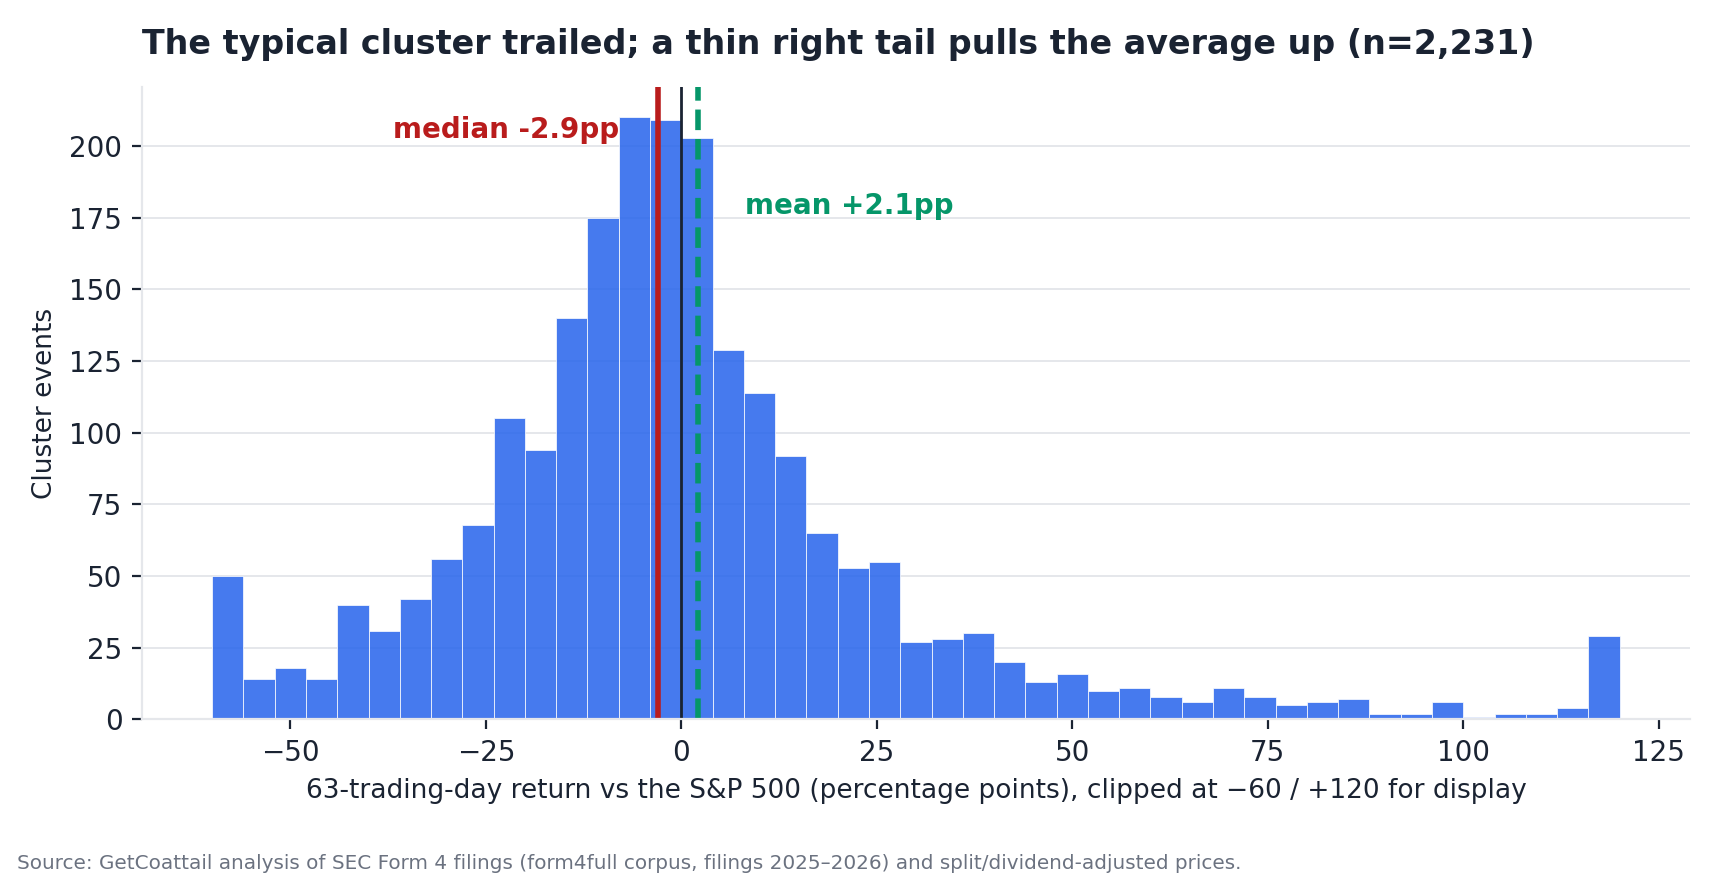
The robustness check that matters most is brutal and simple. Remove just the top 1% of cluster outcomes — 23 events — and the +2.1 average becomes −1.2. Trim 1% from both tails and it is −0.4. Five percent of clusters gained 50 points or more; 1.7% gained 100 or more. The positive mean is those events. Everything else about this signal lives near or below the index line.
And the direct test of the folk rule — cluster minus single — never separates from zero: +0.6 points at 21 days [−0.5, +1.7], +0.4 at 42 days [−1.3, +2.0], +2.5 at 63 days [−0.3, +5.2]. The point estimates lean the folk rule's way. The intervals refuse to sign.
Splitting it thinner does not rescue it
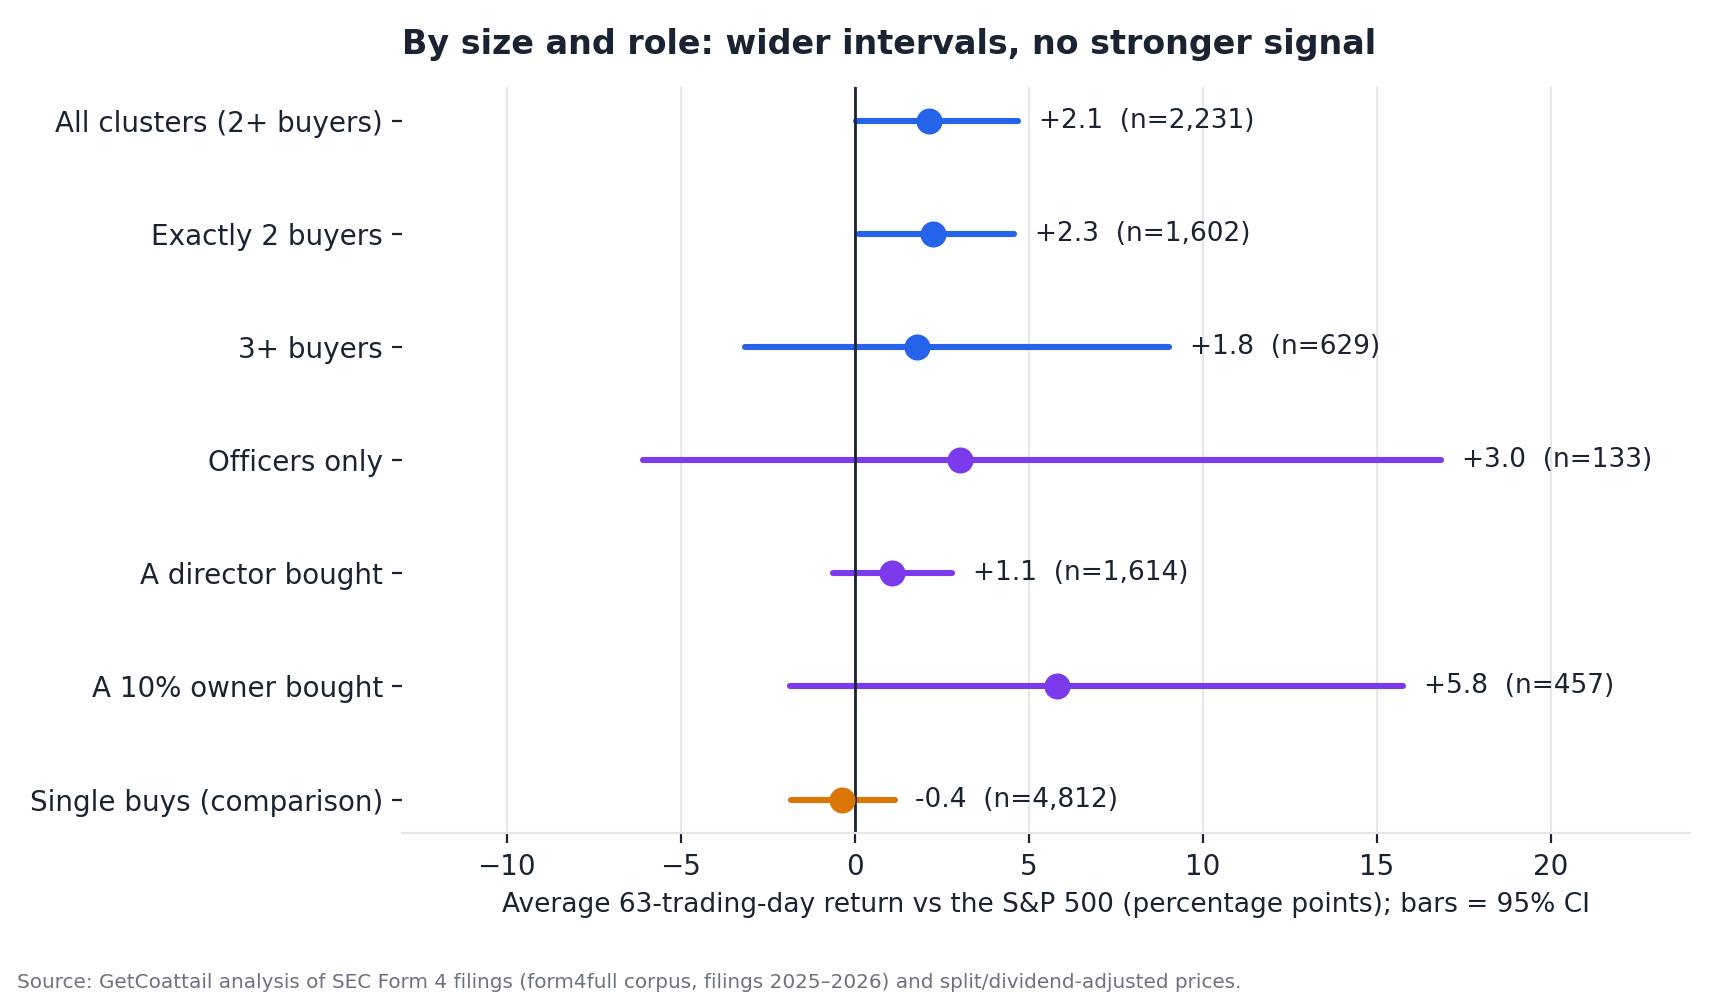
If the folk rule were right, more buyers should mean more excess. The sample is big enough to look: 70.6% of clusters are exactly two insiders, and 897 have three or more. At 63 days the exactly-two row averages +2.3 points [+0.1, +4.6] on 1,602 scored events. The three-or-more row — 629 scored events at 441 companies — averages +1.8, below the two-buyer row, with an interval from −3.2 to +9.0 that a handful of extreme outcomes at a few issuers keeps wide. The ranking the folk rule predicts (three beats two beats one) is not in this data; if anything it leans the other way, inside intervals too wide to lean on.
By who is buying, the fattest point estimate belongs to clusters involving a 10% owner: +5.8 points at 63 days. Its interval runs from −1.9 to +15.8 — among the widest on the page — and it does not separate from clusters involving a director (+1.1 [−0.6, +2.8], n=1,614) or officers only (+3.0 [−6.1, +16.9], n=133). Lone buys by the same roles are all at or below zero. There may be something in the 10%-owner row; this sample cannot hold it still long enough to look at.
Three events, honestly labelled
The best cluster with real money behind it is also a familiar name. agilon health (AGL): three officers bought $301,050 of stock, the cluster confirmed on 11 March 2026, and over the next 63 trading days the stock returned +668% against the index's +11% — an excess of +656.9 points. agilon produced the best case in our earlier study too, in a different episode — and an earlier cluster at the same company in this very sample, in March 2025, lost 56 points. Its insiders spent years buying a stock that kept falling, until one quarter it didn't. That is the right tail in person.
The worst cluster is FibroBiologics (FBLG): three insiders, $48,181, confirmed 3 March 2026 — then a collapse worth −96.2 points against the index. And the median event, the one that best represents what a cluster actually delivered, is Harmonic (HLIT): three buyers including a director, $286,170 of purchases, confirmed 13 February 2025, and a 63-day return of −5.2% while the S&P 500 fell 2.2% — −2.9 points. Real money, real conviction, and the stock fell further than the market it was meant to beat.
One more event belongs in the open, because it sits inside every average above. The single largest excess in the data is MGT Capital (MGTI), +1,595 points — a sub-penny over-the-counter name whose filings report 1.25 billion shares bought at a recorded price of $0.00. The filings are real, the price record is real, and no reader could have sized that trade. It stays in the dataset; it should not stay in anyone's head as evidence.
Why this differs from our earlier study — and where they agree
The 2021–2026 study of three-plus clusters found a mean of −1.0 points; this one finds +2.1. Both are honest arithmetic on different questions: three-plus buyers versus two-plus, a 90-day window versus 14, six years of filings versus two. The mean is the fragile statistic — flip the window and the tail changes, and the mean follows the tail. The median agrees everywhere: −3.7 points there, −2.9 here, −3.5 for lone buys. Three definitions, two corpora, one consistent story about the typical event — and a standing disagreement about the average that resolves into "the average is whichever tail your window happened to catch."
The sensitivity checks point the same way. A 7-day window gives clusters +1.6 at 63 days with the difference over singles at +1.4 [−1.1, +4.1]; a 30-day window gives +2.1 and +2.9 [+0.3, +5.7]. Entering on the confirmation day's own close instead of the next day's flatters both groups (clusters +3.6, singles +1.3) — and even under that generous rule the difference only just clears zero, at +2.3 [+0.04, +4.68]. And the plan-driven buys do not explain the result either: 2.6% of the filings that form these events carry the filer's own 10b5-1 flag, and dropping every event that touches one — 72 clusters, 196 singles — leaves the cluster average at +2.4 [+0.1, +5.1], if anything a touch higher, with the difference at +2.9 [+0.4, +6.0] in that variant. Two percent of the data carries no conclusion in either direction; the headline keeps every open-market buy, flagged or not.
What would change the answer
Two honest gaps remain. First, coverage: 27% of clusters never got scored, because their tickers have no usable adjusted price history — overwhelmingly the smallest, least liquid names, where an informed-buyer effect would plausibly live if it lives anywhere. This test cannot see them, and its negative-leaning median is a statement about the measurable universe. Second, time: two years, one market regime, a tape that rewarded beaten-down small caps for long stretches. The same test on 2021–2024 filings, under this exact definition, is the obvious sequel — our earlier study's negative mean under a neighbouring definition suggests the +2.1 would not survive the trip.
Until then, the fair summary is narrow. In 2025–2026 filings, when a second insider joined a first within two weeks, the stock that followed was a coin weighted slightly toward a few very large wins and a majority of small losses. The average beat the index because of the wins. The typical stock trailed it. And a lone insider, buying quietly with nobody beside them, produced a distribution close enough that two years of filings cannot tell the two apart. Cluster buying may be a reason to look at a company. On this evidence, it is not, by itself, a reason to expect the stock to beat the market — and it is not a trading signal we would present as one.
Methodology
Corpus. All 316,796 parsed Form 4 and Form 4/A documents in our form4full corpus (filings submitted 2025-01-02 to 2026-10-02). Findings describe this filing window only. Insider-day. One insider (owner CIK) × one issuer × one trade date, from non-derivative rows with transaction code P and acquired disposition in original Form 4 filings; an insider-day's filing date is the earliest filing reporting it, its symbol is that filing's (ties broken alphabetically so results do not depend on processing order), and its role flags are the OR over all filings reporting it. Days are built from 36,689 buy rows; 441 rows reported no price (counted as $0 in purchase values; the buys themselves count); 206 rows carried a timezone suffix on the trade date and were normalised to the date part. Original filings only — Form 4/A amendments carried 821 buy rows (2.2%) and are excluded. Cluster. Scanning each issuer's insider-days by trade date, a cluster fires on the first trade date whose trailing 14 calendar days (that date included) contain purchases by ≥2 distinct insiders — evaluation is by trade date, so every purchase made on the firing date counts; the confirmation date is the second-earliest first-filing date among the window's buyers; the same issuer cannot fire again within 14 days of the trigger trade; every insider-day inside a firing window is a cluster member and cannot also be a single. Buyers are the window's participants by trade date; a member's own filing occasionally lands after the confirmation date (Section 16's two-business-day deadline bounds the gap), and an insider whose trade falls outside the window is never in the event. Single buys. Insider-days that are not cluster members, have no purchase by a different insider within ±14 calendar days, and are the first counted episode for that insider at that issuer in any 14-day span. Batch disclosures. Events in the same group at the same issuer sharing a confirmation date are merged into one (37 clusters, 184 singles) — the market sees one disclosure. Eligibility. Trigger trade on/after 2025-02-01; confirmation between 2025-02-01 and 2026-10-09. Scoring. Entry is the adjusted close of the first trading day after the confirmation date; horizons of 21, 42 and 63 trading days on the SPY trading calendar; excess return is the stock's return minus SPY's over identical dates, in percentage points. Prices are split- and dividend-adjusted closes from, in priority order, our 5-year bar files, price files collected for the earlier insider-cluster study, and fresh Yahoo chart pulls for remaining event tickers. Unmeasured events, by horizon-63 waterfall: no price series (400 clusters, 708 singles), 63-day window incomplete (367, 860), no entry bar (52, 110), no exit bar (3, 2) — the waterfall is sequential and non-overlapping. Intervals. Issuer-cluster bootstrap, 2,000 resamples, seed 20261017; the cluster-minus-single difference resamples both groups over the union of issuers with shared weights. 10b5-1. For every filing that forms an event (15,426 in all) we read the aff10b5One element from the filing's full text on EDGAR: 401 filings (2.6%) assert the trade was made under a Rule 10b5-1 plan. The headline includes flagged buys; the robustness variant excluding every event that touches a flagged filing is reported above. Roles. A cluster's bucket is set by the most senior category present among its buyers: 10% owner, then director, then officers-only. Not measured. Transaction costs, liquidity, market capitalisation controls, and any matching on prior returns; quarter rows are descriptive only. Code, the scored event list (CSV), and the verification script are in the research package.
Data download
Full scored event list (3,053 cluster events and 6,492 single buys with confirmation dates, buyer counts, purchase values and 21/42/63-day excess returns): scored_insider_cluster_events.csv
Revision history
Oct 17, 2026: First published.