GetCoattail Research — a filings audit of Robinhood Markets, Inc. (HOOD) through six filing lenses, as of the latest filings. Past patterns are not a promise of future results. For education only — not investment advice.
The Hype
Robinhood Markets, Inc. (HOOD), Nasdaq National Market (FINRA code NNM), Class A common stock (CUSIP 770700102, CIK 1783879), is the subject of this audit. One lens is empty from the start: no FY figures are cited here — the SEC companyfacts pull returned HTTP 403, with no aggregator figure substituted.
The price file tells a two-way story. HOOD closed at $84.99 on October 30, 2026 — down 23.54% over 21 trading days (from $111.15 on October 1), down 5.92% over 63 (from $90.34 on August 3), down 15.25% since June 30 ($100.28), up 22.64% since March 31 ($69.30), down 24.85% year to date (from $113.10 on December 31, 2025), and down 38.44% over one year (from $138.07 on October 30, 2025 — alternate October 29: $144.80, −41.31%). The 252-trading-day range to October 30 runs $65.16 (March 30, 2026) to $147.08 (November 3, 2025), leaving the latest close $19.83 above the low. Volume on October 30 was 27,662,607 shares (21-day average 19,957,981).
Page context: the stock page's recent 8-K block lists October 28, 2026 (Items 2.02, 9.01), October 27, 2026 (Items 2.02, 9.01), July 29, 2026 (Items 2.02, 9.01), and June 26, 2026 (Item 5.02, departures and appointments undistinguished). The question is what the filings recorded while the price fell 23.54% in 21 days: did the tracked funds, broad market, insiders, Congress, or control register move with the slide, against it, or not at all?
The Tape
| Lens | As of | What the filings show | Direction vs prior period |
|---|---|---|---|
| Superinvestors (13F) | Jun 30, 2026 | 3 of 147 tracked managers hold; 5,340,683 shares ($535,563,691). Jericho is 90.5%. | NEW 2 · INCREASED 1 · DECREASED 0 · UNCHANGED 0; 0 exits |
| All institutions (13F) | Jun 30, 2026 | 1,406 filers hold 608,209,747 shares ($71,503,933,917). | Shares +32.16%; filers +139 net (1,221 entered, 1,082 exited) |
| Insiders (Form 4) | Oct 2, 2026 | 0 buys, 73 sells in 90 days; 1,125,103 shares, $133,129,695.17. | Site aggregate as of Nov 1, 2026: 0 buys, 51 sells, $123,283,835.69; year window: 3 buys, 279 sells |
| Congress | Oct 3, 2026 | Panel: 1 member buying, 1 purchase vs 0 sales, latest buy Apr 14, 2026. Verified history (separate): 2 buys / 5 sells. | Panel row Cisneros, Apr 14, 2026, $1,001–$15,000; history Dec 2025–Apr 2026 |
| 13D/G | Apr 30, 2026 | 9 filings in the site collection, all 13G-family; 0 Schedule 13D; max 12.2%. | 6 amendments; 485,746,517.2 shares reported in total (reporter-row sum, not ownership) |
| Short interest | Sep 30, 2026 | 40,026,285 shares short, 1.78 days to cover; fails 42,822 (0.1070% of short). | Short +10.68% vs Sep 15; up 6.7% from Jun 30; fails nonzero on all 7 aligned dates |
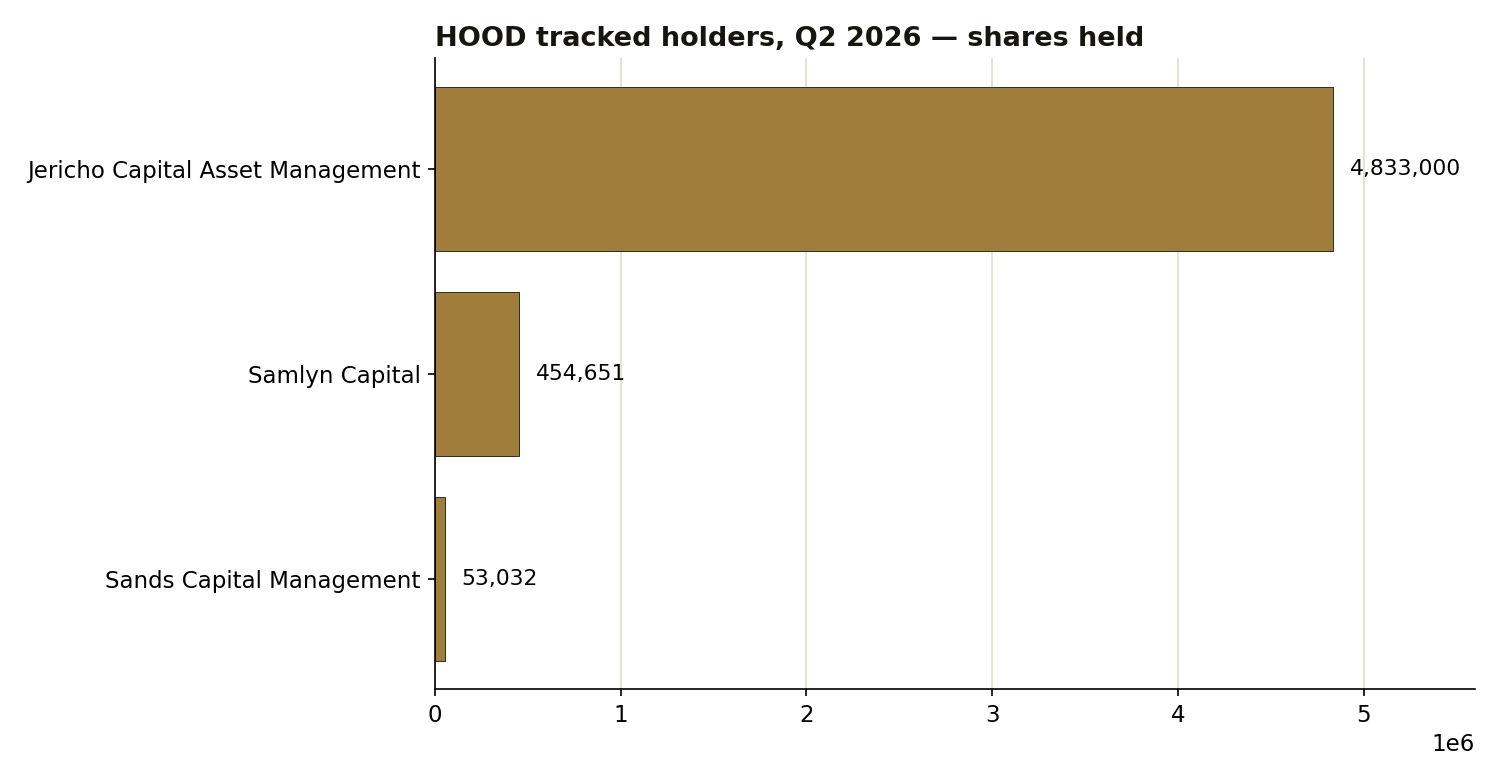
Superinvestors. Three of 147 tracked managers hold 5,340,683 shares ($535,563,691 reported); one fund is 90.5% of it. Jericho Capital Asset Management: 4,833,000 shares (90.5% of the tracked stake, 4.01% of its portfolio), NEW, filed August 14, 2026. Samlyn Capital: 454,651 shares (8.5%, 0.74% of its portfolio), NEW, filed August 14, 2026. Sands Capital Management: 53,032 shares (1.0%, 0.02% of its portfolio), INCREASED +1315.7%, filed August 13, 2026. The tracked stake is 0.88% of all institutions' reported shares; no prior-quarter holder exited in Q2. Denominator 147 = funds with usable Q2 data, not the 149-fund roster (stock page hero: "3 of 149"). The Q2 file gives direction labels and rounded percentages only, so no Q1 share count per holder is stated. Guardrail: Sessa Capital's Put option row (20,000 shares as reported, $2,005,600, 0.03%, DECREASED −98.2%, filed August 14, 2026) is not a holder — its value is underlying value referenced, not premium, with no strike or expiry. Counting it would give the false total of 5,360,683 shares / $537,569,291.
All institutions. The broad market added shares and value in Q2. Filers rose by 139 net to 1,406 (1,384 long-only); reported shares rose 32.16% (460,222,002 to 608,209,747) and reported value rose to $71,503,933,917 (from $38,603,984,342). Behind the net +139, 1,221 filers entered and 1,082 exited. The Q2 snapshot ends June 30, before the 23.54% slide to October 30, so the two are not read as one move.
Insiders. This lens is one-sided in every window. In the 90 days to October 2, 2026, there are 73 open-market sales and 0 open-market buys: 7 sellers, 1,125,103 shares, $133,129,695.17, recomputed from 30 filings in the window. The window counts by filing date, not transaction date (July 5 to October 2, 2026). By seller: Tenev Vladimir 875,000 (77.8% of shares sold, $106,292,287.89); Bhatt Baiju 142,913 ($14,507,642.09); Gallagher Daniel Martin Jr 30,000 ($3,289,959.86); Quirk Steven M. 43,793 ($5,262,354.11); Verma Shiv 19,436 ($2,102,131.21); Treseder Oluwadara Johnson 5,625 ($675,000.00); Loop Paula (director) 8,336 ($1,000,320.00). The top two sellers are 90.5% of shares sold. Rounding note: per-row rounded values sum to $133,129,695.16, one cent below the aggregate's $133,129,695.17. The filing-date rule also explains the earlier 69-row partial, which counted by transaction date and missed 4 rows, all transacted July 2 and filed July 7, 2026: Quirk 19,377 shares at $119.96, Treseder 1,875 shares at $115.00 and 1,875 shares at $120.00, and Loop Paula 8,336 shares at $120.00 — Loop is the seventh seller the partial missed. The site aggregate as of November 1, 2026 (a different 90-day window): 0 buys, 51 sells. Wider windows (full figures in the As-of table): year window 3 buys against 279 sells; corpus 4 buys against 358 sells.
Congress. One panel buy, and a longer verified history cited separately — different windows, not a contradiction. The site panel (as of October 3, 2026) counts only 2026 House PTR filings transacted on or after April 1, 2026: 1 member buying, 1 purchase vs 0 sales, latest buy April 14, 2026, Democrat. The row (member page, PTR PDF, staging row): Rep. Gilbert Cisneros (D, U.S. House), Purchase, April 14, 2026, notified May 7, filed May 8, doc 20034500, $1,001–$15,000, Class A Common Stock (HOOD) [ST]. The full verified history (every row matched to its PTR PDF): 2 buys / 5 sells, December 2025 to April 2026. Cisneros — sale (partial) December 24, 2025, doc 20033762; purchase January 30, 2026, doc 20033983; sale (partial) February 24, 2026, doc 20034144; sale March 13, 2026, doc 20034285; purchase April 14, 2026, doc 20034500 (panel row); Jackson — sale December 22, 2025, doc 20033739 (JT, $15,001–$50,000); sale January 20, 2026, doc 20033929 (SP). All amounts are $1,001–$15,000 except Jackson doc 20033739. The panel gap was a window effect, not a coverage lag: exactly one HOOD row satisfies the April 1 cutoff. The Jackson member page lists 0 HOOD rows (both pre-cutoff). Senate: no HOOD row is in this record; amounts are disclosure ranges as filed, never added to insider totals.
13D/G. The control register is passive — index holders, no activist. In the site's 13D/G collection, 9 filings match CUSIP 770700102: 0 Schedule 13D, 9 Schedule 13G-family (3 initial SC 13G, 6 amendments SC 13G/A), 21 distinct reporters, 25 reporter rows, latest April 30, 2026, maximum stake 12.2%. The 25 reporter rows sum to 485,746,517.2 shares — a reporter-row sum, never shares owned: joint filings count the same position more than once (FMR LLC and Abigail P. Johnson report the same blocks), and amendments across time are all included. Key rows: The Vanguard Group — SC 13G/A, event September 30, 2025, filed October 6, 2025, 94,436,459 shares, 12.2% (the maximum); latest: Vanguard Capital Management — SC 13G, filed April 30, 2026, 59,098,711 shares, 7.48%. One amendment (Vanguard, filed March 27, 2026) reports 0 shares / 0.0% as parsed. Phrasing is collection-scoped. A separate older corpus (25 rows, 2021–2024) is never merged, and its blank share cells are source blanks, not zeros.
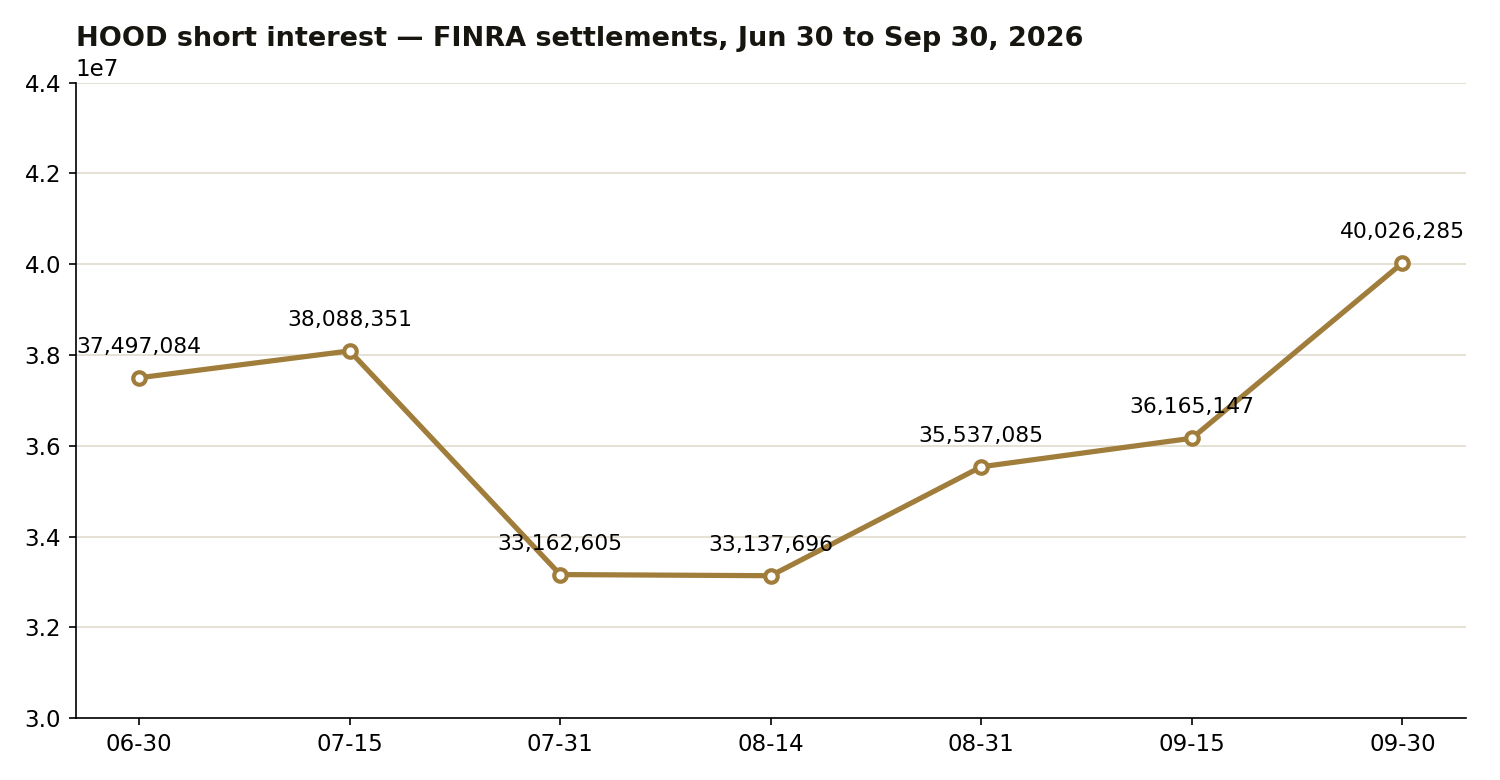
Short interest. The bear trade grew into September 30; the fails footprint is small but nonzero. FINRA short interest: 40,026,285 shares at September 30, 2026, 1.78 days to cover, +10.68% versus September 15 (36,165,147, 1.52). Full series (June 30 to September 30, in order): 37,497,084, 38,088,351, 33,162,605, 33,137,696, 35,537,085, 36,165,147, 40,026,285, up 6.7% from June 30. The September 30 row is a verified direct FINRA fetch; its previousShort equals the September 15 value, cross-checking the series. Fails-to-deliver (SEC raw CNS files, site panel's rule, in settlement order): 403, 1,145, 1, 4, 1, 14,859 (September 15, 0.0411% of short), 42,822 (September 30, 0.1070% of short). The site's FTD extract has no HOOD entry — a universe-construction absence (bars5y tickers; HOOD has no bars5y file), not evidence of zero fails. At 0.1070% of short interest, the fails footprint gives the short lens no squeeze setup on its own.
Prices and fundamentals. Last close: $84.99 on October 30, 2026 (open $85.21, high $85.21, low $82.00, volume 27,662,607; 21-day average 19,957,981). Changes: −23.54% over 21 trading days (from $111.15, October 1), −5.92% over 63 (from $90.34, August 3), −15.25% since June 30 ($100.28), +22.64% since March 31 ($69.30), −24.85% year to date (from $113.10, December 31, 2025), −38.44% over one year (from $138.07, October 30, 2025 — alternate October 29: $144.80, −41.31%). Closes are split-adjusted Yahoo bars as used by the site, not dividend-adjusted total return. Fundamentals: no FY figures are stated here — the SEC companyfacts pull returned HTTP 403 and no aggregator figure was substituted. Price as-of is October 30, 2026.
The Gap
The price slide and the filing tape do not tell the same story; the difference is in the windows. The broad base added 32.16% in shares during Q2, but that snapshot ends June 30, before the slide to October 30, so it cannot explain it; the tracked book inside it is concentrated: 2 new, 1 adding, 0 exits, Jericho alone at 90.5%. No net tracked direction is claimed (Q1 share counts per holder are not in the data). What the tape shows, in every window, is one-sided insider action: 0 buys against 73 sales in 90 days, 3 against 279 in the year window, 4 buys ($57,272,253.55) against 358 sales in the corpus. Against $133,129,695.17 of 90-day insider sales, the single Congress panel purchase is a $1,001–$15,000 range — a different scale. The control register adds no activist pressure: 0 Schedule 13D filings, largest stake a 12.2% Vanguard 13G. The short lens leans the other way: short interest rose 10.68% into September 30 even as the price fell, but at 0.1070% of short, fails of 42,822 are too small to call a squeeze setup. One plausible reading: concentration plus drift — one dominant tracked holder, insiders selling without buying, a token-size Congress purchase, passive control holders, a growing but unstressed short position. The record shows neither a coordinated buy nor a crowded short.
What Would Change the Picture
Nothing above is a recommendation. It is a record. What would change it:
- Q3 13F season (filings due by November 16, 2026). Watch whether Jericho adds to or trims its NEW position, Samlyn builds on its NEW position, Sands follows its +1315.7% increase, or the Sessa Put row moves.
- A first open-market insider buy in any window would break a buy-free 90-day record; an eighth 90-day seller would widen a seven-name seller list.
- A Congress purchase, a second member, or a first Senate transaction would change a panel holding one House purchase and a history of two buys and five sells.
- A first Schedule 13D filing, or a 13G above 12.2%, would change a register with no activist filing and a 12.2% Vanguard maximum.
- Short-interest direction. A further rise above the September 30 level of 40,026,285 shares, or a fails share above 0.1070%, would give the short lens something new; a fall below the September 15 level of 36,165,147 would reverse it.
- A successful SEC fundamentals pull would fill this article's only data gap.
As-of & Limits
| Lens | As of | Limit or note |
|---|---|---|
| Superinvestors (13F) | Jun 30, 2026 | 13F figures are as of June 30, 2026, the quarter-end. Funds have up to 45 days after quarter-end to file, so this is the most recent complete picture — and it is always a lagging one. Single CUSIP 770700102. Denominator 147 = funds with usable Q2 data (roster 149); the stock page hero says "3 of 149" because it counts the roster. Q1 share counts per holder are not in any workspace file found, so direction labels and rounded change percentages only are stated; no Q1 share count is backed out from a rounded percentage. Q3 filings are due by November 16, 2026 and are not in this article. |
| All institutions (13F) | Jun 30, 2026 | By-ticker row is the SEC 13F dataset row for HOOD; it matches the stock page's all-institutions panel exactly. Reported shares and value both rose in Q2. |
| Insiders (Form 4) | Oct 2, 2026 | This lens counts only P and S codes in the form4full aggregate window, which counts by filing date (July 5 to October 2, 2026), not transaction date. In 90 days: 30 filings, 0 buys, 73 sells (1,125,103 shares, $133,129,695.17); in the year window: 133 filings, 3 buys, 279 sells (7,293,217 shares, $851,458,859.03); in the corpus aggregate: 272 filings, 4 buys, 358 sells (22,828,268 shares, $2,192,120,067.32). Year and corpus figures are aggregates; no seller beyond the seven named above is named from the aggregates. The site aggregate as of November 1, 2026 (0 buys, 51 sells, $123,283,835.69, 6 sellers) is a different 90-day window and is never mixed with the October 2 aggregate. The per-row rounded value sum is $133,129,695.16, one cent below the aggregate; the aggregate $133,129,695.17 is cited. |
| Congress | Oct 3, 2026 | Panel (1 member buying, 1 purchase vs 0 sales) counts only 2026 House PTR transactions dated on or after April 1, 2026. The full verified history (2 buys / 5 sells, December 2025 to April 2026) is cited separately with its window labeled, never blended into panel totals. Reported as member-disclosure aggregates, not Form 4 insider transactions, and never added to insider totals. Amounts are disclosure ranges as filed. Senate: no HOOD row is in this record. |
| 13D/G | Apr 30, 2026 | Collection-scoped phrasing: in the site's 13D/G collection, 9 filings match CUSIP 770700102. The 25-row total (485,746,517.2) sums reporter rows and double-counts joint reporters; it is never presented as shares owned. The 2021–2024 corpus (25 rows) is a separate collection with different windows and methods and is never merged into the collection series, and its blank share cells are source blanks, not zeros. |
| Short interest | Sep 30, 2026 | FINRA twice-monthly settlements. Fails are SEC semi-monthly prints aligned under the site panel's rule (most recent FTD date at or before the settlement, within 10 days; absent from that date's file = 0); the series is reported as settlements, not as a signal. The FTD extract's lack of a HOOD entry is a universe-construction absence (bars5y tickers), not evidence of zero fails. |
| Prices | Oct 30, 2026 | Price file: daily-refresh cache (fetchedFor October 30, 2026; 501 bars, October 31, 2024 to October 30, 2026). Closes are split-adjusted Yahoo bars as used by the site, not dividend-adjusted total return. The article's price as-of date is October 30, 2026. |
| Fundamentals | FY figures absent | No FY revenue, net income, assets, shares outstanding, or market capitalisation is cited in this article. Issuer CIK 1783879. The SEC companyfacts pull on October 28, 2026 returned HTTP 403 and was not retried through any other tool or endpoint; no aggregator figure was substituted (site standard is SEC filings as source). |
Methodology & disclaimer: 13F holdings are long shares unless stated; reported values include option rows for the all-institutions lens by definition. Short interest is FINRA twice-monthly settlements. Trading costs and taxes are not reflected in any figure. Past patterns are not a promise of future results. For education only — not investment advice.
This article describes filings and market data for education. It is not investment advice. Data: SEC EDGAR 13F (as of June 30, 2026, filed within 45 days), Form 4 aggregates checked through October 2, 2026 (and site aggregate as of November 1, 2026), House disclosures through October 3, 2026, SC 13D/G collection through April 30, 2026, FINRA short interest at September 30, 2026 settlement. 13F covers long positions of $100M+ managers only and is always a lagging picture. Trading costs and taxes are not reflected.
Related research: Seventeen of 147: Eagle Is 39.8% of the Tracked MercadoLibre Stake — and the Cohort Grew 11.8% While the Price Slipped 1.8% in Q2 · Seven of 147: GQG Is 93.7% of the Tracked Petrobras Stake — and It Added While the Price Fell 22.1% in Q2 · Six of 147: Baker Bros. Holds Nearly Half the Tracked Insmed Stake — and Insiders Sold $42.9M With Zero Buys in 90 Days · Track the tape on HOOD's stock page and the 13F filing season hub.
Revision history: v1.0 — November 2, 2026. Initial publication. Signals and lens aggregates: hood_13f_holders_q2.csv. Insider trades: hood_insider_form4_w90.csv. Short-interest series: hood_short_interest_ftd.csv. 13D/G rows: hood_scdg_13dg.csv. Congress history: hood_congress_history_verified.csv.