What counts as a cluster
A cluster is at least two distinct insiders selling the same issuer within a trailing window of 14 or 30 calendar days, evaluated by trade date. The event completes on the second-earliest first-filing date in the window — the first day a reader could have seen two distinct sellers on file — and we enter at the next trading day's close, so the signal uses no information that was not yet public. After a cluster completes, the same issuer cannot fire again from a trigger trade within the window, and sales sharing an issuer and completion date merge into one event.
The comparison group is a lone sale: an insider-sell-day with no other insider's sale within the same window on either side, one episode per insider per window. Only non-derivative disposals count — Form 4 code S with acquired/disposed set to disposed, on original filings only. Exercises, grants, withholding, gifts and amendments are excluded and counted in the waterfall.
The corpus is form4full: 316,796 parsed Form 4 and Form 4/A documents, filings submitted 2025-01-02 to 2026-10-02. From it, 158,169 S-disposal rows collapse to 78,920 insider-sell-days across 3,904 issuers and 17,264 insiders. Every finding here is about that window only. Prices are split- and dividend-adjusted closes, benchmarked against SPY over identical days. Excess return is stock minus SPY, in points, so for a sale a negative excess means the sale "worked" — the stock trailed the index afterwards.
The headline: clusters beat lone sales, and neither fell on average
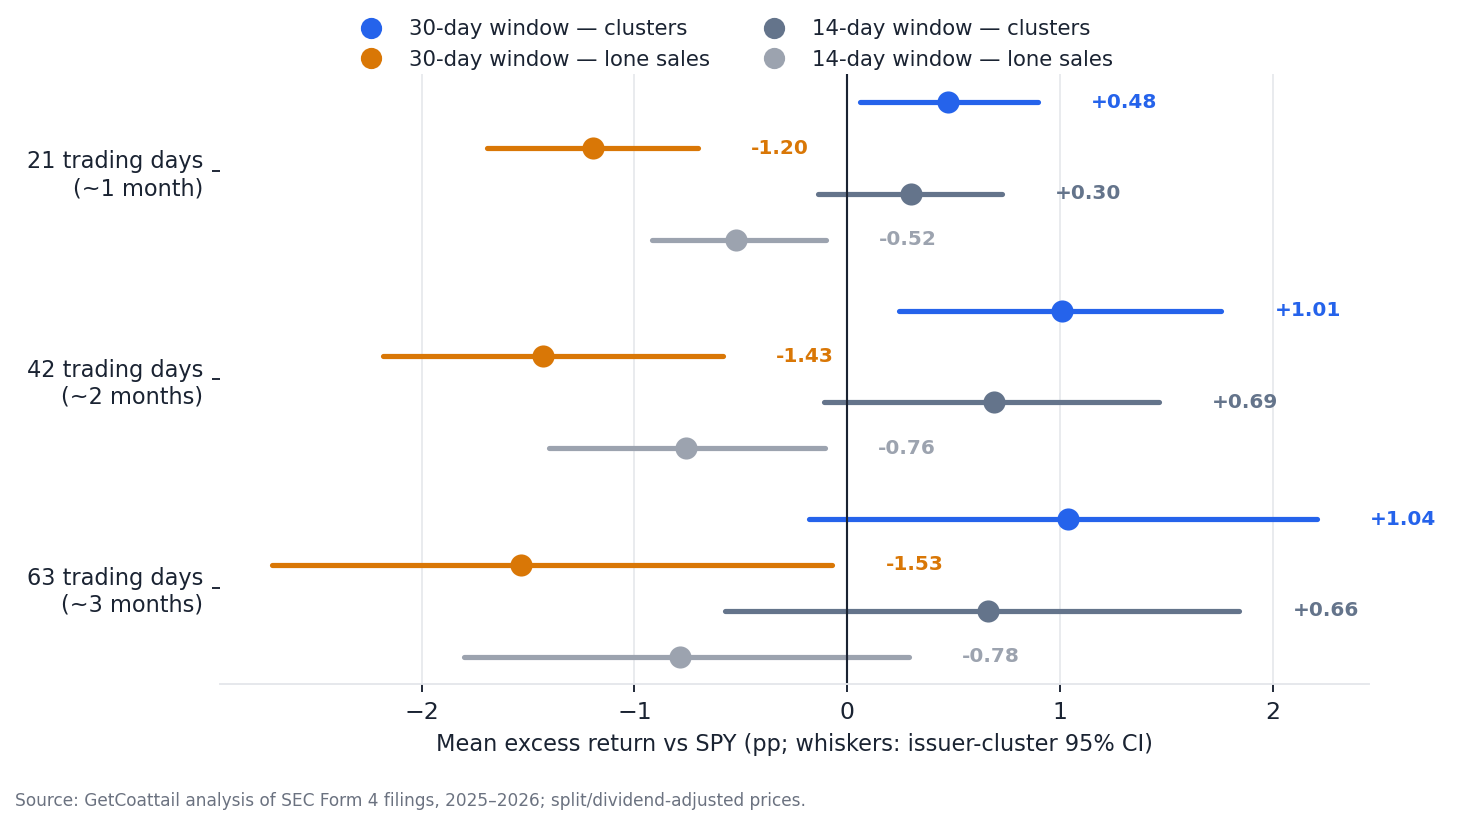
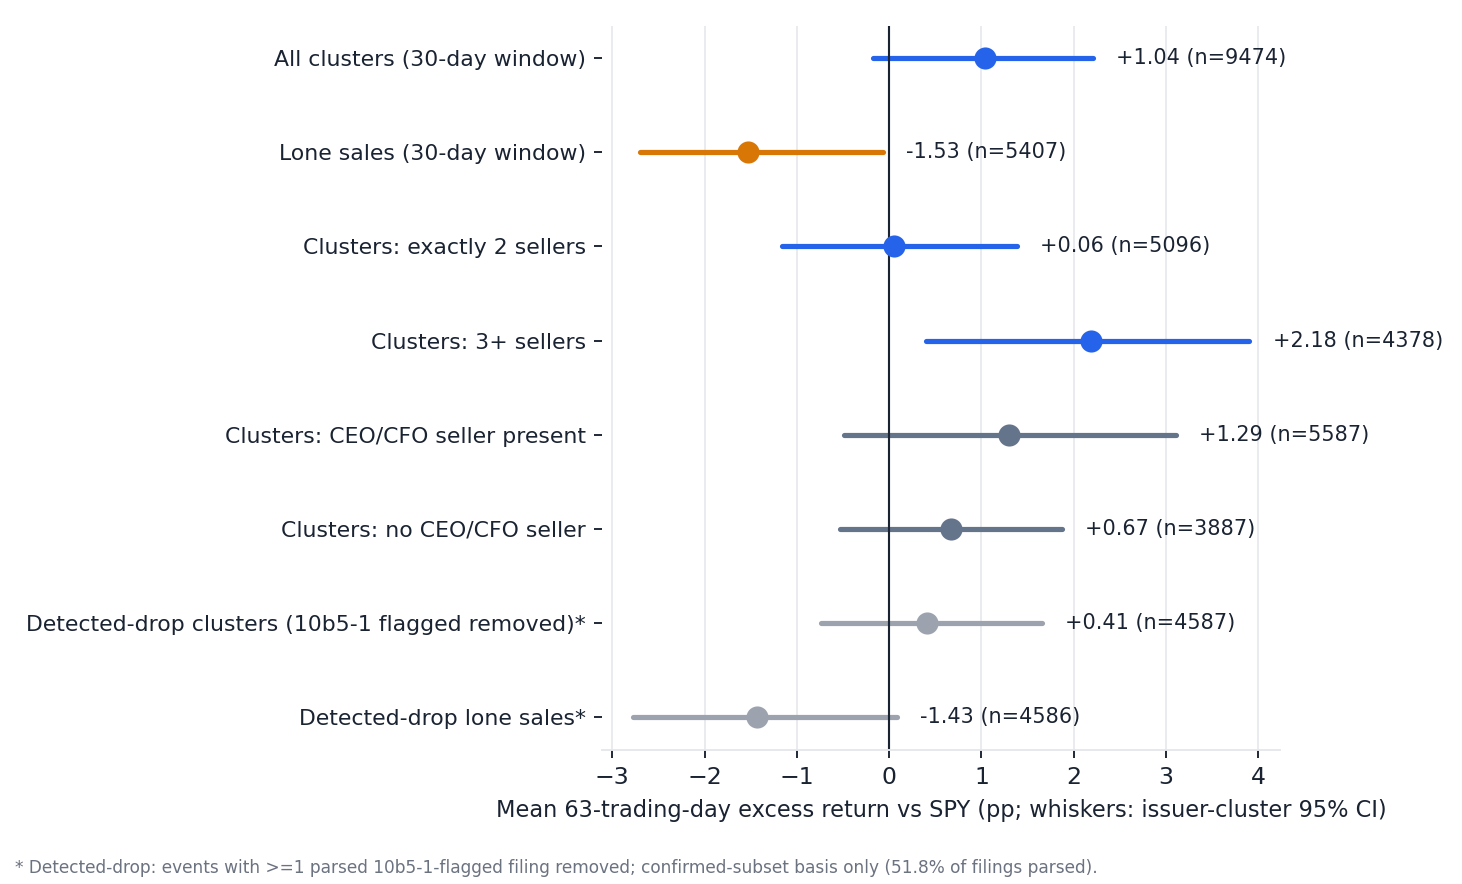
- 30-day window, 63 trading days — clusters (9,474 scored): mean excess +1.04 points (95% CI −0.18 to +2.21). Median −3.84 points; the stock trailed SPY in 56.8% of events.
- 30-day window, 63 trading days — lone sales (5,407 scored): mean excess −1.53 points (CI −2.70 to −0.07). Median −3.94 points; trailed SPY in 59.0% of events.
- Cluster minus lone difference: +2.57 points (CI +0.69 to +4.20) — the interval excludes zero.
- 14-day window, 63 trading days — clusters +0.66 points (CI −0.57 to +1.84, n=9,543, median −4.24) vs lone sales −0.78 points (CI −1.80 to +0.29, n=8,795, median −3.68); difference +1.44 points (CI −0.08 to +2.89).
At 21 and 42 days the difference excludes zero in both windows (30-day: +1.67 and +2.44 points; 14-day: +0.82 and +1.45 points).
| Group | 21 days | 42 days | 63 days |
|---|---|---|---|
| 30-day clusters | +0.48 [+0.06, +0.90] | +1.01 [+0.24, +1.76] | +1.04 [−0.18, +2.21] |
| 30-day lone sales | −1.20 [−1.69, −0.70] | −1.43 [−2.18, −0.58] | −1.53 [−2.70, −0.07] |
| 14-day clusters | +0.30 [−0.14, +0.73] | +0.69 [−0.11, +1.46] | +0.66 [−0.57, +1.84] |
| 14-day lone sales | −0.52 [−0.92, −0.10] | −0.76 [−1.40, −0.11] | −0.78 [−1.80, +0.29] |
Read that carefully. Clustered sales did not, on average, precede a relative decline. But the cluster mean itself is not a clean positive signal: in the 30-day window its interval includes zero, and the median clustered sale trailed SPY by 3.84 points. The solid result is comparative — clustered sales did better afterwards than lone sales — not absolute. A cluster is not evidence that the stock will rise. It is evidence against the folk claim that a cluster means the stock is about to fall.
The average is a tail, again
The typical event, clustered or not, trailed the index. The positive cluster mean lives in the right tail. In the 30-day window, 548 of 9,474 clusters (5.8%) gained at least 50 points on SPY after the sale, and 151 (1.6%) gained at least 100 points. Drop the top 1% of cluster outcomes (95 events) and the 63-day cluster mean flips to −1.04 points (CI −2.02 to −0.06); trim 5% off both tails and it is −1.77 points (CI −2.43 to −1.11). The 14-day window is the same shape: dropping the top 1% (96 events) flips +0.66 to −1.44 points (CI −2.44 to −0.46). Lone sales show the same tail structure, so the cluster-versus-lone gap is a statement about tails, not about the typical event.
That matters for use. If you sort by "most insiders selling" and expect the average to describe your stock, you will be misled twice: the median is negative, and a handful of enormous post-sale rises pull the mean up. The package does not claim those rises were caused by the sales.
More sellers did not mean more decline
If clustered selling were a warning, the warning should get louder with more sellers. It runs the other way. In the 30-day window at 63 days, exactly-two-seller clusters averaged +0.06 points (CI −1.16 to +1.38, n=5,096), while clusters with three or more sellers averaged +2.18 points (CI +0.39 to +3.90, n=4,378). Against lone sales, the three-or-more difference is +3.71 points (CI +1.56 to +5.87); the exactly-two difference is +1.59 points (CI −0.24 to +3.27) and includes zero. The 14-day window agrees in direction: exactly-two +0.10 points, three-or-more +1.65 points, with the three-or-more difference against lone sales at +2.43 points (CI +0.49 to +4.33).
A CEO or CFO in the cluster does not separate the result either: in the 30-day window, with one averaged +1.29 points (CI −0.49 to +3.10, n=5,587) against +0.67 points (CI −0.54 to +1.87, n=3,887) without one, a difference of +0.62 points (CI −1.50 to +2.80); in the 14-day window the difference is +0.21 points (CI −1.89 to +2.17). The one 14-day role bucket whose interval clears zero is director-involved clusters, at +1.63 points (CI +0.31 to +2.94, n=5,608) — positive, again the opposite of a warning sign.
The holdout: the difference survives, the absolute claim does not consistently survive
The time split was fixed before scoring: 2025 completions derive, 2026 completions must repeat with the same sign and an interval excluding zero. In the 30-day window at 63 days, both headline results survive: the cluster mean goes from +0.57 points (CI −1.04 to +2.12, n=5,808) in 2025 to +1.78 points (CI +0.24 to +3.46, n=3,666) in 2026, and the cluster-minus-lone difference goes from +1.14 points (CI −1.28 to +3.34) to +4.82 points (CI +2.81 to +6.92). At 21 days the cluster mean alone does not survive, while the difference does; at 42 days both survive.
In the 14-day window the picture is one notch weaker: the cluster mean alone does not survive at 63 days (+0.43 points in 2025 to +1.01 points, CI −0.56 to +2.68, in 2026), while the difference does (+0.80 points to +2.45 points, CI +0.60 to +4.32), and also survives at 21 and 42 days. So the result that replicates across both windows is comparative — clustered sales were followed by higher relative returns than lone sales — not an absolute decline, and not a clean positive signal from clusters alone.
A note on plans: selling is the planned side of the market
On the sell side, pre-scheduled plan sales are the normal state, not the exception. We parsed EDGAR full text for a finalised subset of the filings behind these events — 27,367 of 52,868 filings (51.8%), with the fetch order randomised so the subset is approximately random — and 48.5% of parsed filings carry the Rule 10b5-1 plan flag. That compares with 2.6% on the buy side in our companion buy study. Every 10b5-1 number in this piece is on that confirmed-subset basis only and must not be read as a full-population result; full coverage was not awaited when the package closed.
Removing events with a detected plan filing does not erase the ordering, but it weakens it. In the 30-day detected-drop variant, clusters average +0.41 points (CI −0.74 to +1.65, n=4,587) and lone sales −1.43 points (CI −2.77 to +0.09, n=4,586), a difference of +1.85 points (CI −0.03 to +3.65) that touches zero, and the 63-day difference no longer passes the holdout rule (validation +1.98 points, CI −0.32 to +4.13). At 21 and 42 days it still excludes zero. In the strict confirmed subset — filings all parsed, none flagged — the 30-day means are −0.71 points for clusters (n=892) and −1.62 points for lone sales (n=1,953), a difference of +0.91 points (CI −3.23 to +4.15). That subset over-represents small clusters, because full classification is likelier with fewer filings. Fair reading: detected plan sales do not explain away the ordering, but whether the positive tail concentrates in flagged or uncovered events is unresolved here.
Cases: the best, the worst, and the typical
The best sale in both windows — the most negative excess — is zSpace (ZSPC): three sellers including CEO- and CFO-titled sellers, $3,064 of member sales, completed 2026-04-08, at −102.8 points over 63 days. The worst sale — the most positive excess — is Opendoor (OPEN): two officers, $438,756 of member sales, completed 2025-06-17, at +1,602.6 points. Those two events alone show why the mean cannot be read as a typical outcome: one is a near-total relative collapse after a tiny sale, the other is a +1,602.6-point excess after a modest one.
The typical event is quieter. In the 30-day window the median cluster is BILL Holdings (BILL): two sellers, $257,392 of member sales, completed 2025-09-04, at −3.84 points. In the 14-day window it is Meta Platforms (META): six sellers, $88.5M, completed 2025-02-19, at −4.24 points. Most clusters did not crash and did not surge — they drifted slightly behind the index, while a few surged enormously.
Counterarguments and limits
The strongest counterargument is the tape itself. SPY gained over most 63-day windows in 2025–2026, and a rising tape flatters any mean with a few enormous winners. That is why we report medians, negative rates and tail-trimmed means alongside the headline: the median and trimmed mean both point the other way from the raw mean. A second counterargument is coverage: 19.4% of 14-day clusters and 19.0% of 30-day clusters could not be scored at 63 days, mostly because their windows run past the price calendar, and 450–649 events per group have no usable price series anywhere we looked. Those events are counted and never imputed, but cluster issuers score about 2–4 points higher than lone-sale issuers, largely because they are larger and better covered.
One mechanical quirk: in 14.9% of 14-day clusters and 31.7% of 30-day clusters, completion precedes the recorded trigger trade date, because the completion-anchored cooldown delays re-firing while the trailing window still qualifies. Entry is anchored to completion — the public-information date — so the signal uses no future information, but seller counts and role flags are measured over the whole firing window, which can include sales after completion. Finally, 2026 third-quarter rows are stubs that support no claim, no costs or liquidity are modelled, and nothing here is causal.
How to read a sell cluster from here
First, do not read a cluster as a sell signal on its own: in this record it predicted the opposite of a decline on average, and the typical event trailed only modestly. Second, check the mean-versus-median gap before reacting to any cluster headline: if a few names carry the story, it is a tail story, not a cluster story. Third, on our stock pages, look at the Form 4 lens the same way — how many distinct sellers, whether a plan flag is present where parsed, and what happened after the second filing became public, not after the first trade date. None of that is a trade instruction.
Methodology
Data. Form 4: form4full corpus — 316,796 parsed Form 4 and Form 4/A documents, filings submitted 2025-01-02 to 2026-10-02. Every finding in this piece is a statement about that filing window. Prices are split- and dividend-adjusted closes from our bars database and caches; where a series ends before a required bar, daily closes are spliced on at the last common date at the adjusted ratio. Benchmark and trading calendar: SPY adjusted closes through 2026-10-08.
Definitions, fixed before scoring. Insider-sell-day: (issuer, insider, trade date) non-derivative S-code disposed rows on original Form 4 only. Cluster: at least two distinct insiders within a trailing 14- or 30-calendar-day window by trade date; completion is the second-earliest first-filing date in the window; a completion-anchored cooldown of the window length follows each event; batch disclosures sharing issuer and completion date merge. Lone sale: a sell-day belonging to no cluster, with no other insider's sale within the window on either side, one episode per insider per window. Entry is the close of the next trading day after completion. Horizons 21/42/63 trading days. Excess is stock minus SPY over identical dates. Uncertainty is an issuer-cluster bootstrap, 2,000 resamples (event-level intervals are similar in width, though they do not always agree on whether zero is included). Holdout rule, fixed in advance: derivation is 2025 completions, validation is 2026 completions, and "survives" requires the validation interval to exclude zero with the derivation's sign.
Counts. 30-day window: 11,701 clusters at 2,513 issuers (6,359 exactly-two, 5,342 three-or-more) and 7,013 lone sales at 3,193 issuers; scored at 63 days, 9,474 clusters (81.0%) and 5,407 lone sales (77.1%). 14-day window: 11,842 clusters at 2,402 issuers (7,582 exactly-two, 4,260 three-or-more) and 11,278 lone sales at 3,509 issuers; scored at 63 days, 9,543 clusters (80.6%) and 8,795 lone sales (78.0%). Every waterfall closes exactly in the package integrity file. The 10b5-1 analysis is on the confirmed subset only: 27,367 of 52,868 filings parsed (51.8%), 48.5% flagged.
Limits. No claim about periods outside 2025–2026, about the 19.0–22.9% of events unscored at 63 days, or about tradability after costs and liquidity. No causal claim. Past patterns are not a promise of future results. For education only — not investment advice. Trading costs and taxes are not reflected.
Data download
Full scored event lists — both windows, with anchors, entry dates, values and 21/42/63-day excess returns: scored_insider_sell_events_w30.csv, scored_insider_sell_events_w14.csv
Revision history
Oct 25, 2026: First published.