GetCoattail Research — The Filing Tape #96. Intuit was the Nasdaq-100's top gainer in a week when chip stocks sold off, rising 9.6% as it agreed to acquire the revenue platform Sequence, and the filings describe a register reshaped by a collapsing price: 15 of the 147 superinvestors we track hold it, one of them is 47.3% of the cohort's shares, seven managers exited in the second quarter while the verified holders barely moved, its insiders recorded two purchases in the entire record against 361 sales, and short interest has halved since July.
The Hype
Intuit drew attention this week for two reasons that arrived together. Stocktwits' weekly AI roundup, published October 16, counted Intuit among the top gainers in the Nasdaq-100, up 9.6% in a week when the semiconductor ETF fell 10.2% — the largest gain in that account, ahead of Shopify's 8.3%. On October 15, Intuit announced an agreement to acquire Sequence, an AI-native revenue management platform, for undisclosed terms, adding quote-to-revenue automation for mid-market customers. A $1.38 per share dividend, declared with the fiscal-year results in August, is also payable October 16 to holders of record October 8. A Finnhub snapshot checked October 16 put the stock at $330.17, up 6.36% on the day, with a market value of about $82.27 billion, a 52-week range of $252.84 to $689.17, a five-day return of +11.08% and a one-year return of -48.97% — kept separate from our price file below, which ends October 2 at $281.08, 58.9% below its 252-session closing high of $683.39 on October 27, 2025. The bounce landed on a stock that had lost more than half its value in a year, after a second quarter in which its price fell 39.6%.
The Tape
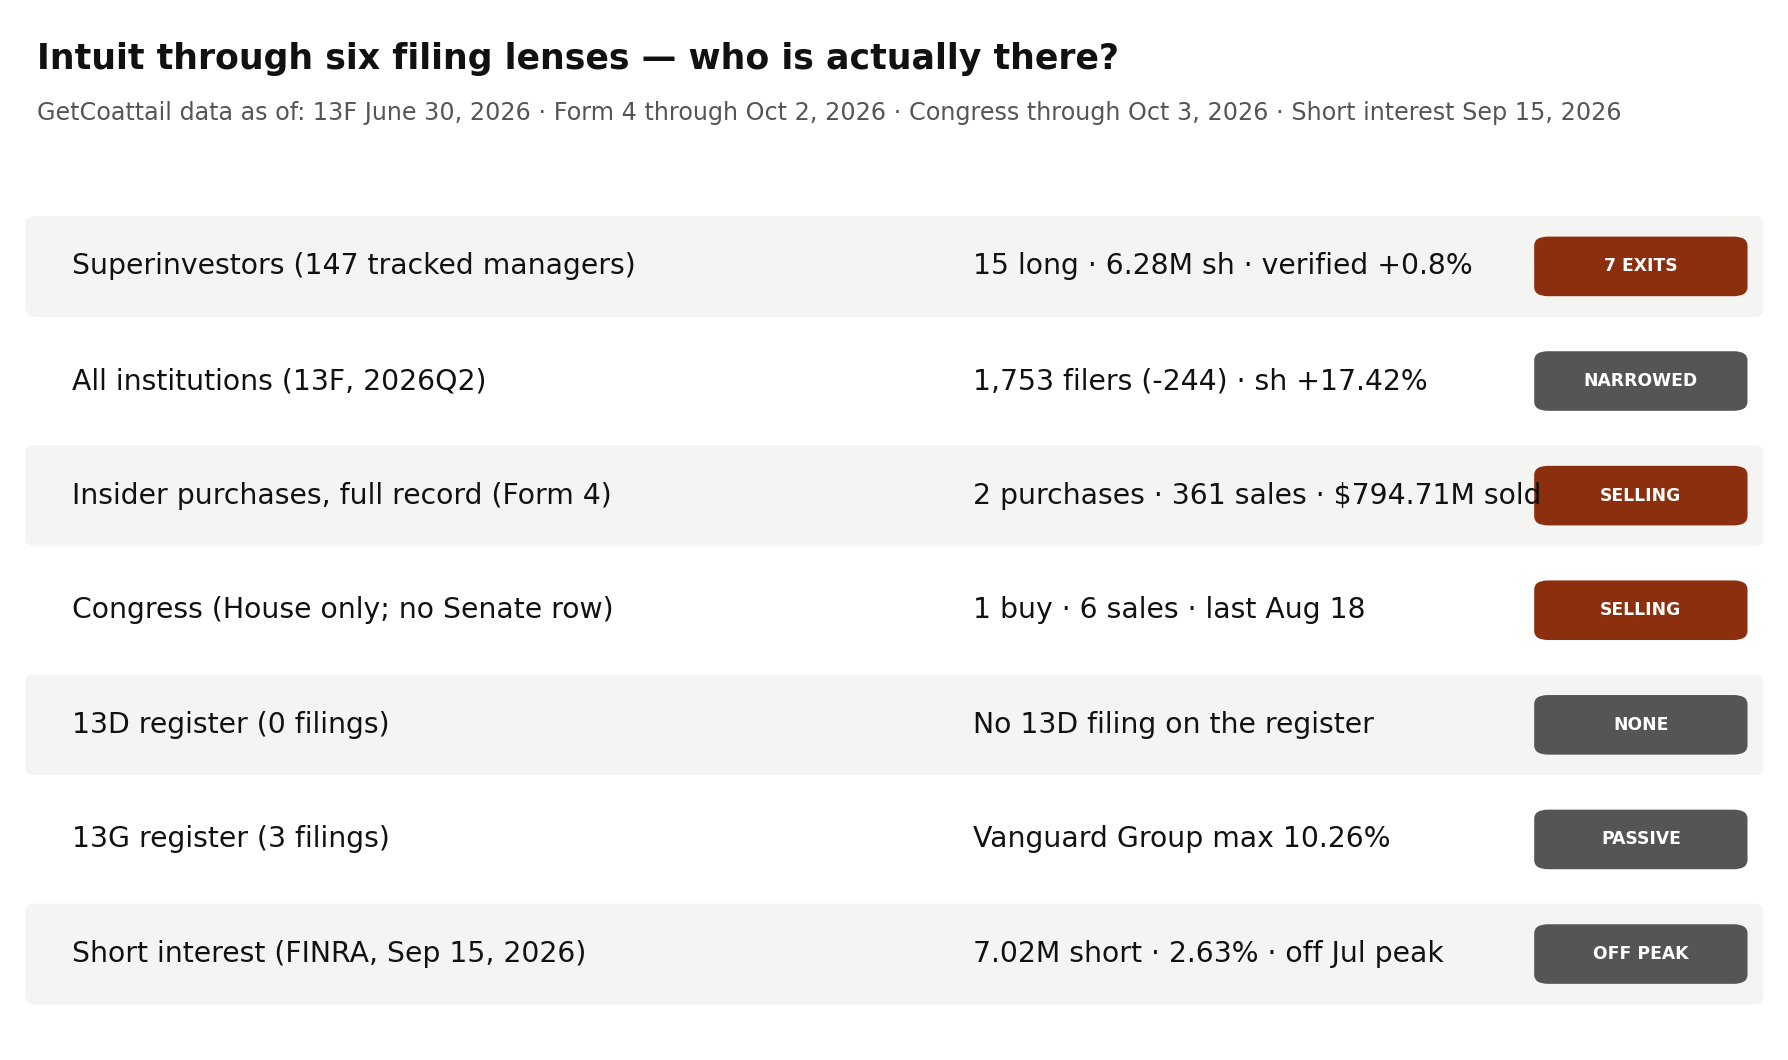
For Intuit — the ninety-sixth Filing Tape audit — the tape shows a 15-name cohort that added almost nothing net while seven managers left, a full market that shed 244 filers while adding 35.7 million shares, an insider record with two purchases against 361 sales, a congressional row that sits entirely in the House, a 5% register with no 13D-family filing, and a borrow that has fallen for four straight settlements since July.
| Lens | As of | What the filings show | Direction vs prior period |
|---|---|---|---|
| Superinvestors (13F) | Jun 30, 2026 | 15 long holders; 6,281,998 shares; $1,639,826,212 | Verified continuing holders +0.8% vs Q1; 5 labelled INCREASED, 8 DECREASED, 1 UNCHANGED, 1 NEW; 7 managers exited in Q2 |
| All institutions (13F) | Jun 30, 2026 | 1,753 filers; 240,550,525 shares | Filers -244; shares +17.42% |
| Insiders (Form 4) | Oct 2, 2026 | 2 purchases in the full parsed record; 361 sales | Last 90 days: 0 purchases, 3 sales |
| Congress | Oct 3, 2026 | 1 purchase and 6 sales in the combined aggregate, all of it in the House; no Senate row | Last purchase Aug 18, 2026 |
| 13D/G | Apr 30, 2026 | 3 parsed filings (0 SC 13D-family, 3 SC 13G-family); register maximum 10.26% (The Vanguard Group) | Latest filing reports 7.53% as of Mar 31, 2026 |
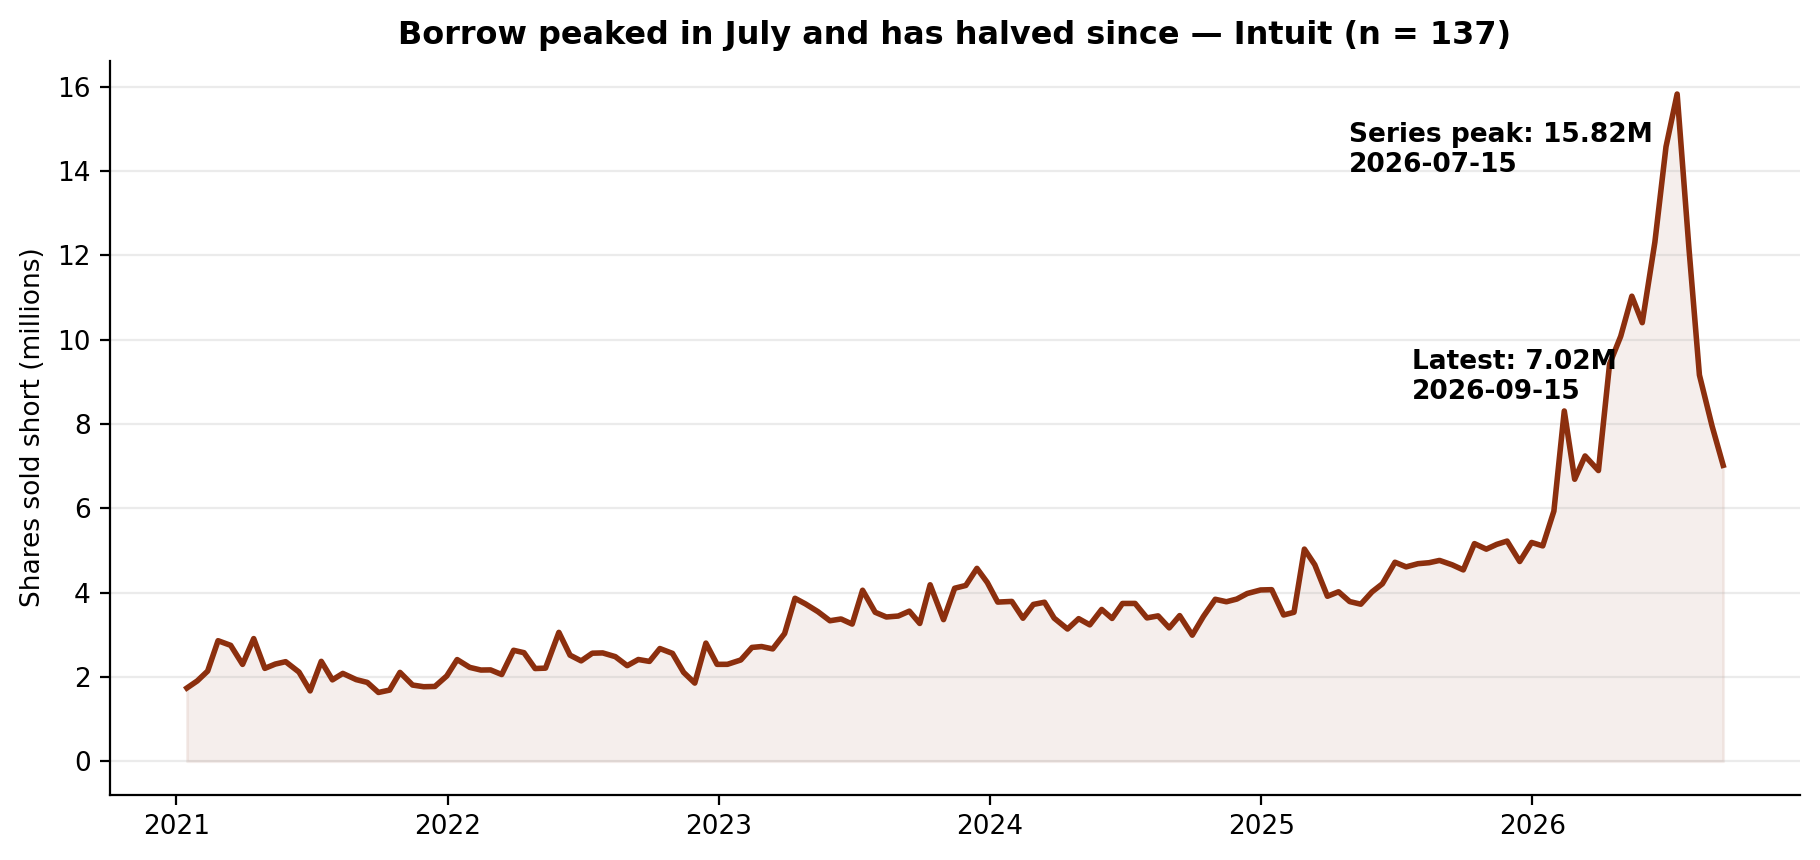
| Short interest (FINRA) | Sep 15, 2026 | 7,016,125 shares; 2.63% of shares outstanding | Down 55.7% from the series peak on Jul 15, 2026; up 50.6% year over year |
Lens 1 — the superinvestors: 15 holders, one of them 47.3% of the shares, seven exits, and a verified core that stood still. We track 149 large, mostly long-only managers whose 13F portfolios we collect directly from SEC EDGAR — 147 managers are in the collection: 144 at a June 30 period-end, and 3 early filers already at September 30. There is no period mix among the holders: all 15 long holders are June 30, 2026 rows, totalling 6,281,998 shares worth $1,639,826,212 on the main CUSIP. One further row — a Flossbach von Storch call option row on a second CUSIP, covering 12 shares — is not counted in the long totals. Eagle Capital Management is the largest holder: 2,973,884 shares worth $776,183,703 — 47.3% of the cohort — at a 2.37% portfolio weight, labelled INCREASED (+28.1%). Next, Generation Investment Management holds 1,095,488 shares worth $285,922,368 — 17.4% of the cohort — labelled INCREASED (+33.0%), and Lindsell Train holds 666,883 shares labelled DECREASED (-9.1%). The labels read five INCREASED, eight DECREASED, one UNCHANGED and one NEW — First Pacific Advisors, entering with 331,964 shares. All 14 continuing holders verify row by row against the first quarter, moving together from 5,901,525 shares at March 31 to 5,950,034 at June 30 (+48,509 shares, +0.8%) — in a quarter the price fell 39.6%. The largest percentage increase was Yacktman's, +6561.4% from a small base (7,375 shares to 491,278); the largest share increase was Eagle's (+652,719); the largest cut was Edgewood's, from 1,154,334 shares to 9,074 (-99.2%). Against that stillness, seven tracked managers exited in the second quarter — Winslow Capital Management (651,617 shares held at March 31), Sustainable Growth Advisers (635,752), Guinness Asset Management (71,115), ShawSpring Partners (40,939), Polen Capital Management (19,853), Maverick Capital (1,564) and Pzena Investment Management (560), 1,421,400 prior shares between them. One further name belongs to the next quarter: David Katz - Matrix Asset Advisors held 10,770 shares at June 30, and its early September 30 filing, filed October 13, no longer carries the name. 13F figures are as of June 30, 2026; funds have up to 45 days to file, so this is the complete second-quarter picture — and, as ever, a lagging one.
Lens 2 — institutions: 244 fewer filers, 35.7 million more shares, a smaller reported value. At June 30, 2026, 1,753 institutions reported positions, down 244 from 1,997 at March 31 (-12.22%); 1,744 are long. Reported shares rose 17.42%, from 204,855,128 to 240,550,525 — a gain of 35,695,397 shares — while reported value fell 27.25% to $64,013,566,733, labelled "reported" because the aggregate includes option rows (see methodology). Fewer hands held more shares of a cheaper stock.
Lens 3 — insiders: two purchases in the entire parsed record, against 361 sales — and neither purchase is an officer's. The parsed Form 4 record holds 210 filings through October 2, 2026, with 2 open-market purchase transactions in all of it: 1,750 shares for $541,665.12, by 1 buyer, both within the last year — and zero officer purchases in any window. Sales number 361 across the record: 1,192,292.29 shares for $794,705,994.74, by 11 sellers, 237 of them officer sales. The one-year window holds 119 of those sales (543,729.61 shares, $358,532,557.32), and the last 90 days hold 3 sales of 1,191.94 shares for $407,015.79, by 2 sellers — and no purchase.
Lens 4 — Congress: one purchase and six sales, all of it in the House. The combined record (as of October 3, 2026) carries a row with 1 purchase and 6 sales, one member, the last purchase dated August 18, 2026. The House aggregate carries the identical row. The Senate aggregate carries no row for this name at all, so the combined figure is a House figure, leaning to sales six to one.
Lens 5 — the 5% register: three filings, all passive, no 13D. Our full parse holds 3 SC 13D/G filings matching the site aggregate exactly — no SC 13D-family filing and three SC 13G-family filings (one SC 13G, two SC 13G/A), two of them amendments, across two names. The register maximum is 10.26%: The Vanguard Group reports 28,621,457 shares as of September 30, 2025, filed October 6, 2025 as SC 13G/A. The latest filing is Vanguard Capital Management's SC 13G, reporting 20,831,573 shares (7.53%) as of March 31, 2026, filed April 30, 2026. The third row is The Vanguard Group printing 0 shares (0.0%) as of March 13, 2026 — reported as filed, and not combined with the other Vanguard name.
Lens 6 — short interest: 7,016,125 shares, peaked in July, halved since. The series covers all 137 FINRA settlements in the collection, from January 15, 2021 to September 15, 2026. As of September 15, 2026, 7,016,125 shares were sold short, down 11.8% from the prior settlement (7,950,442 on August 31, 2026), at 2.27 days to cover. The series maximum is 15,822,306 shares on July 15, 2026 (verified by a maximum query over the series), so the latest sits 55.7% below the peak, after four consecutive declines — and 50.6% above the year-ago settlement (4,657,282 on September 15, 2025). Against 267,236,000 shares outstanding, the borrow is 2.63% of the share count.
The Gap
The narrative arriving with this week's session is a rebound with a headline attached: the Nasdaq-100's largest gain in Stocktwits' weekly account, an acquisition, and a dividend landing today — on a stock still down about half over one year. The filings, which mostly end before that session, describe a register the falling price had already rearranged. As the price fell 39.6% in the second quarter, the tracked cohort's verified core stood still (+0.8%, 5,901,525 shares to 5,950,034) while seven managers exited holdings that had totalled 1,421,400 shares, and the largest holder added: Eagle Capital Management's 2,973,884 shares are 47.3% of what remains. The full market rhymes — 244 fewer filers (-12.22%) holding 35,695,397 more shares (+17.42%). Insiders did not buy the decline at any point our record covers: two purchases by one buyer, none an officer's, against 361 sales worth $794,705,994.74. Congress leans the same way in miniature — one House purchase against six sales, and no Senate row. The 5% register holds no activist: its three prints are Vanguard names, the largest at 10.26%. The borrow tells the most recent part: short interest spiked to a series peak of 15,822,306 shares on July 15, 2026 — after the quarter ended — and has since fallen four settlements in a row to 7,016,125, still 50.6% above a year ago. One plausible reading is that the week's bounce landed on a positioning picture set by the decline — a narrower, more concentrated register, insiders absent as buyers throughout, and a borrow already unwinding.
What Would Change the Picture
Nothing above is a recommendation. It is a record. These filings would change it:
- 1. The 2026Q3 13Fs (filing window closing mid-November 2026). All 15 long holders sit on a June 30 period-end, and one early third-quarter filing already shows movement — David Katz - Matrix Asset Advisors' September 30 filing no longer carries its 10,770 June 30 shares. Whether the seven second-quarter exits become a longer list, and whether Eagle's 47.3% share grows or shrinks, decides whether the register still reads as narrowing.
- 2. A first officer purchase. The record holds 2 purchases by one buyer, none an officer's, against 237 officer sales — and no purchase in the last 90 days. A single open-market officer purchase, at any size, would be this lens's first fact of its kind in our record.
- 3. A Senate row, or a shift in the House balance. The combined aggregate rests on one House member's record — one purchase (last August 18, 2026) against six sales — and the Senate aggregate has no row. A first Senate-side transaction, or House buying that outweighs the sales, changes a lens that points one way.
- 4. A first 13D, or a fresher passive print. The register's 3 filings are all passive 13G-family prints, and its maximum — 10.26% — is dated September 30, 2025. A first activist-style 13D, or a materially different Vanguard print, would be this lens's first change of kind.
- 5. Short interest picking a direction. The borrow stands at 7,016,125 shares, down 55.7% from its July 15, 2026 peak of 15,822,306 after four straight declines, but up 50.6% year over year. A move back above the August 14, 2026 reading of 9,158,101 would rebuild it; a fall toward the year-ago level of 4,657,282 would complete the unwind.
Related reading: Sixteen of 147: One Holder Is 93.1% of the Superinvestors' Coca-Cola Stake. Its Insiders Sold $87.9 Million in 90 Days. — Filing Tape #95; Twenty of 147: The Superinvestors Cut PepsiCo 30.2% in Q2. Its Insiders Have Never Bought a Share. — Filing Tape #94. Intuit's own page: Intuit (INTU) on GetCoattail.
Methodology and data notes
- As-of & limits: The lenses rest on different clocks, none live: 13F is a June 30, 2026 snapshot published up to 45 days later; Form 4 runs through October 2, 2026; Congress aggregates run through October 3, 2026; 13D/G through April 30, 2026; short interest through September 15, 2026; the price file ends October 2, 2026. Three limits are specific to this audit. First, the roster expanded before the recent audits — from 85 managers (83 filing) to 149 (147 filing) — so "of 147" counts are not comparable to earlier pieces' "of 83" figures. Second, this name's superinvestor picture spans two CUSIPs: the long holders sit on the main CUSIP, and one call option row sits on a second CUSIP — the long totals in this audit exclude that option row, as stated wherever they appear. Third, this week's session (through October 15, 2026) postdates every lens here; the session is known to this audit only from outside coverage, not from our own files.
- Superinvestor lens: 147 managers in the collection (of a 149-manager roster; 144 at a June 30, 2026 period-end and 3 early filers at September 30, 2026) collected directly from SEC EDGAR Form 13F (managers_13f collection, regenerated October 15, 2026 for the expanded roster); Intuit long positions identified by the main CUSIP 461202103. Fifteen distinct managers hold long positions, totalling 6,281,998 shares; the collection carries one option row for this issuer (Flossbach von Storch, a call on CUSIP 461202903 covering 12 shares, labelled UNCHANGED), which is excluded from every long total in this article. The direction count on the collection's labels, across the long rows, is five INCREASED, eight DECREASED, one UNCHANGED and one NEW — all of them measuring the second quarter against the first, because every long holder in this name is on the same period-end. Eagle Capital Management's share of the cohort is 47.3% = 2,973,884 / 6,281,998; Generation Investment Management's is 17.4% = 1,095,488 / 6,281,998. Fourteen of the 15 holders' reported values imply exactly $261.00 per share, the June 30, 2026 close in our price file; the one exception is DJE Kapital at $264.72, printed as filed and not used as a price check. Quarter-to-quarter continuing totals are published in this audit, because every continuing holder verifies: following the rule used in the previous audits, each continuing holder's first-quarter row was accepted only when (a) it sits under the same filing-agent prefix as the manager's second-quarter accession — the pipeline files' accession prefixes identify filing agents, not managers, and several prefixes are shared — and (b) the row's implied shares-change reproduces the manager's EDGAR shares-change label at one decimal place. All 14 continuing holders verify exactly that way (first-quarter rows including 2,321,165 shares for Eagle Capital Management, 1,154,334 for Edgewood Management, 823,962 for Generation Investment Management and 7,375 for Yacktman Asset Management), so the continuing total is 5,901,525 shares at March 31 moving to 5,950,034 at June 30 (+0.8%). The pipeline register totals are not identical to the cohort totals for this name, and are not used as cohort figures: the register carries 16 second-quarter rows totalling 6,292,768 shares, because it also holds David Katz - Matrix Asset Advisors' June 30 row of 10,770 shares — Katz is one of the three September 30 early filers, so in the EDGAR collection its current filing is the third-quarter one (filed October 13, 2026), its June 30 position appears only as the prior holding on its exit list, and its absence from that third-quarter filing is reported in this audit as a third-quarter exit, separate from the seven second-quarter exits by June 30 filers listed in Lens 1.
- Full-market lens: SEC Form 13F Data Sets full-market aggregation. The primary table is the full13f collection's by-ticker file (holders = distinct filers reporting the ticker's CUSIP; 1,744 reported long positions out of 1,753 filers). Intuit carries a single CUSIP in this aggregation (461202103), and the backfill fixtures' by-CUSIP row for it matches the by-ticker row on every field — holders, long holders, shares, reported value, prior holders and prior reported value — exactly. The by-ticker file's entered/exited fields (1,359 and 1,603, a net of -244 that matches the change in holder count) are gross flows, so this audit headlines the net change. Reported-value caution: the aggregate value ($64,013,566,733 over 240,550,525 shares) implies $266.11 per share against a June 30, 2026 close of $261.00 in our price file, a gap of +1.96% — printed here as found. The aggregate sums the VALUE of every information-table row — including put and call option rows — while the share count covers long common-stock rows only, so we headline filer and share counts and label dollar values "reported."
- Insider lens: full-parse Form 4 aggregation (agg_by_ticker), record as of October 2, 2026 (210 filings). Sale and purchase counts are transaction-code counts (S and P) in non-derivative rows; grants and exercises are not counted as purchases, and one filing can contain many transaction rows. Purchase transactions total 2 across the record (1,750 shares, $541,665.12, 1 buyer), all of them in the one-year window (October 3, 2025 to October 2, 2026), zero in the 90-day window (July 5 to October 2, 2026), with zero officer purchase transactions in every window. Sale transactions total 361 across the record (1,192,292.29 shares, $794,705,994.74, 11 sellers, 237 of them officer sale transactions), 119 in the one-year window (543,729.61 shares, $358,532,557.32, 5 sellers) and 3 in the 90-day window (1,191.94 shares, $407,015.79, 2 sellers, 2 of them officer sale transactions). The site's insider aggregate (compiled as of October 16, 2026, over its own 90-day window) reports 0 purchases, 3 sales, 0 buyers and 2 sellers with $0.00 of purchase value and $407,015.79 of sale value — an exact match to the full parse's 90-day window. The full-parse aggregate's sale totals imply $341.47 per share for the 90-day window, $659.39 for the one-year window and $666.54 for the full record, each inside the traded close range of its window on our price file ($268.03 to $369.92 for the 90-day window, $255.07 to $683.39 for the one-year window, $255.07 to $807.39 for the full record), and its purchase total implies $309.52 per share, inside the one-year range, so the totals are cited as figures in this article.
- 13D/G lens: full-parse SC 13D/G parsed filings (3 filings matching issuer CIK 896878 on CUSIP 461202103: one SC 13G and two SC 13G/A, the /A filings being amendments; there is no SC 13D-family filing for this issuer in the parsed coverage), filings through April 30, 2026. The site aggregation carries this name under a ticker-keyed row; that row (3 filings, 0 D-filings, 3 G-filings, 2 amendments, 2 reporters, latest date April 30, 2026, maximum 10.26% and 49,453,030 reported shares) matches the parsed filings on filings, form mix, amendments, latest date, maximum and reported-share total. The parsed reporting-person rows sum to 49,453,030 shares, but that total sums reporting-person rows across different dates, so it is not used as a stake figure in the article. The rows are reported as filed, under the names exactly as they appear: The Vanguard Group printing 28,621,457 shares at 10.26% as of September 30, 2025, filed October 6, 2025 as SC 13G/A; The Vanguard Group printing 0 shares at 0.0% as of March 13, 2026, filed March 27, 2026 as SC 13G/A; and Vanguard Capital Management printing 20,831,573 shares at 7.53% as of March 31, 2026, filed April 30, 2026 as SC 13G. The two Vanguard names are separate reporting persons as filed and are not combined in this audit. The parsed coverage for this issuer holds these 3 filings; a 5% holder that has not filed in the covered window would not appear here.
- Congress lens: Senate PTR archive and House PTR archive as maintained on this site. The combined record (as of October 3, 2026) carries an Intuit row with 1 purchase and 6 sales (one member, party listed as D in the aggregate, last purchase August 18, 2026); the House aggregate (as of October 3, 2026) carries the identical row from the same member; and the Senate aggregate carries no row for this name. This audit therefore describes the combined figure as a House record, not as a two-chamber signal.
- Short interest lens: FINRA Equity Short Interest files (biweekly settlement dates), collected directly from FINRA's public distribution. The published series covers all 137 settlements in the collection, from January 15, 2021 (first settlement in the series, 1,735,067 shares) to September 15, 2026. The latest reading is 7,016,125 shares on September 15, 2026, down 11.8% from the prior settlement (7,950,442 on August 31, 2026). The series maximum is 15,822,306 shares on July 15, 2026 (verified by a maximum query over the series, not read off the latest row), so the latest reading sits 55.7% below the maximum, after four consecutive declines (12,142,132 on July 31, 9,158,101 on August 14, 7,950,442 on August 31 and 7,016,125 on September 15). The year-ago settlement (September 15, 2025) printed 4,657,282 shares, so the latest reading sits 50.6% above a year ago. The series minimum is 1,629,954 shares on September 30, 2021. Two comparability notes on this series: the files report each settlement as filed and do not restate earlier settlements, and the two largest steps between consecutive settlements are 1.512x — between the November 30, 2022 settlement (1,852,411 shares) and the December 15, 2022 settlement (2,800,450 shares) — and 1.424x between the February 14, 2025 and February 28, 2025 settlements; every percentage comparison in this article is computed between settlements on or after September 15, 2025, so neither step enters any of them. FINRA publishes each settlement about two weeks after the fact, so the October price action is not yet in this series. The share-count ratio (2.63%) uses the fundamentals file's shares-outstanding figure below.
- Fundamentals note: our fundamentals collection carries Intuit's revenue of $21,448,000,000, net income of $4,566,000,000 and assets of $36,786,000,000, each labelled fiscal 2026 in the file (the issuer's fiscal year ends July 31). The file is marked ok for this name, with no missing fields: shares outstanding of 267,236,000 (as of August 31, 2026 in the file, sourced in the file to the share count) and a file-computed market value of $77,447,664,507.57. The file does not flag the issuer as a foreign private issuer, and it carries SIC 7372, Services-Prepackaged Software. The file's price for the name is $289.81 as of October 6, 2026; our daily-close file ends October 2, 2026 at $281.08, and we keep the two files' figures separate rather than blending them.
- Prices: our own daily-close file for Intuit through October 2, 2026 ($281.08 close, -57.6% year to date on that file; the 252-session closing high is $683.39 on October 27, 2025, so the last close sits 58.9% below it; the 252-session closing low is $255.07 on June 25, 2026, so the last close sits 10.2% above it; closes of $432.38 at March 31, 2026 and $261.00 at June 30, 2026, a second-quarter change of -39.6%; change from June 30 to October 2 of +7.7%; change from the September 30, 2025 close of $682.91 of -58.8%). The series in our price file begins June 1, 2021 at $438.66 and holds 1,342 rows; the file's full-period close range is $255.07 to $807.39.
- Market context sources: Stocktwits' weekly AI roundup carried by Asianet Newsable (published October 16, 2026, checked October 16, 2026; semiconductor ETF down 10.2% on the week; Intuit up 9.6% and Shopify up 8.3% among the Nasdaq-100's top gainers); ad-hoc-news' report of October 16, 2026 (checked October 16, 2026; Intuit announced on October 15 an agreement to acquire Sequence, an AI-native revenue management platform, on undisclosed terms, to add quote-to-revenue automation to Intuit Enterprise Suite and QuickBooks Online Advanced; market value $88.2 billion as of October 15 in that report's snapshot — a different snapshot from the Finnhub figure below, and neither is a GetCoattail measurement); StockTitan's summary of Intuit's August 25, 2026 Form 8-K (checked October 16, 2026; quarterly dividend of $1.38 per share payable October 16, 2026 to holders of record October 8, 2026); and the Finnhub market snapshot for Intuit checked October 16, 2026 (price $330.17, up 6.36% on the day against a $310.44 previous close, market value about $82.27 billion, 52-week range $252.84 to $689.17, five-day return +11.08%, one-month return +3.78%, one-year return -48.97% — a third-party snapshot, not a GetCoattail measurement, and kept separate from our price file above). Figures we could not confirm were left out; the external items above are reported speech from those outlets, not GetCoattail measurements.
- Intuit is in the GetCoattail stock-page universe: Intuit (INTU) stock page. Series data: intu_lens_data.csv · intu_short_interest_series.csv. Earlier audits: Coca-Cola · PepsiCo.
Past patterns are not a promise of future results. For education only — not investment advice.
This article describes public filings as of the dates stated. It is not investment advice and makes no recommendation. Filings lag reality: 13F positions are as of June 30, 2026, and later trading is not yet public.
Revision history
- v1.0 — October 16, 2026: first publication.