GetCoattail Research — The Filing Tape #146. Intuitive Surgical beat third-quarter consensus on October 20, 2026, and "isrg stock" is trending in U.S. Google searches on the print. The filings behind that attention describe a register moving the other way: ten of the fifteen tracked holders at June 30 cut their positions in the second quarter, the verified continuing cohort fell 29.7%, insiders have never recorded a purchase, and the borrow sits 1.3% below its series peak.
The Hype
The attention is an earnings print. Zacks reported on October 20, 2026 that Intuitive Surgical earned $3.00 per share in the September quarter against a consensus estimate of $2.61 — a surprise of +14.94% — on revenues of $3.05 billion, 5.84% above consensus and up from $2.51 billion a year earlier, with earnings per share up from $2.40 a year earlier; the company has now beaten the earnings consensus four quarters in a row, and the outlet ranks it #2 (Buy), with next-quarter consensus at $2.84 per share on $3.21 billion and full-year consensus at $10.74 on $11.74 billion. A companion Zacks report put revenue growth at 21.7% year over year, with 546 surgical systems placed against an average estimate of 475 and an installed base of 12,094 systems. Zacks The same outlet notes the shares had lost about 23.5% since the beginning of the year against a 12.4% gain for the S&P 500. Our price file, on split-adjusted closes, adds the path: the stock fell 13.7% in the second quarter, from $460.99 on March 31 to $397.68 on June 30, and closed at $391.95 on October 2 — down 30.8% year to date, 33.9% below its 252-session high close of $592.85, set on January 6, 2026. A beat, a buy rank and a stock down by almost a third on the year: the filings answer who held it into that slide, and in which direction they moved.
The Tape
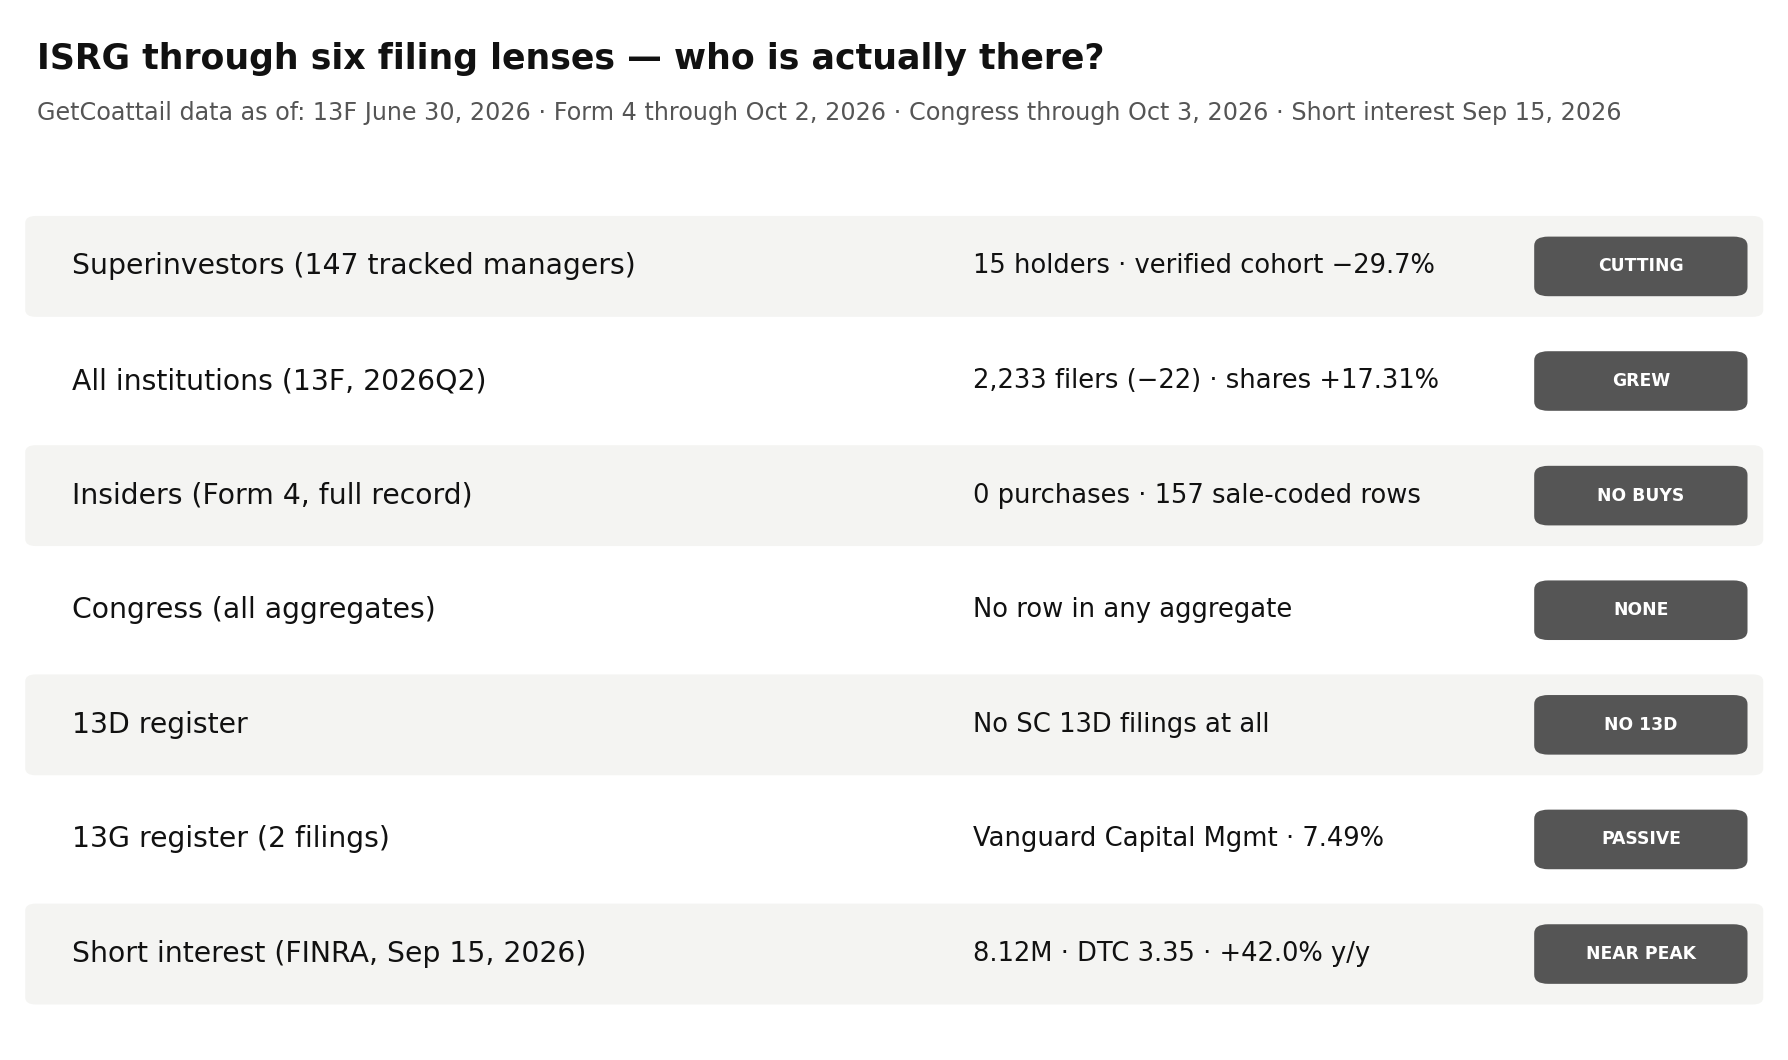
For Intuitive Surgical — the one hundred and forty-sixth Filing Tape audit — the tape shows a tracked register that cut by almost a third on a verified basis while two new holders entered, a full market that added shares through 22 fewer filers, an insider record with no purchase in any window, no congressional row, a 5% register of two passive filings, and a borrow within sight of its peak.
| Lens | As of | What the filings show | Direction vs prior period |
|---|---|---|---|
| Superinvestors (13F) | Jun 30, 2026 | 15 holders of 147 tracked managers hold 6,576,838 shares; 10 decreased, 3 increased, 2 new | Verified continuing cohort vs Q1: −29.7% |
| All institutions (13F) | Jun 30, 2026 | 2,233 filers; 302,442,187 shares; reported value $117,359,893,920 | Filers −22; shares +17.31%; reported value +3.61% |
| Insiders (Form 4) | Oct 2, 2026 | Last 90 days: 0 purchases and 20 sale-coded rows worth $4,980,790.82; last year: 0 purchases and 83 sale-coded rows worth $93,421,053.10 | No purchase in any window — the full record is also zero |
| Congress | Oct 3, 2026 | No row in the combined, House or Senate aggregates | None recorded |
| 13D/G | Apr 30, 2026 | 2 parsed filings (0 SC 13D family, 2 SC 13G family); register maximum 7.49% | Latest filing, Apr 30, 2026, prints Vanguard Capital Management at 7.49% as of Mar 31, 2026 |
| Short interest (FINRA) | Sep 15, 2026 | 8,117,017 shares; 3.35 days to cover; 2.30% of the share count | Up 42.0% from a year ago; 1.3% below the series peak |
Lens 1 — the superinvestors: fifteen holders, ten of them cutting. We track 149 managers whose 13F portfolios we collect from SEC EDGAR — 147 are in the collection (144 at a June 30 period-end, 3 early filers at September 30) — and the June 30, 2026 register is 15 distinct managers holding 6,576,838 shares worth $2,615,485,298, long only, with no option rows: 10 rows are labelled DECREASED, 3 INCREASED and 2 NEW. Sands Capital Management is the largest holder: 1,252,424 shares worth $498,063,976 — 19.0% of the tracked stake — at a 1.85% portfolio weight, labelled DECREASED at −5.2%. Edgewood Management is second at 1,042,949 shares (15.9% of the cohort), down 33.0%. The two new holders are not small: GQG Partners opened 780,428 shares and D1 Capital Partners opened 574,200 shares. Every continuing holder's quarter was verified row by row by two pairing methods (methodology): the 13 verified continuing holders fell from 7,429,947 shares at March 31 to 5,222,210 at June 30, a cut of 29.7%, and three holders exited outright (RTW Investments, 220,000 shares at March 31; Axiom Investors, 22,780; Dodge & Cox Funds, 500). The steepest single cut is Winslow Capital Management, from 1,160,360 shares to 7,450 — down 99.4%, a near-exit rather than a trim. One September 30 early filer holds the name: Sarasin & Partners, at 290,696 shares, labelled INCREASED at +18.9% against its own June register row of 244,426 shares (verified in the methodology); Sarasin's path runs against the cohort's, rising from 107,124 shares at March 31. The June register implies $397.68, the June 30 close exactly. 13F figures are as of June 30, 2026, published up to 45 days later.
Lens 2 — institutions: fewer filers, 17.31% more shares. At June 30, 2026, 2,233 institutions reported positions on the name's single CUSIP, down 22 from 2,255 at March 31 (−0.98%); 2,228 are long. Reported shares rose 17.31% to 302,442,187 (+44,636,494 shares), and reported value rose 3.61% to $117,359,893,920, labelled "reported" because the aggregate includes option rows (methodology) — a 17.31% share increase compounded by a 13.7% price fall is what produces a value increase of only 3.61%. Flow counts agree (1,646 entered, 1,668 exited, net −22). The single-CUSIP aggregate matches the by-ticker total on every field (methodology), and implies $388.04 against the $397.68 close. The tracked cohort's 6,576,838 shares are 2.17% of the shares institutions report.
Lens 3 — insiders: no purchase, in any window, in the whole record. The parsed Form 4 record holds 162 filings through October 2, 2026, and across the full record there is no open-market purchase at all — zero purchase rows against 157 sale-coded rows worth $160,511,632.96, by 16 sellers, 137 of them officer rows. The last year holds no purchase, against 83 sale-coded rows across 175,918 shares worth $93,421,053.10, by 12 sellers, and the last 90 days hold no purchase, against 20 sale-coded rows across 12,603 shares worth $4,980,790.82, by 5 sellers. The recorded sales price inside their windows: the 90-day rows imply $395.21 and the one-year rows imply $531.05, each inside the corresponding close range in our price file (methodology). The site's insider aggregate, over its own 90-day window to October 21, 2026, records the identical line (0 purchases, 20 sales worth $4,980,790.82, 5 sellers): the two aggregations agree exactly.
Lens 4 — Congress: no row in any aggregate. The combined aggregate (as of October 3, 2026), the House aggregate (as of October 3, 2026) and the Senate aggregate (as of October 1, 2026) each carry no row for this name — no purchase and no sale is recorded in any of the three.
Lens 5 — the 5% register: two passive filings, one of them a zero. Our full parse holds 2 SC 13D/G filings matching the site aggregate exactly — 0 SC 13D family and 2 SC 13G family, 1 of them an amendment; 2 reporter names across 2 rows. The maximum, and the latest filing, is Vanguard Capital Management at 26,601,419 shares and 7.49% as of March 31, 2026 (filed April 30, 2026, SC 13G). The only other row is The Vanguard Group at 0 shares and 0.0% as of March 13, 2026. There is no activist 13D anywhere in the register.
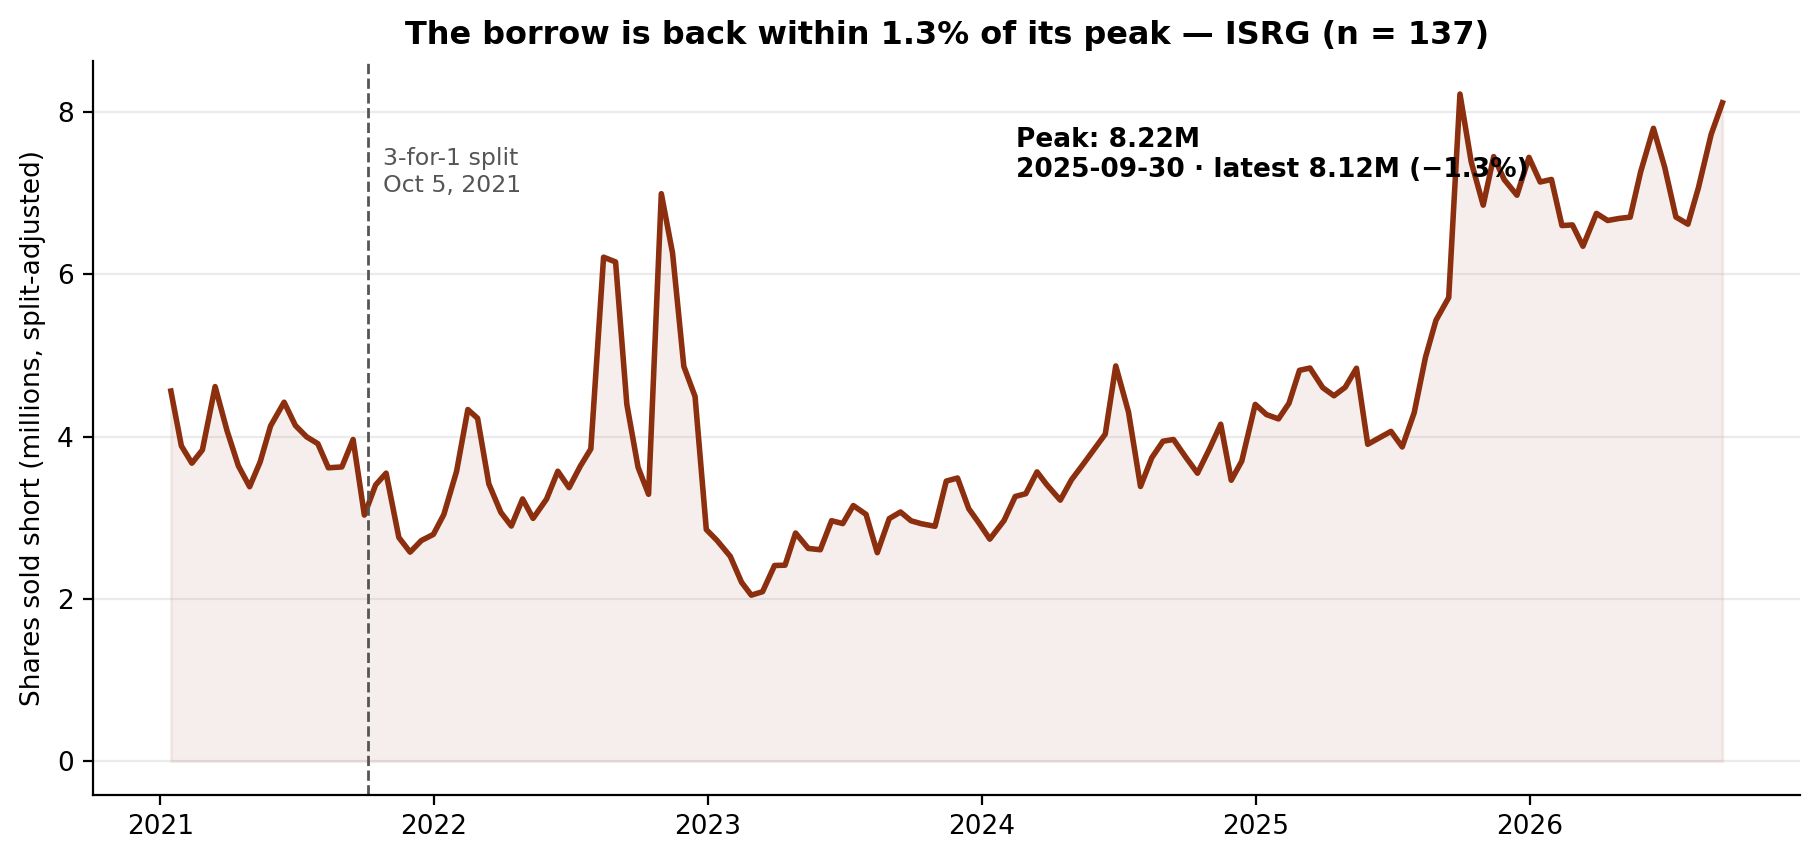
Lens 6 — short interest: 1.3% below its peak, and up 42.0% in a year. The latest FINRA settlement, September 15, 2026, records 8,117,017 shares sold short at 3.35 days to cover — 2.30% of the share count in our fundamentals file (dated July 16, 2026) — up 5.03% from the prior settlement and 10.9% above the June 30, 2026 settlement (7,322,479 shares). The series peak, on both the reported and the split-adjusted basis (methodology), is 8,224,603 shares at September 30, 2025, so the latest reading sits 1.3% below the highest borrow on record while standing 42.0% above the year-ago settlement of 5,715,392 shares. The recent path runs 7,322,479 (June 30), 6,708,471 (July 15), 6,620,078 (July 31), 7,069,998 (August 14), 7,727,998 (August 31) and 8,117,017 (September 15) — three consecutive increases into the latest settlement.
The Gap
The narrative arriving this week is an earnings-and-rank one: a fourth consecutive earnings beat, revenue up 21.7%, a #2 (Buy) rank at the outlet telling the story, on a stock down 30.8% this year in our price file. The June tape — the most recent complete holdings picture, predating the print — describes the tracked money leaving before the beat: the 13 verified continuing holders cut 29.7% in the second quarter, ten of fifteen June holders reduced, the largest single position fell 5.2%, and one holder all but exited, going from 1,160,360 shares to 7,450. Against that stand two genuine offsets in the same register: two new holders opened a combined 1,354,628 shares, and the one September early filer's position has risen every quarter this year. The full market adds a third offset — institutions as a whole hold 17.31% more shares than in March, through 22 fewer filers — so the tracked cohort's cut is a cohort fact, not a market fact: at 2.17% of reported institutional shares, the 147 are a sample, not the register. The insider lens is the cleanest line in the piece: not one purchase row exists in the entire parsed record, against $93,421,053.10 of sale-coded rows in the last year alone. The 5% register holds no activist and nothing above 7.49%, and the borrow has climbed back to within 1.3% of its peak. One plausible reading is that the filings describe a stock whose story is currently carried by its earnings print, while the named holders were, on the last complete snapshot, reducing into the decline.
What Would Change the Picture
Nothing above is a recommendation. These filings would change it:
- 1. The 2026Q3 13F season (filing window closing mid-November 2026). The tracked baseline is 15 June holders with 6,576,838 shares and a verified continuing cut of 29.7%. Whether the cutters — above all Winslow Capital Management, at 7,450 shares after a 99.4% cut — complete their exits or rebuild, whether the two new holders (GQG Partners, 780,428 shares; D1 Capital Partners, 574,200 shares) add, and whether Sarasin & Partners' September increase (290,696 shares) continues, would each change this lens.
- 2. A first insider purchase, ever, in the parsed record. The record holds 0 purchases against 157 sale-coded rows across 162 filings. Any purchase in the next window would be the first on record; continued sales alone would extend a one-sided record.
- 3. A first congressional transaction. The combined, House and Senate aggregates record no transaction at all. Any recorded purchase or sale in either chamber would change this lens from blank to a first line.
- 4. A first SC 13D, or a passive print above 7.49%. The register's 2 filings are both SC 13G family, and its largest print is Vanguard Capital Management at 7.49% as of March 31, 2026. A first activist filing, or any new 13G print above 7.49%, would change this lens.
- 5. Short interest above 8,224,603 shares, or below the June 30 settlement. A reading above the September 30, 2025 peak would set a new series record; a reading below 7,322,479 shares (June 30, 2026) would unwind the three consecutive increases recorded since July 31, 2026.
Related reading: One of 147: Powell's Only Superinvestor Is Labelled an Increase — Split-Adjusted, It Cut 44.4%. Its Insiders Have Never Bought a Share.; One of 147: The Only Superinvestor in Amkor Holds Just 8,860 Shares. Its Insiders Have Not Bought in a Year.. Intuitive Surgical's own page: Intuitive Surgical (ISRG) on GetCoattail.
Methodology and data notes
- As-of & limits: The lenses rest on different clocks, none live: 13F is a June 30, 2026 snapshot published up to 45 days later; Form 4 runs through October 2, 2026; Congress aggregates run through October 3, 2026 (Senate through October 1, 2026); 13D/G through April 30, 2026; short interest through September 15, 2026; the price file ends October 2, 2026. Seven limits are specific to this audit. First, the roster expanded before the recent audits — from 85 managers (83 filing) to 149 (147 filing) — so "of 147" counts are not comparable to earlier pieces' "of 83" figures. Second, this name carries a single CUSIP (46120E602), and the full-market by-CUSIP row matches the by-ticker aggregate on every field — holders, long holders, shares, reported value, prior holders and prior reported value — so no CUSIP blending question arises. Third, the tracked register reconciles exactly: the March 31 pipeline register holds 7,780,351 shares for this CUSIP, equal to the 13 verified continuing holders' 7,429,947 plus the three exits' 243,280 plus the September early filer Sarasin & Partners' own March row of 107,124; the June 30 register holds 6,821,264, equal to the June cohort's 6,576,838 plus Sarasin's June row of 244,426. Sarasin is classified by its latest (September 30) period, so its June row appears in the pipeline register but not in the June cohort count; its September label of +18.9% was verified against that June row, and its September implied price of $406.63 matches the September 30 close exactly. The verified continuing change of −29.7% covers only the 13 holders present in both quarters with a verifiable March row; it excludes the two new holders (1,354,628 shares combined) and the exits, which is why it differs from the register-to-register change of −12.3%, which blends new money in. Each continuing holder's movement was verified row by row by two pairing methods (accession-prefix matching and accession identity plus CUSIP-overlap), which agree on all 13. Fourth, the insider windows after the 3-for-1 split of October 5, 2021 (the 90-day and one-year windows) cite share totals as recorded; the full-record window can mix pre-split transactions (reported at pre-split share counts) with post-split ones, so for that window this audit cites transaction counts and dollar totals only — dollar totals are unaffected by the share basis. The implied sale prices for the two recent windows ($395.21 for 90 days, against a $332.02–$432.83 close range; $531.05 for one year, against $332.02–$592.85) sit inside their ranges. The site's 90-day insider aggregate (dated October 21, 2026) records 0 purchases, 20 sales worth $4,980,790.82 and 5 sellers, identical to the full parse's 90 days to October 2, 2026. Fifth, the 5% register's cross-date share total of 26,601,419 is an arithmetic sum of reporter rows across different as-of dates, not a current combined stake: in this register it is effectively a single row, since the only other row reports 0 shares. Parsed totals match the aggregates exactly. Sixth, the short-interest series is shown on a split-adjusted basis because the reported series contains two steps of 2x or more — 3.367x at the October 15, 2021 settlement, which carries FINRA's split flag and coincides with the 3-for-1 split of October 5, 2021 recorded in our price file, and 2.126x at the October 31, 2022 settlement, which carries no split or revision flag and remains the largest step on the adjusted basis; no step falls to one-half or less on either basis (adjusted minimum step 0.635x, December 30, 2022), and two early rows carry a FINRA revision flag (April 15, 2021 and June 15, 2021). On the adjusted basis the series minimum is 2,046,869 shares (February 28, 2023); the reported minimum of 1,011,382 shares (September 30, 2021) is a pre-split count and is not cited. The issuer-name field reads "Intuitive Surgical, Inc. Commo" — the field as FINRA publishes it — at all 137 settlements, on a single market class (NNM) throughout. Against the share count in our fundamentals file — 353,278,038 shares outstanding dated July 16, 2026 — the latest borrow is 2.30%. Seventh, the Congress lens is stated as recorded: none of the combined, House or Senate aggregates carries a row for this name. The June tracked register implies the June 30 close of $397.68 exactly, and the full-market aggregate implies $388.04. The company's fundamentals as collected print fiscal 2025 revenue of $10,064,700,000, net income of $2,856,000,000 and assets of $20,458,700,000 (fiscal year ended December 31, 2025), with 353,278,038 shares outstanding as of July 16, 2026; those figures are reported as collected and are not used in any lens above. Every price statement here is mechanical, a date and a split-adjusted close from our price file. The Zacks reports (published October 20, 2026) postdate the 13F snapshot and the short-interest series; their earnings figures, surprise percentages, year-to-date comparison and rank are reported as outlet content in The Hype, and no other figure from them is cited.
- Market context sources: Zacks, "Intuitive Surgical, Inc. (ISRG) Q3 Earnings and Revenues Top Estimates", published October 20, 2026 (earnings of $3.00 per share against a $2.61 consensus estimate, a surprise of +14.94%; revenues of $3.05 billion, 5.84% above consensus, against $2.51 billion a year earlier; earnings per share of $2.40 a year earlier; four consecutive earnings beats; shares down about 23.5% since the beginning of the year against the S&P 500's gain of 12.4%; Zacks Rank #2 (Buy); next-quarter consensus $2.84 per share on $3.21 billion; full-year consensus $10.74 on $11.74 billion), and Zacks, "Intuitive Surgical (ISRG) Q3 Earnings: Taking a Look at Key Metrics Versus Estimates", published October 20, 2026 (revenue up 21.7% year over year; 546 system units placed against a four-analyst average estimate of 475; installed base of 12,094; systems revenue of $769.1 million, up 30.3%). Google Trends U.S. coverage (TS2 mirror of Google Trends, checked October 21, 2026) lists "isrg stock" among U.S. trends, tied to the third-quarter report. Figures we could not confirm were left out; the external items above are reported speech from those outlets, not GetCoattail measurements.
- Intuitive Surgical is in the GetCoattail stock-page universe: Intuitive Surgical (ISRG) stock page. Series data: isrg_lens_data.csv · isrg_short_interest_series.csv · isrg_short_interest_series_adj.csv. Earlier audits: Powell Industries · Amkor.
Past patterns are not a promise of future results. For education only — not investment advice.
This article describes public filings as of the dates stated. It is not investment advice and makes no recommendation. Filings lag reality: 13F positions are as of June 30, 2026, and later trading is not yet public.
Revision history: v1.0 — October 21, 2026: first publication.