GetCoattail Research — The Filing Tape #145. Powell Industries has been one of the most watched stocks on Zacks.com lately, and the filings behind that attention contain a labelling trap: the one tracked superinvestor position is marked an increase of 66.9%, but a 3-for-1 split sits between the two quarters — on a split-adjusted basis the position fell 44.4%. Around that single holder sit a full market that added filers, insiders who have never recorded a purchase, and a short-interest series the same split makes unreadable until restated.
The Hype
Powell's attention is search-driven. Zacks reported on October 20, 2026 that the stock "is one of the stocks most watched by Zacks.com visitors lately," with shares returning −11.6% over the past month against +0.7% for the Zacks S&P 500 composite, while the Zacks Manufacturing - Electronics industry lost 2.9%, and the current-quarter consensus estimate stands at $1.52 per share, up 7.8% from a year earlier, with the consensus itself revised up 9.7% over the last 30 days; the fiscal-year consensus is $5.36 and the outlet's rank is #4 (Sell). Zacks Our price file adds the longer path, on split-adjusted closes: Powell rose 58.8% in the second quarter, from $180.36 on March 31 to $286.36 on June 30, then fell back to $196.10 by October 2 — down 31.5% from the quarter-end close, up 84.5% year to date and 39.1% below its 252-session high close of $322.05, set on May 11, 2026. A switchgear maker that split its stock in April: the filings answer who holds it, and what the labels actually mean.
The Tape
For Powell — the one hundred and forty-fifth Filing Tape audit — the tape shows a tracked register with a single holder whose increase label reverses under split adjustment, a full market that added 114 filers, an insider record with no purchase in any window, no congressional row, a 5% register made entirely of passive 13G filings, and a borrow down by more than half once the split is removed.
| Lens | As of | What the filings show | Direction vs prior period |
|---|---|---|---|
| Superinvestors (13F) | Jun 30, 2026 | 1 holder of 147 tracked managers holds 29,181 shares; the position is labelled INCREASED, +66.9% as filed | Split-adjusted vs Q1: −44.4% (Q1 restated to 52,455 shares) |
| All institutions (13F) | Jun 30, 2026 | 585 filers; 27,390,604 shares; reported value $8,271,910,719 | Filers +114; shares +5.67% split-adjusted; reported value +68.04% |
| Insiders (Form 4) | Oct 2, 2026 | Last 90 days: 0 purchases and 6 sale-coded rows worth $3,418,366.50; last year: 0 purchases and 72 sale-coded rows worth $69,338,235.45 | No purchase in any window — the full record is also zero |
| Congress | Oct 3, 2026 | No row in the combined, House or Senate aggregates | None recorded |
| 13D/G | Jul 30, 2026 | 6 parsed filings (0 SC 13D family, 6 SC 13G family); register maximum 13.5% | Latest filings, Jul 29–30, 2026, print BlackRock at 9.7% as of Jun 30, 2026 |
| Short interest (FINRA) | Sep 15, 2026 | 2,397,919 shares; 4.10 days to cover; 6.58% of the share count | Up 5.89% from the prior settlement; down 57.6% split-adjusted from a year ago |
Lens 1 — the superinvestors: one holder, and its increase is a split artefact. We track 149 managers whose 13F portfolios we collect from SEC EDGAR — 147 are in the collection (144 at a June 30 period-end, 3 early filers at September 30, none of them holding this name) — and the June 30, 2026 register is 1 distinct manager holding 29,181 shares worth $8,356,271, long only, with no option rows: the single row is labelled INCREASED at +66.9%; no new holders, no exits. Polen Capital Management is the register's only holder: 29,181 shares worth $8,356,271 — 100.0% of the tracked stake — at a 0.07% portfolio weight (filed August 4, 2026). The label is accurate only against the as-filed March register: Polen's March 31 position was 17,485 shares, verified row by row by two pairing methods (methodology), and 29,181 against 17,485 is indeed +66.9%. But Powell split 3-for-1 on April 6, 2026, between the two snapshots. Restated, the March position is 52,455 shares, and the June position is 44.4% smaller — the register reconciles exactly on both bases (methodology). The June row implies $286.36, the June 30 close exactly. 13F figures are as of June 30, 2026, published up to 45 days later.
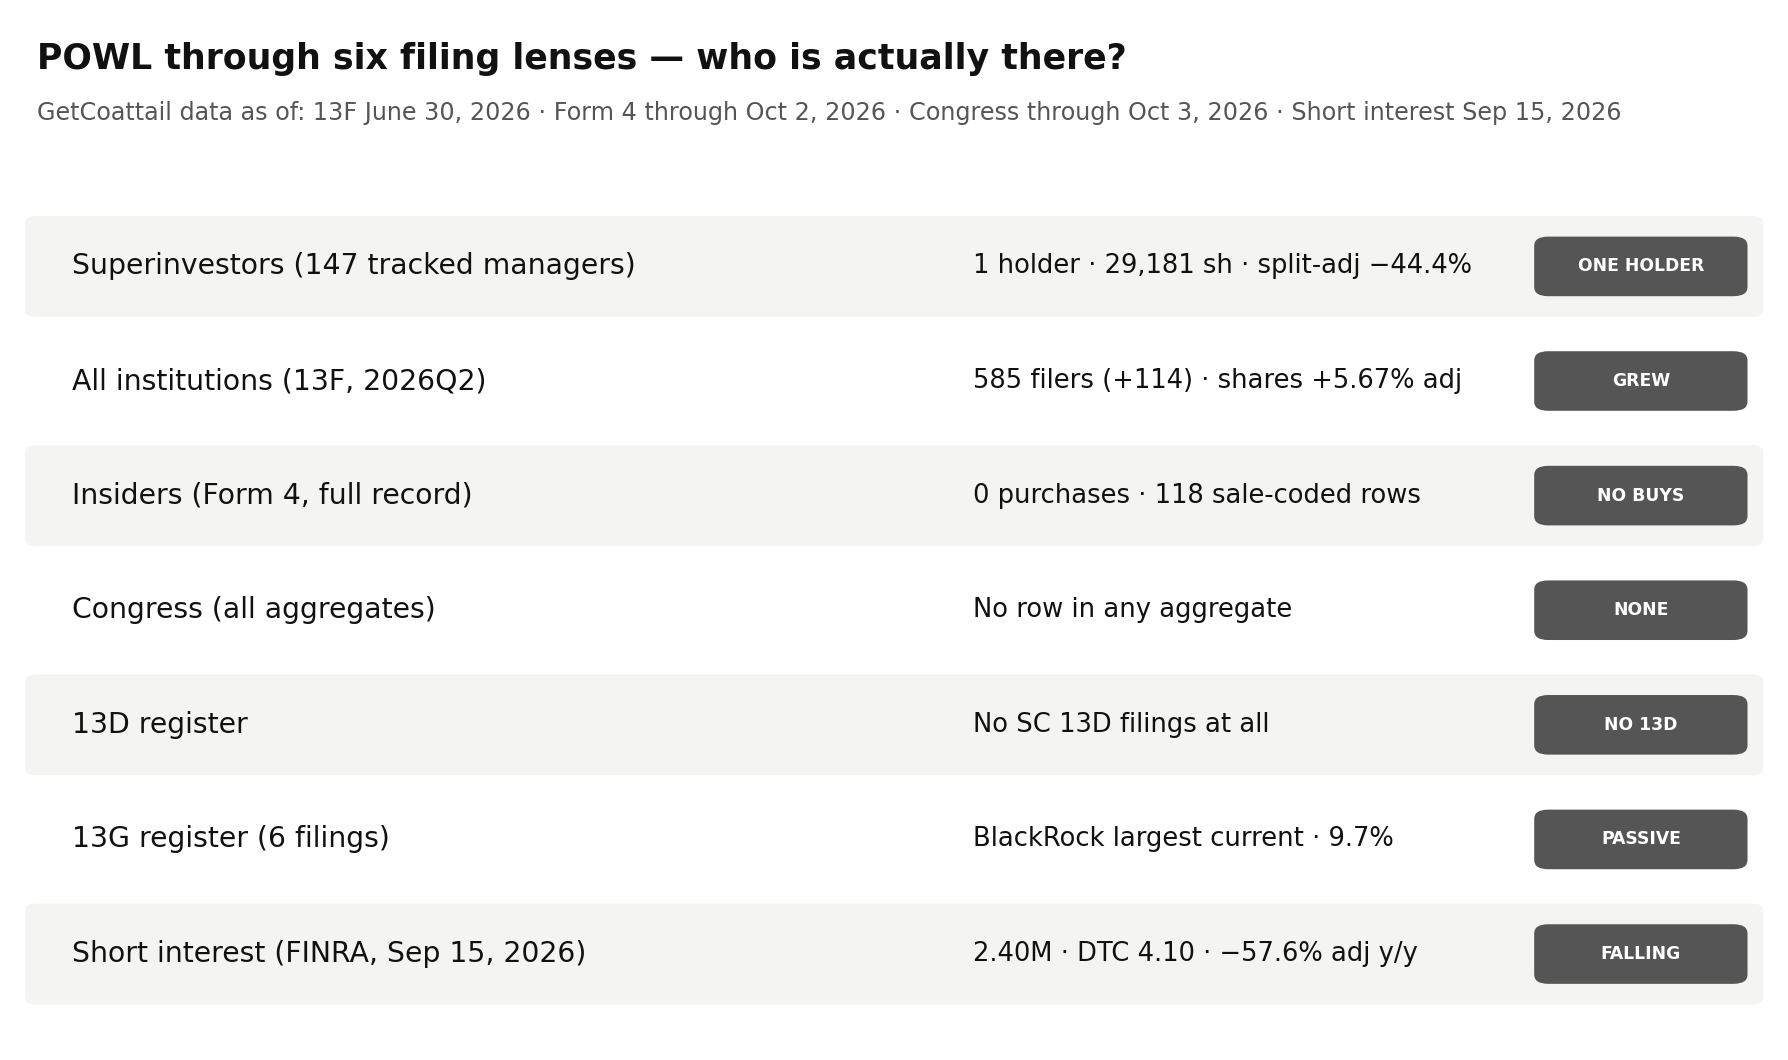
Lens 2 — institutions: 114 more filers, and the same split in the share count. At June 30, 2026, 585 institutions reported positions on the name's single CUSIP, up 114 from 471 at March 31 (+24.20%); 580 are long. Reported shares print +217.0% to 27,390,604, but the March count is a pre-split count: split-adjusted, shares rose 5.67% (+1,468,849 shares), and reported value rose 68.04% to $8,271,910,719, labelled "reported" because the aggregate includes option rows (methodology), in a quarter when the price rose 58.8% — the value jump is the adjusted share increase compounded by the price move. Flow counts agree (548 entered, 434 exited, net +114). The single-CUSIP aggregate matches the by-ticker total on every field (methodology), and implies $302.00 against the $286.36 close.
Lens 3 — insiders: no purchase, in any window, in the whole record. The parsed Form 4 record holds 85 filings through October 2, 2026, and across the full record there is no open-market purchase at all — zero purchase rows against 118 sale-coded rows worth $77,033,032.81, by 12 sellers, 100 of them officer rows. The last year holds no purchase, against 72 sale-coded rows worth $69,338,235.45, by 10 sellers, and the last 90 days hold no purchase, against 6 sale-coded rows worth $3,418,366.50, by 3 sellers. One of those six rows is a boundary case the aggregate cannot price: a July 1 row for the chief executive carrying 36,000 shares at a nominal $0.01, flagged as an acquisition in the source record despite its sale code — it contributes $360 of the 90-day value and most of the recorded share count, so no 90-day share total or average price is cited from the raw aggregate. The other five rows are ordinary market sales: 16,290 shares for $3,418,006.50, implying $209.82, inside the window's close range (methodology). The site's insider aggregate records the same zero purchases over its own 90-day window, with a different sales count that its later window end and different aggregation explain (methodology).
Lens 4 — Congress: no row in any aggregate. The combined aggregate (as of October 3, 2026), the House aggregate (as of October 3, 2026) and the Senate aggregate (as of October 1, 2026) each carry no row for this name — no purchase and no sale is recorded in any of the three.
Lens 5 — the 5% register: six passive filings, and a maximum that has already been amended away. Our full parse holds 6 SC 13D/G filings matching the site aggregate exactly — 0 SC 13D family and 6 SC 13G family, 4 of them amendments; 6 reporter names across 10 rows. The maximum is Kovitz Investment Group Partners, LLC at 1,627,879 shares and 13.5% as of April 30, 2025 (filed May 7, 2025, SC 13G, on the pre-split share count) — but the same reporter amended that line down to 2,420 shares and 0.0% as of October 31, 2025, so the largest historical print is not a current holder. The latest filings are both dated to June 30, 2026: BlackRock, Inc. at 3,517,738 shares and 9.7% (filed July 29, 2026) and three related First Trust entities each reporting the same 1,658,087 shares at 4.55% (filed July 30, 2026). The Vanguard Group prints 0 shares and 0.0% as of March 13, 2026, and there is no activist 13D anywhere in the register.
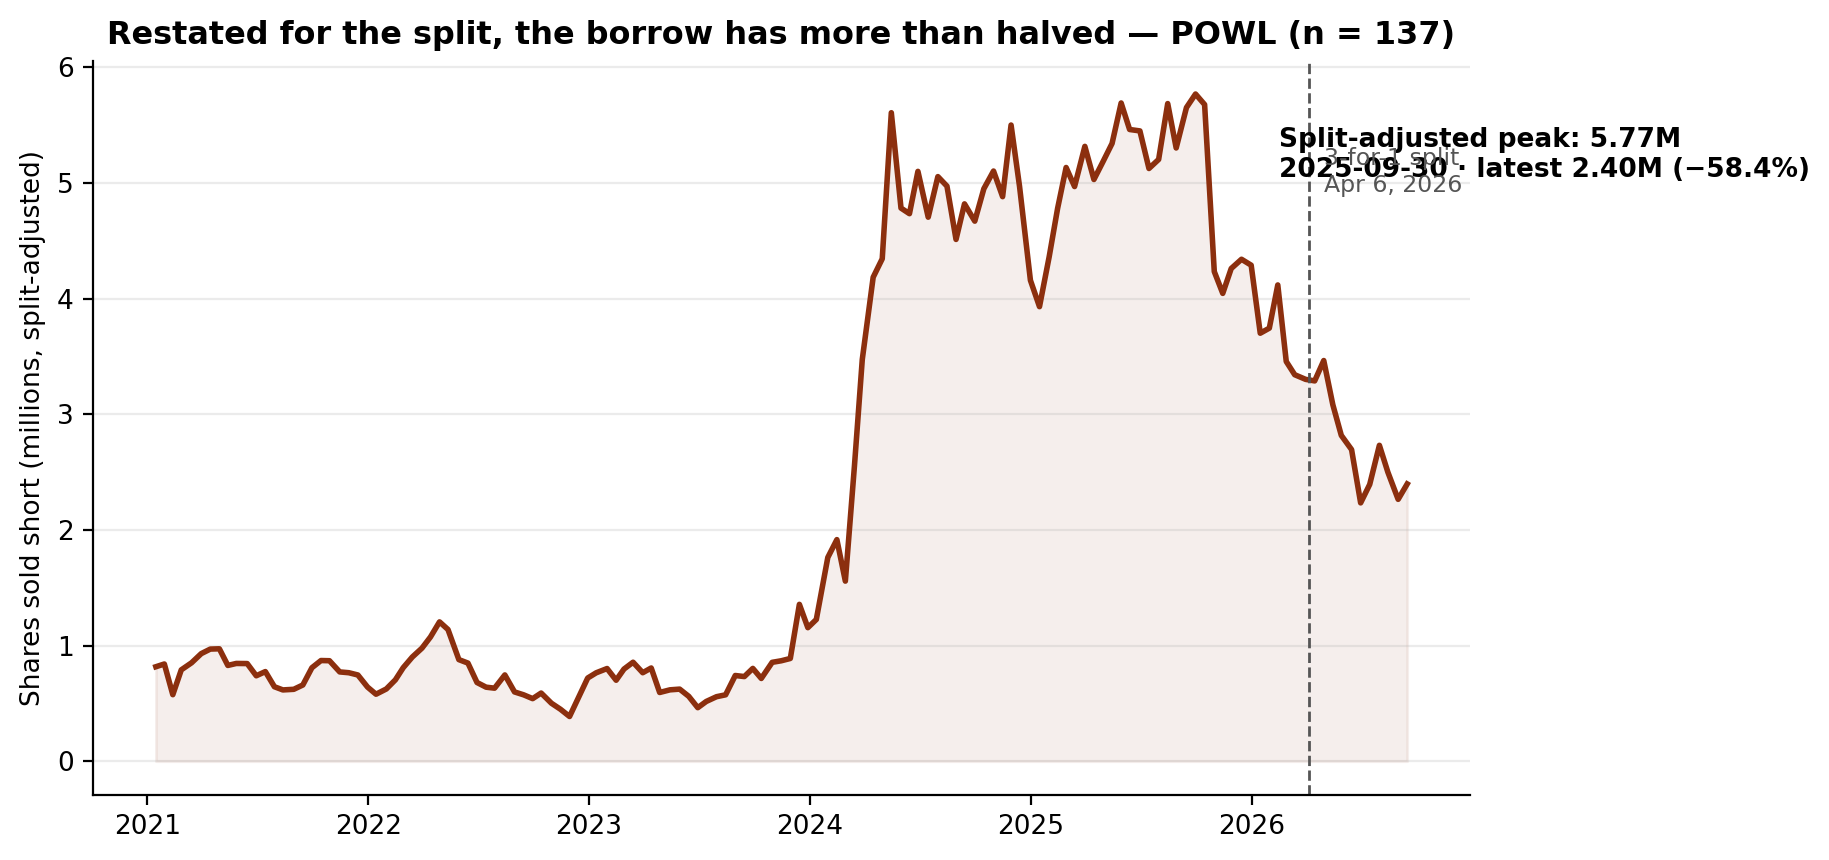
Lens 6 — short interest: down by more than half, once the split is removed. The latest FINRA settlement, September 15, 2026, records 2,397,919 shares sold short at 4.10 days to cover — 6.58% of the share count in our fundamentals file (dated August 3, 2026) — up 5.89% from the prior settlement and 7.3% above the June 30, 2026 settlement (2,234,026 shares). The reported series appears to peak at 3,464,966 shares on April 30, 2026, but that is a post-split count set against pre-split history: restating settlements before the April 6, 2026 split onto the current share basis, the series maximum is 5,769,951 shares at September 30, 2025, and the latest reading is 58.4% below it and 57.6% below the year-ago settlement. The only step of 2x or more in the reported series is the split settlement itself; on the adjusted basis no step reaches 2x or falls to one-half (methodology). The recent post-split path runs 2,234,026 (June 30), 2,393,751 (July 15), 2,731,871 (July 31), 2,499,783 (August 14), 2,264,626 (August 31) and 2,397,919 (September 15).
The Gap
The narrative arriving this week is a search-and-estimates one: a most-watched switchgear name whose current-quarter consensus has been revised up 9.7% in a month, on a stock up 58.8% in the second quarter and down 31.5% since — whose own rank at the outlet telling that story is #4 (Sell). The June tape describes sponsorship that is broad in the full market and minimal in the tracked cohort, with the cohort's one label pointing the wrong way: institutions added 114 filers and 5.67% more shares split-adjusted, but the 147 tracked managers hold exactly one position — 29,181 shares, a 0.07% portfolio weight, 0.11% of the shares institutions report — and that position shrank 44.4% across the split while its label says it grew 66.9%. The insider lens is the cleanest line in the piece: not one purchase row exists in the entire parsed record, against $69,338,235.45 of sale-coded rows in the last year alone. The 5% register holds no activist and no current double-digit holder — its 13.5% maximum was amended to 0.0% within six months — and the borrow, properly restated, has fallen 57.6% in a year rather than risen. One plausible reading is that the filings describe a stock whose story is carried by estimates and a widening institutional tail, while every lens that records a named holder shows a smaller position than the raw prints suggest.
What Would Change the Picture
Nothing above is a recommendation. These filings would change it:
- 1. The 2026Q3 13F season (filing window closing mid-November 2026). The tracked baseline is 1 June holder with 29,181 shares, labelled INCREASED as filed and down 44.4% split-adjusted. Whether Polen Capital Management holds, adds to or exits that position — read on a split-adjusted basis — and whether any second tracked manager appears, would each change this lens.
- 2. A first insider purchase, ever, in the parsed record. The record holds 0 purchases against 118 sale-coded rows across 85 filings. Any purchase in the next window would be the first on record; continued sales alone would extend a one-sided record.
- 3. A first congressional transaction. The combined, House and Senate aggregates record no transaction at all. Any recorded purchase or sale in either chamber would change this lens from blank to a first line.
- 4. A first SC 13D, or a passive print above 9.7%. The register's 6 filings are all SC 13G family, its historical maximum of 13.5% was amended to 0.0%, and its largest current print is BlackRock, Inc. at 9.7% as of June 30, 2026. A first activist filing, or any new 13G print above 9.7%, would change this lens.
- 5. Short interest above the post-split maximum, or a new split-adjusted low. A reading above 3,464,966 shares (April 30, 2026) would set a post-split record; a reading below 2,234,026 shares (June 30, 2026) would set a new post-split low.
Related reading: One of 147: The Only Superinvestor in Amkor Holds Just 8,860 Shares. Its Insiders Have Not Bought in a Year.; Five of 147: Two New Positions Are 90.5% of the Superinvestors' Aptiv Stake. Its Insiders Bought $8.25 Million in 90 Days.. Powell Industries' own page: Powell Industries (POWL) on GetCoattail.
Methodology and data notes
- As-of & limits: The lenses rest on different clocks, none live: 13F is a June 30, 2026 snapshot published up to 45 days later; Form 4 runs through October 2, 2026; Congress aggregates run through October 3, 2026 (Senate through October 1, 2026); 13D/G through July 30, 2026; short interest through September 15, 2026; the price file ends October 2, 2026. Seven limits are specific to this audit. First, the roster expanded before the recent audits — from 85 managers (83 filing) to 149 (147 filing) — so "of 147" counts are not comparable to earlier pieces' "of 83" figures. Second, this name carries a single CUSIP (739128106), and the full-market by-CUSIP row matches the by-ticker aggregate on every field — holders, long holders, shares, reported value, prior holders and prior reported value — so no CUSIP blending question arises. Third, the tracked register reconciles exactly on both share bases: the March 31 pipeline register holds this single holder's 17,485 shares as filed (pre-split) and the June 30 register holds 29,181, with no exit recorded and no leftover Q2 pipeline row; the only holder's quarter-to-quarter movement was verified row by row by two pairing methods (accession-prefix matching and accession identity plus CUSIP-overlap), which agree, and its March implied price of $541.08 matches the pre-split March 31 close of $541.08 exactly (the split-adjusted close of $180.36 times three). The +66.9% label is the filer's own change figure computed on as-filed share counts; the split-adjusted −44.4% is our restatement, and both are printed wherever the label is cited. No September 30, 2026 early filer holds this name. Fourth, the insider aggregate's 90-day window contains one boundary row: a July 1, 2026 row for the chief executive (filed July 6, 2026) coded S with 36,000 shares at a $0.01 price and an acquired flag in the source record. It contributes $360 to the window's $3,418,366.50 of sale-coded value, and it is why no 90-day share total or raw average price is cited: excluding it, the remaining five rows total 16,290 shares and $3,418,006.50, implying $209.82 against a $170.51–$248.05 close range for the window. The one-year and full-record windows mix pre-split transactions (reported at pre-split prices, such as sales at $502.23–$602.58 in February–March 2026) with post-split ones, so for those windows this audit cites transaction counts and dollar totals only — dollar totals are unaffected by the share basis — and no share totals or average prices. The site's 90-day insider aggregate (dated October 21, 2026) records 0 purchases, 2 sales worth $1,388,407.50 and 2 sellers, against the full parse's 90 days to October 2, 2026 of 0 purchases, 6 sale-coded rows worth $3,418,366.50 and 3 sellers: the two windows end on different dates and aggregate differently, so the counts are reported side by side as recorded, and neither is treated as an error in the other. Fifth, the 5% register's cross-date share total of 12,269,113 is an arithmetic sum of reporter rows across different as-of dates, not a current combined stake: it counts the same 1,658,087 First Trust shares once for each of three related reporting entities, alongside Kovitz Investment Group Partners, LLC's superseded 13.5% line. Parsed totals match the aggregates exactly. Sixth, the short-interest series is shown on a split-adjusted basis because the reported series contains exactly one step of 2x or more — 2.988x at the April 15, 2026 settlement, which carries FINRA's split flag — and no step to one-half or less; on the adjusted basis the largest step is 1.638x (March 15, 2024) and the smallest 0.684x (February 12, 2021), two rows carry a FINRA revision flag (June 15, 2021 and February 28, 2023), and our price file records the 3-for-1 split at April 6, 2026, so settlements across the split are compared only after restatement. The issuer-name field reads "Powell Industries, Inc. Common" at all 137 settlements, on a single market class (NNM) throughout. Against the share count in our fundamentals file — 36,432,564 shares outstanding dated August 3, 2026 — the latest borrow is 6.58%. Seventh, the Congress lens is stated as recorded: none of the combined, House or Senate aggregates carries a row for this name. The June tracked row implies the June 30 close of $286.36 exactly, and the full-market aggregate implies $302.00. The company's fundamentals as collected print fiscal 2025 revenue of $1,104,318,000, net income of $180,747,000 and assets of $1,108,984,000 (fiscal year ended September 30, 2025), with 36,432,564 shares outstanding as of August 3, 2026; those figures are reported as collected and are not used in any lens above. Every price statement here is mechanical, a date and a split-adjusted close from our price file. The Zacks report (published October 20, 2026) postdates the 13F snapshot and the short-interest series; its most-watched status, one-month return, industry return, consensus estimates and rank are reported as outlet content in The Hype, and no other figure from it is cited.
- Market context sources: Zacks, "Powell Industries, Inc. (POWL) Is a Trending Stock: Facts to Know Before Betting on It", published October 20, 2026 (Powell among the stocks most watched by Zacks.com visitors; shares −11.6% over the past month against +0.7% for the Zacks S&P 500 composite; Zacks Manufacturing - Electronics industry −2.9% over the period; current-quarter consensus EPS estimate $1.52, +7.8% year over year, with the consensus revised +9.7% over the last 30 days; fiscal-year consensus $5.36; Zacks Rank #4 (Sell)). Figures we could not confirm were left out; the external items above are reported speech from that outlet, not GetCoattail measurements.
- Powell Industries is in the GetCoattail stock-page universe: Powell Industries (POWL) stock page. Series data: powl_lens_data.csv · powl_short_interest_series.csv · powl_short_interest_series_adj.csv. Earlier audits: Amkor · Aptiv.
Past patterns are not a promise of future results. For education only — not investment advice.
This article describes public filings as of the dates stated. It is not investment advice and makes no recommendation. Filings lag reality: 13F positions are as of June 30, 2026, and later trading is not yet public.
Revision history: v1.1 — October 21, 2026: corrections to the new-low trigger, the limits count and a price range in Methodology. v1.0 — October 21, 2026: first publication.