A company that suddenly doubles its lobbying budget looks like a company that knows something. Lobbying ramps when the stakes rise — a merger review, a rule being written, a contract being competed — and the spending is disclosed, in full, every quarter. If the surge is the smoke, something material should be the fire: a stock that moves, a material agreement on an 8-K, a fatter federal contract the next year.
We have tested the neighboring claims before. Members of Congress buy stocks that lobby their committees about as often as chance predicts. Increases in lobbying spend show no rank correlation with next year's federal contracts (Spearman ρ = −0.003, 95% CI [−0.036, +0.030]). And in the 90 days before large contract awards, insiders and members barely bought at all. What none of those tests asked is the event question: after a surge itself — dated from the moment an outsider could actually know about it — does anything measurable follow?
Dating the signal honestly
A lobbying surge is easy to see in hindsight and impossible to see in real time. A quarter's spending only becomes public when the LD-2 reports arrive, and the local filing data does not carry each report's receipt stamp. So we dated every signal by the statutory deadline: quarterly reports are due 20 days after the quarter ends (2 U.S.C. § 1604) — April 20, July 20, October 20, and January 20 for the fourth quarter. A surge in second-quarter spending is treated as knowable on July 20, and positions are entered at the next trading day's close, never earlier. Whatever follows is therefore genuinely "after the news," not after the fact.
The universe is every firm-quarter in which a company had an established lobbying program — at least $20,000 of attributed spend in the same quarter a year earlier — across 840 companies from 2020 through mid-2026. A surge is a quarter with at least double the year-earlier spend and at least $50,000 in absolute terms. That produces 1,227 surge firm-quarters (8.0% of the 15,323 eligible firm-quarters, from 443 companies; median surge-quarter spend $230,000, a median 2.86× jump) and 14,096 non-surge firm-quarters to compare against. Another 2,502 firm-quarters were starts from zero, which have no year-over-year ratio; they are counted but excluded from the test.
The stock did not follow
| Horizon | Surge mean | Surge median | Surge win rate | Surge n | Baseline mean | Baseline median | Baseline win rate | Baseline n | Difference | 95% CI (firm-cluster bootstrap) |
|---|---|---|---|---|---|---|---|---|---|---|
| +63 trading days | −1.5% | −3.2% | 42.9% | 865 | −0.6% | −2.3% | 43.7% | 9,476 | −0.9 pp | [−2.5, +0.9] |
| +126 trading days | +0.1% | −4.9% | 42.0% | 817 | +1.3% | −2.3% | 45.4% | 9,056 | −1.2 pp | [−4.5, +2.3] |
| +252 trading days | −0.8% | −7.2% | 41.6% | 705 | +3.6% | −5.2% | 43.7% | 8,251 | −4.3 pp | [−9.4, +1.1] |
Table 1: Forward excess return vs. SPY from the first close after the filing deadline.
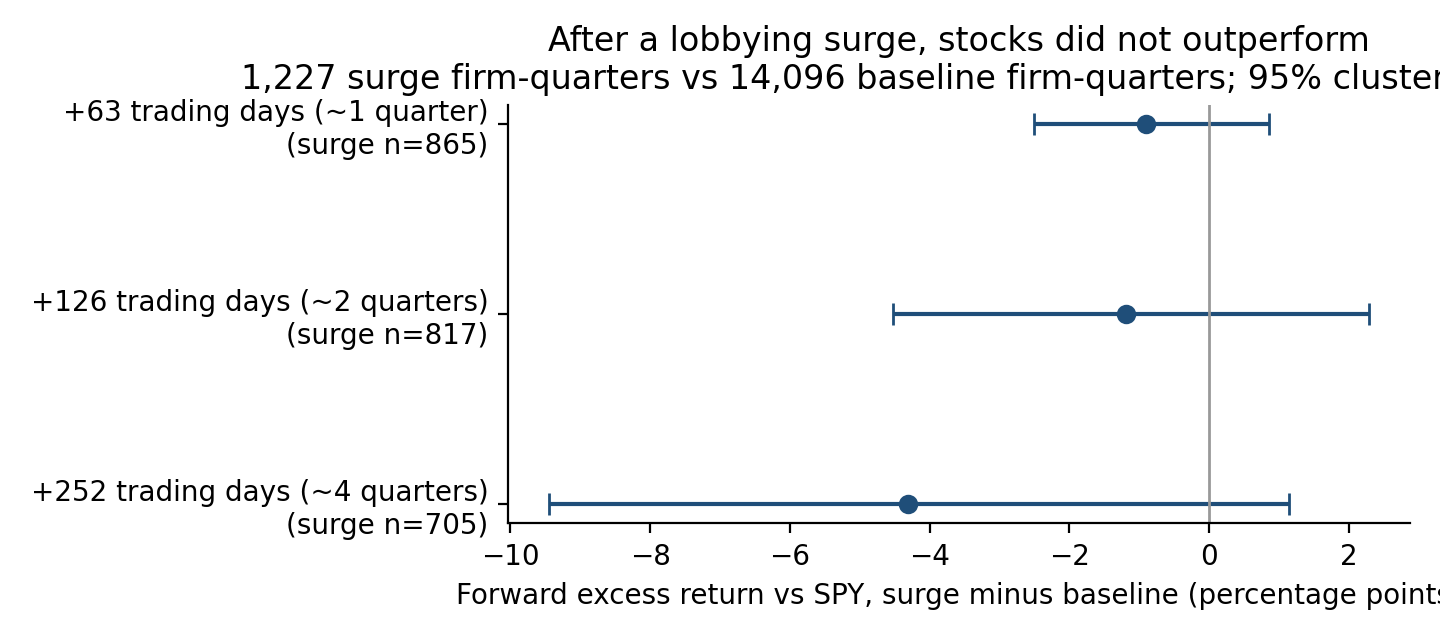
If anything, the point estimates lean the wrong way for the bull case: surge quarters trailed comparable non-surge quarters by −0.9 pp over one quarter and −4.3 pp over a full year. But every confidence interval includes zero (bootstrap p = 0.322, 0.492, and 0.113), so the honest sentence is the weaker one: no evidence that a lobbying surge precedes outperformance — and no reliable evidence of underperformance either. The correct baseline matters here. Both groups lagged SPY at the median (−3.2% and −2.3% over 63 days); established corporate lobbyists as a class trailed a mega-cap-led index over this window. A naive study that compared surge stocks only with the index would have "found" a negative effect that the matched comparison shows is not the surge's.
The year-by-year split agrees: the +63-day difference was negative in 5 of the 7 signal years (2020–2026), small in each, and the two positive years (2023, +0.1 pp; 2025, +1.0 pp) are nowhere near significance on their own.
Material filings: a small gap that clustering erases
If a surge precedes corporate events, the 8-K tape should show it. We counted firm-quarters followed within 183 and 365 days by at least one 8-K carrying a material item — 1.01 (material agreements), 2.01 (completed acquisitions), 2.03 (material obligations), or 5.02 (officer and director changes) — in our index of 8-Ks filed from January 2023 onward.
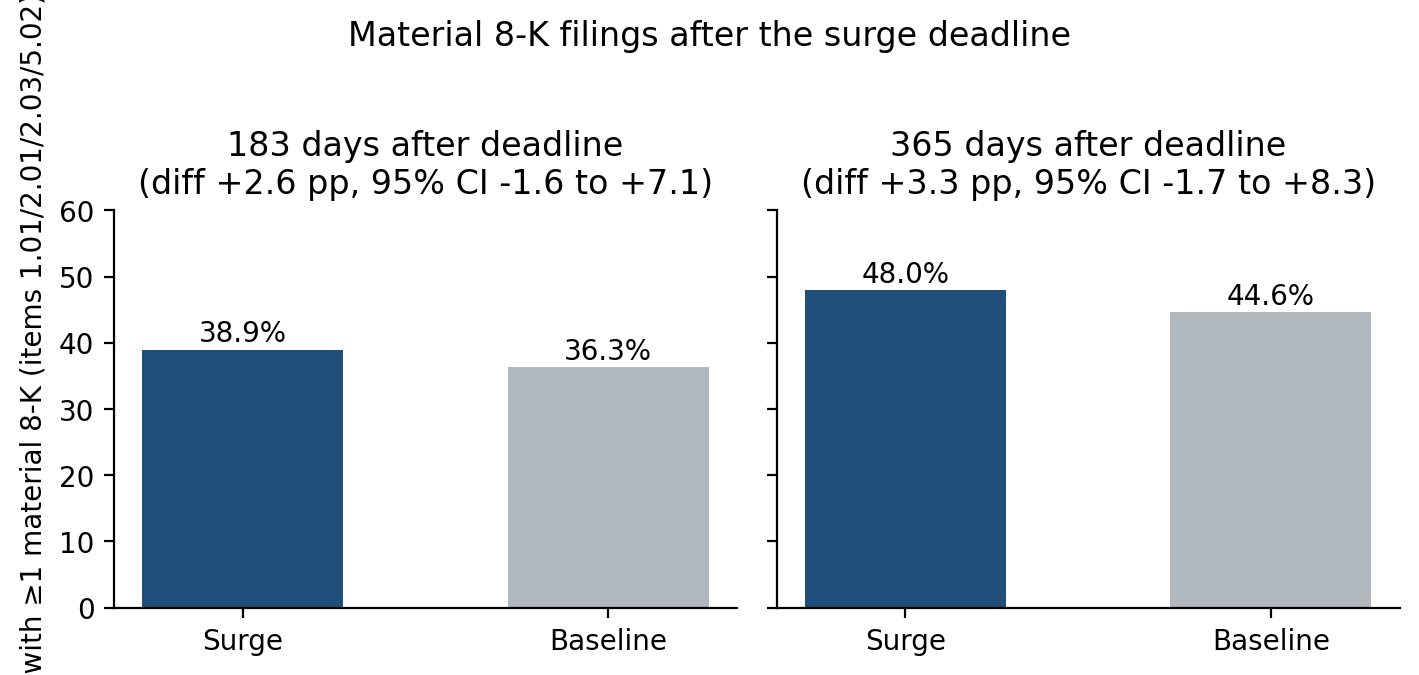
Surge quarters did show slightly more material filings: 38.9% vs. 36.3% at 183 days (difference +2.6 pp) and 48.0% vs. 44.6% at 365 days (+3.3 pp). This is the closest any measure comes to an effect, and it does not survive the appropriate uncertainty calculation. Because the same companies recur across quarters, the firm-cluster bootstrap intervals are [−1.6, +7.1] and [−1.7, +8.3] — both include zero (p = 0.218 and 0.203). A naive two-proportion interval at 365 days just grazes past zero ([+0.0, +6.7]); with seven headline comparisons in this study and heavily repeated firms, that is what noise looks like. The composition argues the same way: the largest single contributor is Item 5.02 (+2.6 pp at 183 days, +3.6 pp at 365 days) — routine officer and director changes — while Item 2.01, completed acquisitions, actually ran slightly lower after surges at 365 days (3.2% vs. 3.9%).
Contracts: the event frame agrees with the correlation
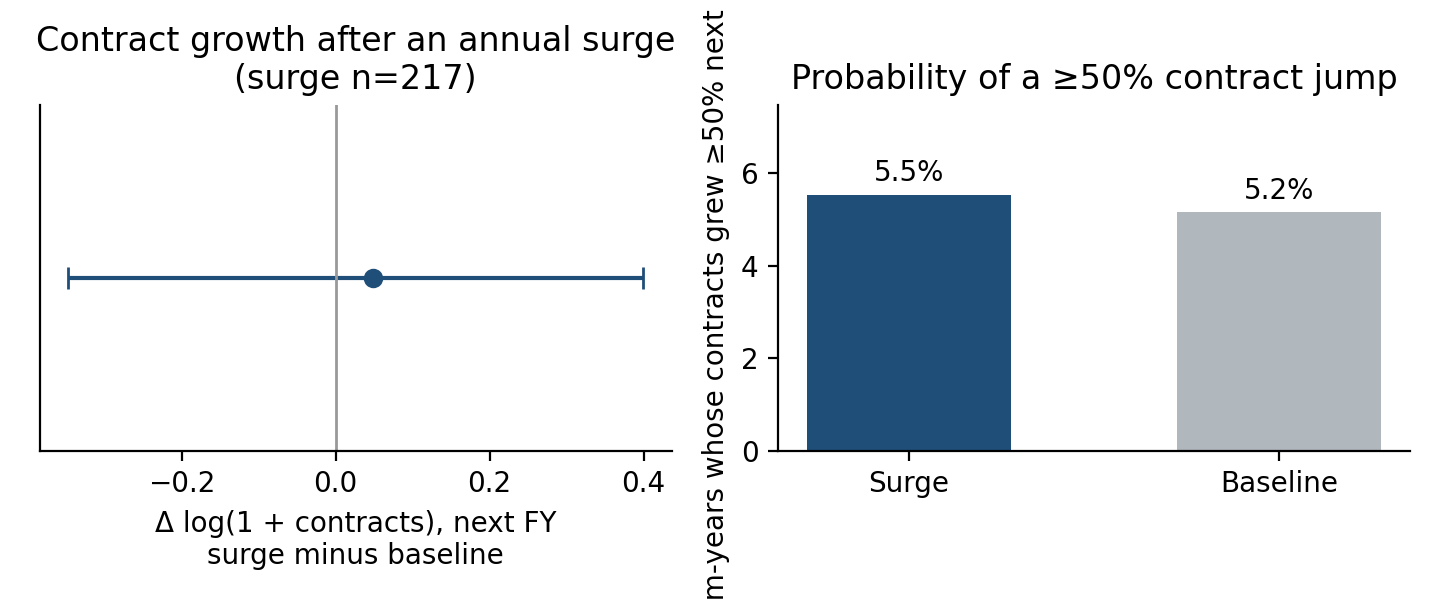
Lobbying is supposed to pay off in Washington, not on the tape, so the contract test matters most. Redoing our earlier lobbying-to-contracts analysis as an event study — 217 firm-years in which federal-fiscal-year lobbying at least doubled, to at least $100,000, against 2,871 that did not, among 3,088 firm-years with at least $50,000 of prior-year spend — changes nothing. Next-year contract obligations changed by −0.201 log points after surge years and −0.250 after baseline years, a difference of +0.049 with a 95% cluster interval of [−0.347, +0.399] (p = 0.777). The probability that contracts jumped by at least half was 5.5% after surges and 5.2% otherwise (+0.4 pp, 95% CI [−2.6, +3.8]). Two different statistical frames on the same data now agree: whatever lobbying buys, a surge in it does not precede measurably larger federal contracts.
The tails are stories, not signal
Individual surges can precede anything, because individual stocks can do anything. The best forward year in the sample belongs to Micron: a 2025 second-quarter surge to $1,640,000 (2.02× the year-earlier $810,000), knowable July 20, 2025, followed by a +728.5% excess return over 252 trading days as the memory cycle exploded. The worst belongs to Agilon Health: an 8.33× surge to $250,000 in the third quarter of 2023, followed by −125.1%. The median scored surge — General Mills, second quarter of 2022, $370,000 against $170,000 — returned −7.2% versus SPY over the next year. A distribution whose best and worst cases are a semiconductor supercycle and a healthcare collapse, and whose middle is a food company drifting down, is a distribution the surge itself is not sorting.
Robustness
Six pre-specified variations of the +63-day return test all include zero: adding a trend condition (surge must also exceed 1.5× the trailing four-quarter average; difference +0.4 pp, 95% CI [−1.7, +2.8]); taking the top decile of year-over-year ratios instead of 2× (−0.2 pp, [−1.9, +1.4]); counting amended reports twice instead of restating them (−0.4 pp, [−2.0, +1.3]); exact-name attribution only (−0.6 pp, [−2.2, +1.2]); collapsing consecutive surge quarters into single episodes (−0.1 pp, [−2.1, +2.1]); and entering at the deadline day's own close (−1.0 pp, [−2.6, +0.8]). The sign flips between specifications while the magnitude stays small — the fingerprint of a null, not of a fragile effect.
What to do with a surge
Treat a lobbying surge as context, not as a catalyst. On any company's GetCoattail page, the lobbying record shows what the company is spending to be heard in Washington; a doubling quarter tells you the company's government-affairs stakes rose — a contract competition, a rule, a review — sometime in the three weeks to nearly four months before you can even see it. What it does not tell you, on 1,227 observations, is what the stock, the 8-K tape, or next year's contract ledger will do next. If you read the filing, read the issue codes and the agencies named; that is where the information is. The dollar jump is the loudest number in the report and, measured properly, the least informative.
Methodology and data
Lobbying spend is the sum of income and expenses on LDA filings attributed to each company as client (exact-name tier 1 plus name-family tier 2 matching, with a legal-form extension for trailing HOLDING/HOLDINGS; amended reports restate rather than add to the original within each client–registrant–quarter cell). Signal dates are statutory LDA deadlines (quarter end + 20 days, 2 U.S.C. § 1604) because the collection does not carry per-filing receipt stamps; entry is the next trading day's close, with deadline-day entry as a sensitivity. Returns use split- and dividend-adjusted daily closes minus SPY over identical dates; firms recur across quarters, so intervals are firm-cluster bootstraps (2,000 resamples), with Welch and two-proportion intervals reported alongside in the data sheet. The 8-K test uses our index of filings from January 1, 2023 to October 13, 2026 and only signals whose full follow-up window is observable. Contracts are USAspending fiscal-year obligated amounts (not outlays), attributed by parent-company name. Known limits: the price window covers signals from late 2021 onward (scoring dropouts 29.5% of surge and 32.8% of baseline quarters at +63 days, mostly window edges); the ticker universe is as of collection, so delisted firms are absent; name-based attribution misses lobbying done under subsidiary names, which biases toward zero; and the deadline convention assumes reports are filed on time — late or amended filings would make some surges knowable later than we assume. This is an observational association study; nothing here is investment advice. The full scored dataset accompanies this article: scored_events_lobbying_surge.csv (15,323 eligible firm-quarters). Past patterns are not a promise of future results. For education only — not investment advice.
Revision history
- v1.0 — October 15, 2026: first publication. Lobbying data as collected by GetCoattail; 8-K index through October 13, 2026; prices through October 2, 2026.