Companies in our universe reported $6.85 billion of lobbying spending across fiscal 2021–2025. If lobbying bought federal business, the firms that raised their spending should show larger contract obligations the following year. Across 3,524 firm-years, they do not. The rank correlation between a firm's lobbying increase and its next-year contract change is −0.00, and the median lobbying dollar is followed by exactly $0 in federal contract obligations.
Why this question matters
Lobbying is the most visible legal channel of corporate influence in Washington, and it is disclosed in unusual detail. Under the Lobbying Disclosure Act, registrants file quarterly LD-2 reports naming each client and the income or expenses for that client (2 U.S.C. §1604). Federal contract awards are equally public: USAspending.gov, the official source created under the Federal Funding Accountability and Transparency Act and expanded by the DATA Act, publishes how much each agency obligated to each recipient in each fiscal year.
Put the two together and a familiar claim becomes testable: that lobbying spending converts into government contracts. It is worth testing rather than assuming, because most lobbying is not about contracts at all — it targets regulation, tax rules, and oversight. If contract-seeking were the main event, the conversion should show up in the data, firm by firm and year by year. If it does not show up, that tells us something about what the disclosed money is mostly for.
How we tested it
For each company and fiscal year, lobbying spend is the sum of income and expenses across all LDA filings where the company is the client — expenses cover in-house lobbying operations, income covers what outside firms report receiving from that client. Filings are matched to companies by a normalized-name rule (the same tiered matching we used in our earlier lobbying work), with one disclosed extension for "Holding/Holdings" name forms. Because the federal fiscal year starts on October 1 (31 U.S.C. §1102), a lobbying fiscal year is calendar Q1–Q3 plus the prior calendar Q4. Contracts are USASpending obligated amounts by fiscal year — money committed, not money spent.
The sample is 3,524 firm-years from 863 companies (fiscal 2021–2025) in which the company lobbied in the current or prior year. Our pre-specified primary test is the Spearman rank correlation between the change in log lobbying spend and the change in log contract obligations the next year. We also run first-difference regressions with firm-clustered standard errors, a version controlling for company revenue, a firm fixed-effects version, and a mirror test in the reverse direction — whether contract growth precedes lobbying growth. Companies with zero contracts stay in the sample; every measurement choice is stress-tested below.
The result: no link in either direction
| Test | Estimate | 95% CI | n |
|---|---|---|---|
| Lobbying Δ → next-year contract Δ (Spearman, primary) | ρ = −0.003 | [−0.036, +0.030] | 3,524 |
| First-difference regression | β = −0.028 | [−0.057, +0.001] | 3,524 |
| First difference + revenue control | β = −0.018 | [−0.050, +0.014] | 2,252 |
| Firm fixed effects (levels) | β = +0.021 | [−0.030, +0.071] | 3,524 |
| Contract Δ → next-year lobbying Δ (Spearman) | ρ = −0.010 | [−0.074, +0.054] | 929 |
Table 1: Primary test and companion specifications. Every interval includes zero, and the point estimates do not agree on a sign.
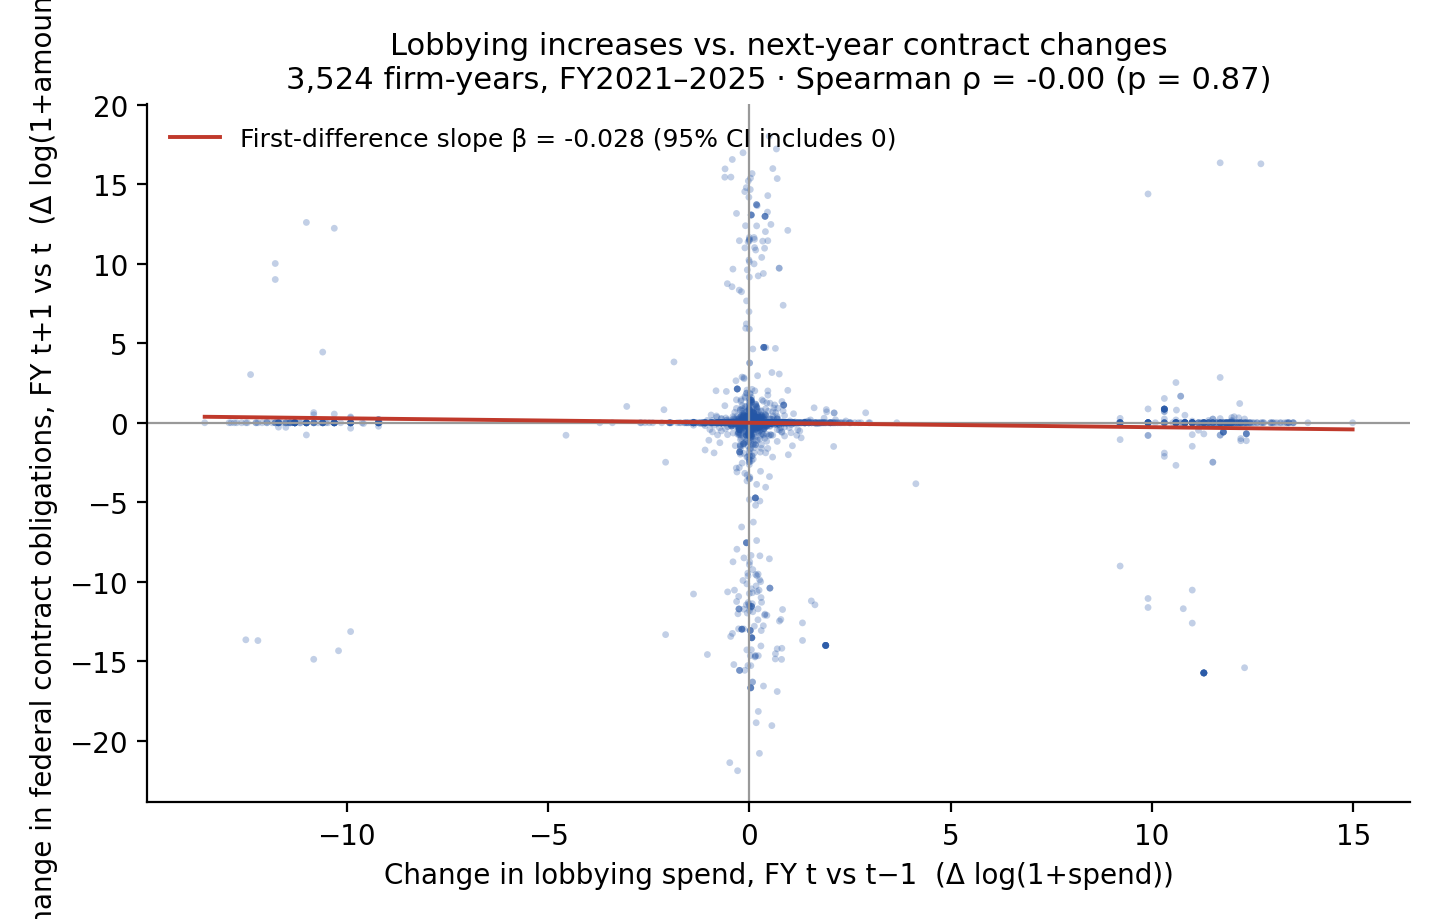
Every interval includes zero, and the point estimates cannot even agree on a sign: the fixed-effects estimate is positive, the first-difference estimate is negative. In practical terms, the first-difference slope implies that a doubling of lobbying spend is associated with roughly a 2% decrease in next-year contract obligations — with a confidence interval running from about −4% to 0%. That is not a penalty for lobbying; it is a zero measured with noise.
The simplest cut of the data says the same thing. After a lobbying increase, next-year contracts rose in 16.2% of firm-years and fell in 17.9%; after a lobbying decrease, contracts rose in 14.2%. The gap between those rates is +2.0 percentage points with a confidence interval of [−0.5, +4.6] — indistinguishable from chance.
The dollar view is starker. For the 3,376 firm-years with positive lobbying spend, next-year contract obligations per lobbying dollar have a median of $0.00 and a 75th percentile of $0.24. In 69.0% of firm-years, a company that lobbied received no federal contract obligations at all the next year. The mean ratio, $267.93, is an artifact of a thin tail (the 90th percentile is $40.22) — a handful of enormous awards against small lobbying budgets. Anyone quoting an average "return" on lobbying from data like this is quoting the tail, not the tendency.
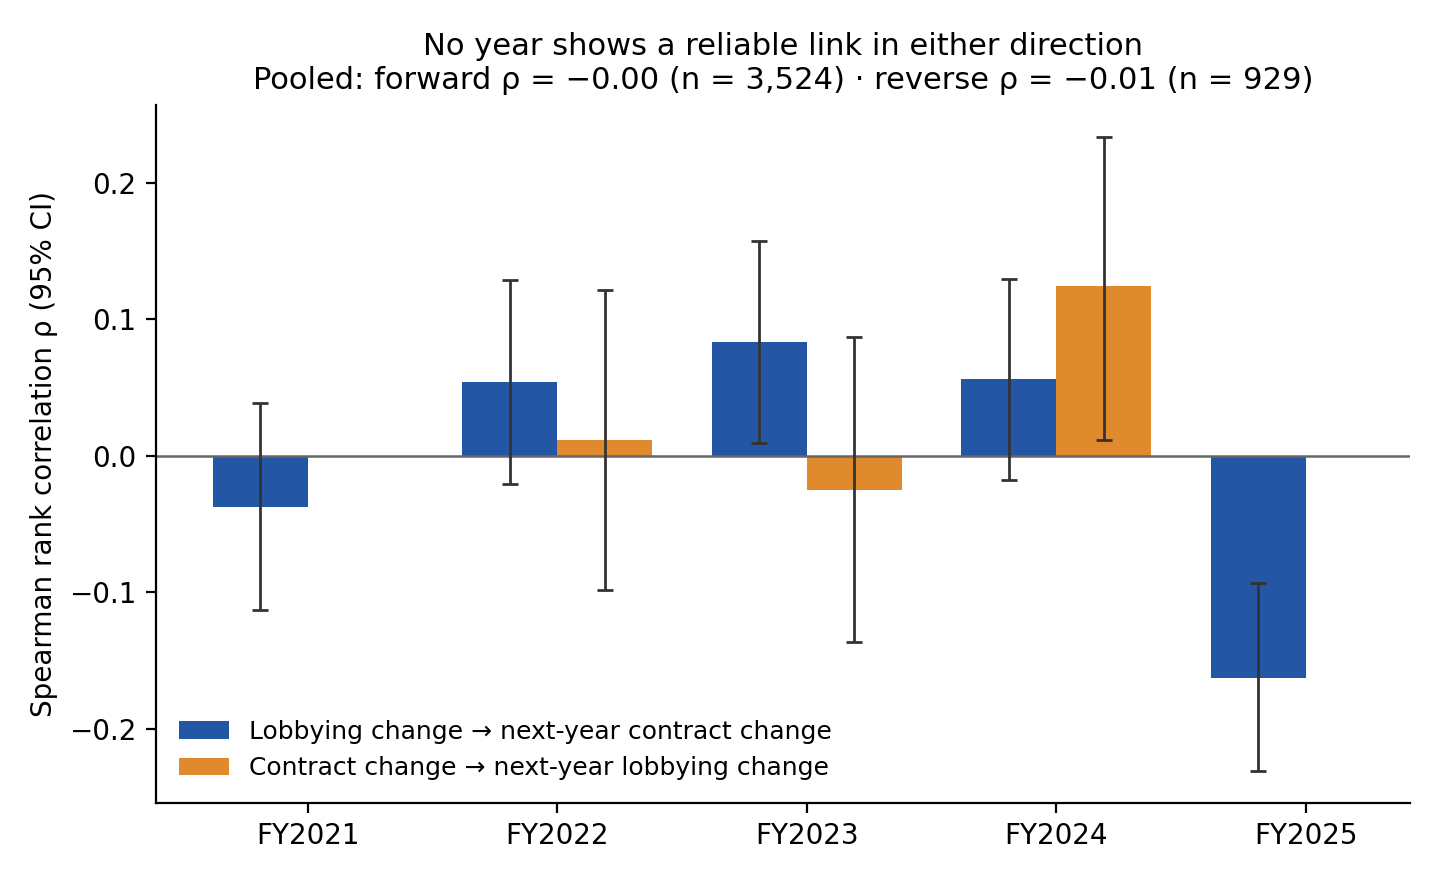
Year by year, the correlation wanders: +0.08 in fiscal 2023 and −0.16 in fiscal 2025, the two years that individually clear p < 0.05 — in opposite directions. A relationship that flips sign year to year is what noise looks like.
Does the result survive?
We re-ran the primary test ten ways: strict name matching only, excluding amended filings, deduplicating amended report cells, calendar-year instead of fiscal-year alignment, only firms that ever win contracts, one ticker per issuer (removing duplicate listings), winsorizing the changes, the original name rule without our "Holding" extension, and the intensive margin only (firms with contracts in both years). The correlation stays between −0.02 and +0.01 in eight of the ten. Two variants move it slightly positive: dropping fiscal 2025 gives ρ = +0.045 (p = 0.019), and the intensive-margin subsample gives ρ = +0.066 (p = 0.056, n = 830). Neither is a pattern — the first depends on deleting the most recent year, the second does not reach conventional significance, and both effect sizes are trivial (ρ² of about 0.2–0.4%). The honest summary is not "we found the one specification that works"; it is that no specification finds a meaningful link.
Cases: the tail, the typical, and the top of the table
Bristow Group nearly doubled its lobbying in fiscal 2023, from $750,000 to $1.47 million, and its federal contract obligations jumped from $0 to $30.06 million the next year — the largest next-year contract increase among firm-years with a big lobbying rise. Cases like this exist. They are the tail of the distribution, and for every one of them there is a Barrick Mining, which went from $0 to $3.22 million of lobbying in fiscal 2025 and was followed by $0 in contracts. The median case is quieter still: Applied Optoelectronics spent $100,000 on lobbying in fiscal 2025 and received $0 in contract obligations the next year — the single most typical outcome in the data.
The top of the spending table makes the same point at scale. Meta was the largest lobbying spender in the sample, $131.2 million across fiscal 2021–2025, and recorded $0 in federal contract obligations across fiscal 2022–2026. Lockheed Martin spent $105.2 million and booked $291.52 billion. Pfizer spent $114.6 million and booked $18.57 billion. Big contractors do lobby heavily — in levels, lobbying and contracts both scale with company size. It is the changes that refuse to line up, and changes are what a "lobbying buys contracts" claim predicts.
Objections and limits
Obligated is not spent, and awards bunch. USAspending records obligations in the year a contract is signed; a multi-year vehicle can book its full ceiling in one year. If lobbying pays off in contracts spread over many years, a one-year lag could miss it. With only six fiscal years of contract data (2021–2026), longer lags are not testable — we flag this rather than paper over it.
Names hide subsidiaries. Both datasets are matched on the parent company's registered name. Lobbying or contracting done under a subsidiary's name is missed, which biases any true association toward zero. The measurement floor is visible: Accenture shows $10.01 billion of contract obligations in our data and no captured lobbying filings at all — a collection gap, not evidence that Accenture does not lobby. Conversely, only 3.1% of all contract dollars sit at firms with zero attributed lobbying, so the contract side of the ledger is concentrated among firms that do report lobbying. Both facts can be true at once: contract money lives at lobbying firms, and most lobbying still ends with no contract.
A null here is not "lobbying doesn't work." The test covers one possible payoff — federal contracts, one year later. Lobbying aimed at a tax provision, a regulation, or stopping a rule would leave no trace in this data. What the data does rule out is the simple version of the story in which disclosed lobbying budgets translate, mechanically and measurably, into next-year federal contract volume.
The panel is short and the last year is odd. Five changes per firm at most. Fiscal 2025 lobbying totals jump in our collection ($1.59 billion, 753 firms, versus $1.37 billion and 675 firms in fiscal 2024), which may mix real growth with disclosure-coverage growth; the result without fiscal 2025 is reported above and does not rescue a positive link of any size.
How to read stories like this
When a headline pairs a company's lobbying bill with a contract it won, ask for the base rate first: in this data, 69.0% of lobbying firm-years are followed by zero contract dollars, and the median outcome per lobbying dollar is $0.00. A single pairing, however suggestive, is drawn from a distribution whose center is zero.
The same verify-first approach runs through our other work: in 5.6%: How Rarely Members of Congress Buy What They Oversee, the trades members of Congress make inside their own committees' industries showed no performance edge either; in 1,404 "Linked" Trades. Chance Predicted 1,385., congressional purchases in lobbying companies matched the chance baseline almost exactly; and in The Sale Notice That Almost Always Becomes a Sale, we checked how often insiders' Form 144 sale notices actually become sales. The full firm-year panel behind this article is published as a CSV with the article (panel_lobbying_to_contracts.csv), so anyone can re-run every number here.
Methodology and data
Lobbying: Senate Lobbying Disclosure Act filings (LD-2), collected per company and attributed by normalized client name (tiered exact/core-name matching, with a disclosed extension treating trailing "Holding/Holdings" as a legal-form token; 73,355 filings attributed for 2019–2026). A firm's annual lobbying spend is the sum of income and expenses on filings naming it as client — expenses capture in-house operations, income captures amounts outside firms report receiving; no filing in the sample reports both. Amended filings (7.1% of spend) are included in the headline measure and excluded in a sensitivity test. Contracts: USAspending federal contract obligations (award types A–D) by recipient registered name, fiscal 2021–2026; obligated amounts are commitments, not outlays. Exclusions: 33 companies whose contract collection failed (15 in the test universe), 1 company whose lobbying collection failed, and 140 tickers with no name source for attribution (none had contract data). Revenue control: company fiscal-year revenue from SEC company facts. The primary test was specified before computation; all other specifications are labeled sensitivity checks. There is no trading strategy in this article, so trading costs and taxes do not arise. Past patterns are not a promise of future results. For education only — not investment advice.
Revision history
- v1.0 — October 13, 2026: first publication. Lobbying filings through 2026; contract obligations through FY2026.