GetCoattail Research — Microsoft is the market's AI-infrastructure story at full scale: Azure growth above 40%, a capital-spending bill above $115 billion, and a stock that rose 38.7% from June 30 to October 2 in our price file. We ran it through every filing lens we maintain. Thirty-seven of our 83 tracked superinvestors hold it long — more than in any earlier audit in this series — while its insiders have recorded exactly two open-market purchases in the entire parsed record.
Start with the narrative: a build-out story measured by two numbers pulling in opposite directions. Coverage of Microsoft's fiscal fourth quarter, ended June 30, 2026, put revenue at $90.0 billion, up 18% year over year, with Azure and other cloud services revenue up 43% in constant currency, full-year Azure revenue above $100 billion, and an AI business at a $37 billion annual run rate in the company's third-quarter materials. The same coverage put fiscal 2026 capital spending at $115.95 billion and free cash flow at $66.99 billion, down 6.46%. Analysts have been marking the story up into the next print: Melius Research upgraded the stock to Buy on October 5 with a $665 target, Evercore ISI holds a Buy at $635, and the consensus average target in coverage is about $578.69. The next earnings report, for the first quarter of fiscal 2027, is scheduled for October 28, and the same week's coverage included a $2,599 Surface Laptop Ultra built on an Nvidia RTX chip. AltIndex counted 249 Reddit mentions in the 24 hours to October 9, up 107.5%, with Bullish sentiment.
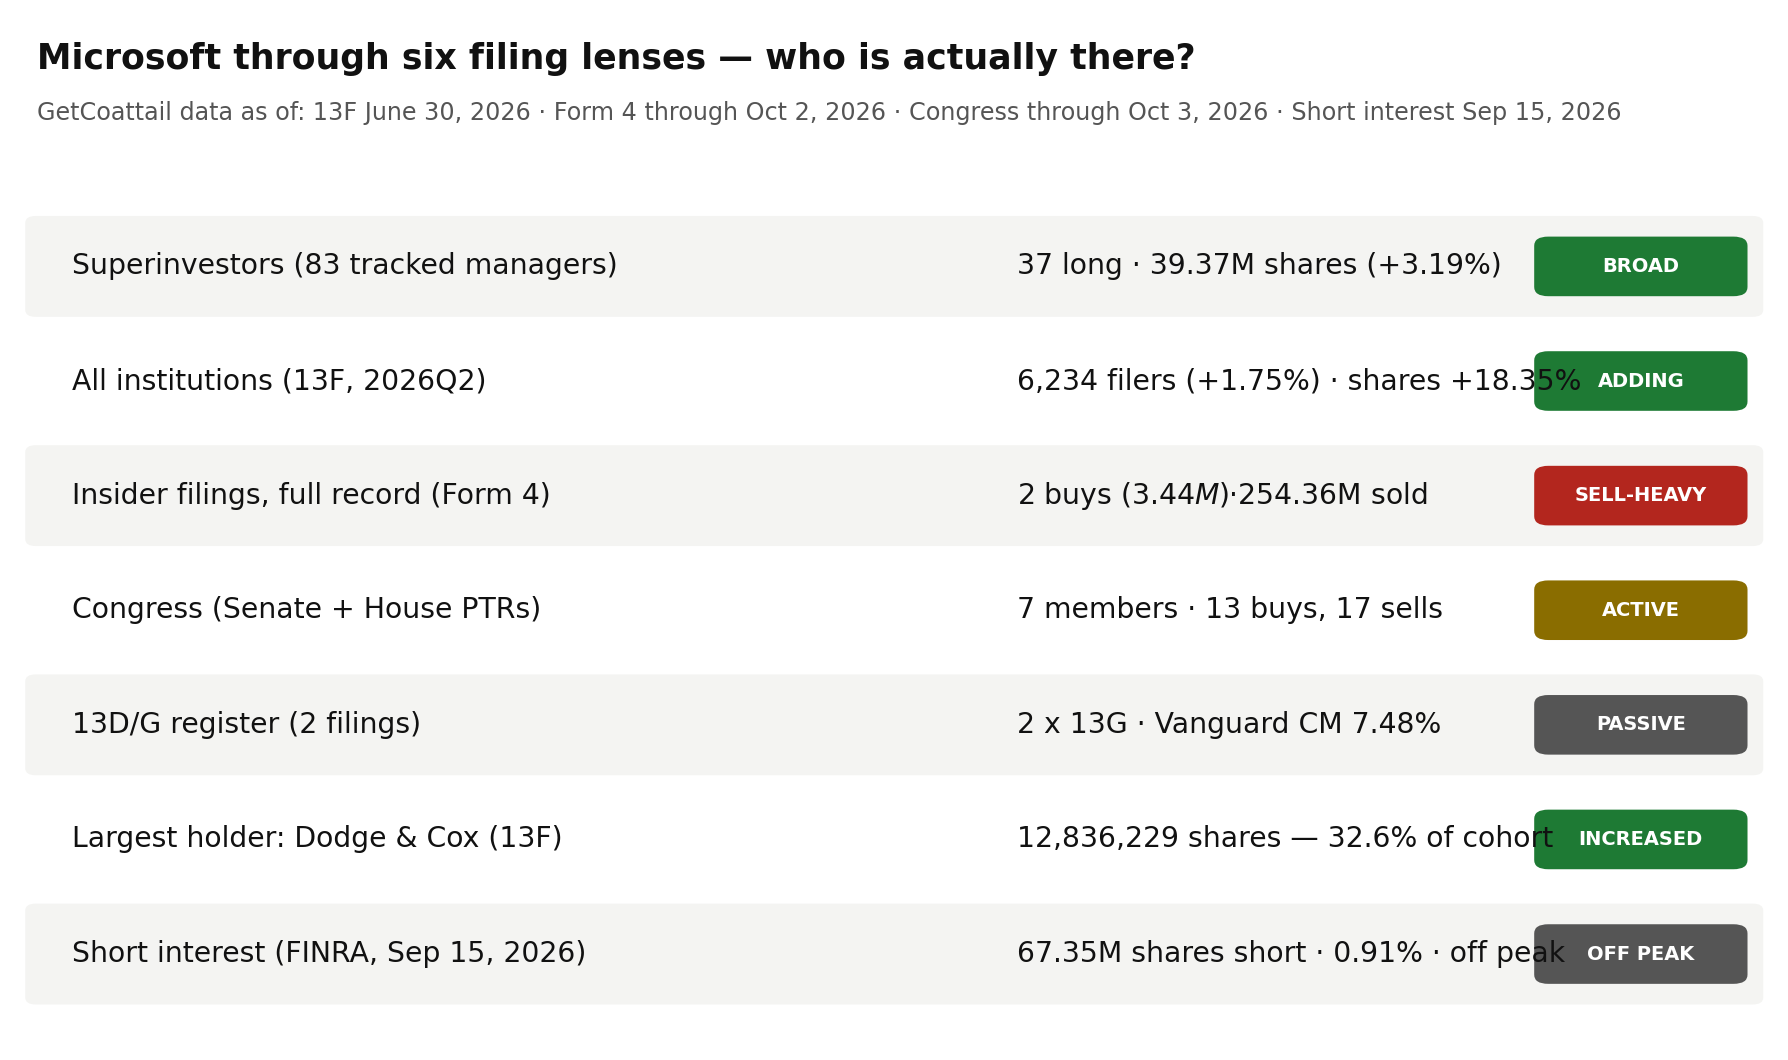
Now the filings. GetCoattail tracks the investors best placed to know any company: superinvestors, institutions, insiders, Congress, and 5% holders. For Microsoft — the twenty-first Filing Tape audit — the story is the broadest superinvestor register this series has recorded, against an insider register that is almost entirely one-directional, a congressional register active on both sides, and a borrow shrinking since June.
Lens 1: the superinvestors — 37 holders, split exactly down the middle
We track 83 large, mostly long-only managers whose 13F portfolios we collect directly from SEC EDGAR. As of June 30, 2026, 37 held Microsoft in a long common-stock position — long rows, with no option rows in the count. That is the largest holder count in this series so far, above the 35 recorded for Amazon. Together the 37 held 39,373,656 shares worth $14,687,184,513. The quarter-to-quarter comparison, on the pipeline's CUSIP basis in both quarters, runs from 38,154,922 shares across 38 rows at March 31 to 39,373,656 shares across 37 rows at June 30 — up 3.19%, with one fewer holder holding more shares. The pipeline and EDGAR-collection share totals agree exactly. The direction count is the unusual part: four new, 15 increased, 15 decreased, three unchanged — increases and decreases in exact balance, in a quarter when the price rose from $370.17 to $373.02 in our price file, up 0.8%.
The largest holder is Dodge & Cox Funds, with 12,836,229 shares worth $4,788,170,142, a 2.51% portfolio weight, increased 7.3% in the quarter — 32.6% of the entire cohort. The second-largest position is a new one: Bill Ackman at Pershing Square reported 6,206,730 shares worth $2,315,234,425, an 11.89% portfolio weight, marked NEW. The top three holders — Dodge & Cox, Pershing Square, and AltaRock Partners, with 2,334,482 shares, a 20.54% weight, increased 25.0% — together hold 54.3% of the cohort. New positions in total are 7,711,484 shares, 19.6% of the cohort, across four managers: Pershing Square, Viking Global Investors with 1,458,618 shares marked NEW, ShawSpring Partners with 45,495 shares, and Semper Augustus with 641 shares.
Lens 2: institutions — 1.75% more filers, 18.35% more shares
Zoom out to the whole 13F market and the register is as crowded as the tracked cohort suggests. At June 30, 2026, 6,234 institutions reported positions, up from 6,127 at March 31 (+1.75%), and 6,210 reported long positions. Reported shares rose 18.35%, from 4,593,075,015 to 5,435,913,875 shares, with 1,655 filers entering and 1,548 exiting. Reported aggregate value rose 20.93% to $2,104,871,429,458; the aggregate includes option rows, so we headline filer and share counts and label dollars "reported" (see methodology). The implied value per share, $387.22, sits 3.8% above the June 30 close of $373.02 — among the smallest gaps this series has recorded on this check.
Lens 3: the 5% register — two filings, both 13G, both Vanguard
Two SC 13D/G filings cover Microsoft — zero in the 13D family and two 13G filings, one amendment, from two reporting names, the most recent filed April 30, 2026, maximum reported percentage 7.48%. There is no activist register here. Vanguard Capital Management reported 555,988,240 shares (7.48%) as of March 31, 2026, filed April 30, 2026. The Vanguard Group reported a 0-share row as of March 13, 2026, filed March 27, 2026 — the same sequence seen in several earlier audits, where a Vanguard position reappears under a related reporting name; we report rows as filed, without summing them or calling the zero an exit.
Lens 4: insiders — two purchases in the entire parsed record, against $254,355,475.21 of sales
The buy side of this register is not empty, but it is close. Across the parsed Form 4 record (225 filings through October 2, 2026), there are two open-market purchases totalling 8,842 shares and $3,436,970.53, by two buyers — one of them an officer purchase of $1,450,220.53. Against that stand 44 sales totalling 526,832.31 shares and $254,355,475.21, by seven sellers, all 44 of them recorded as officer sales. Both purchases fall inside the most recent year (140 filings; the same two purchases; 27 sales totalling $116,258,040.62, by seven sellers). In the 90 days through October 2, 2026, 43 filings covered zero purchases and 16 sales totalling 143,009.35 shares and $71,420,550.98, by four sellers — again, all 16 recorded as officer sales. Our site's insider aggregate (October 9, 2026) matches the full-parse 90-day figures exactly. Some selling is mechanical — vesting, tax withholding and pre-arranged plans — and we assign no motives. The record establishes only this: purchases total $3,436,970.53 across the entire parsed record, against $254,355,475.21 of sales.
Lens 5: Congress — seven members, both parties, both directions
Across the Senate and House record we maintain (combined record as of October 3, 2026), Microsoft is one of the more active names in this series: seven members, 13 purchase transactions and 17 sale transactions, the most recent purchase dated September 10, 2026, with both parties represented. The House accounts for all of it on the buy side — seven members, 13 purchases and 16 sales (House record as of October 3, 2026) — while the Senate aggregate records zero purchases and one sale (Senate record as of October 1, 2026). Congressional disclosures report value ranges rather than exact amounts, so we record direction and counts only.
Lens 6: short interest — 29.2% below the June peak, at 0.91% of the share count
As of September 15, 2026 — the most recent FINRA settlement date — 67,346,414 Microsoft shares were sold short, with days-to-cover of 3.73. That reading sits well below the top of the series: the peak settlement, June 15, 2026, recorded 95,188,264 shares, so the latest reading is 29.2% below the peak, and the June 30 settlement recorded 89,063,316 shares. Year over year, the September 15, 2025 settlement recorded 65,238,937 shares, so the latest reading is up just 3.2%. Against the 7,425,545,491 shares in our fundamentals file, the borrow is 0.91% of the share count.
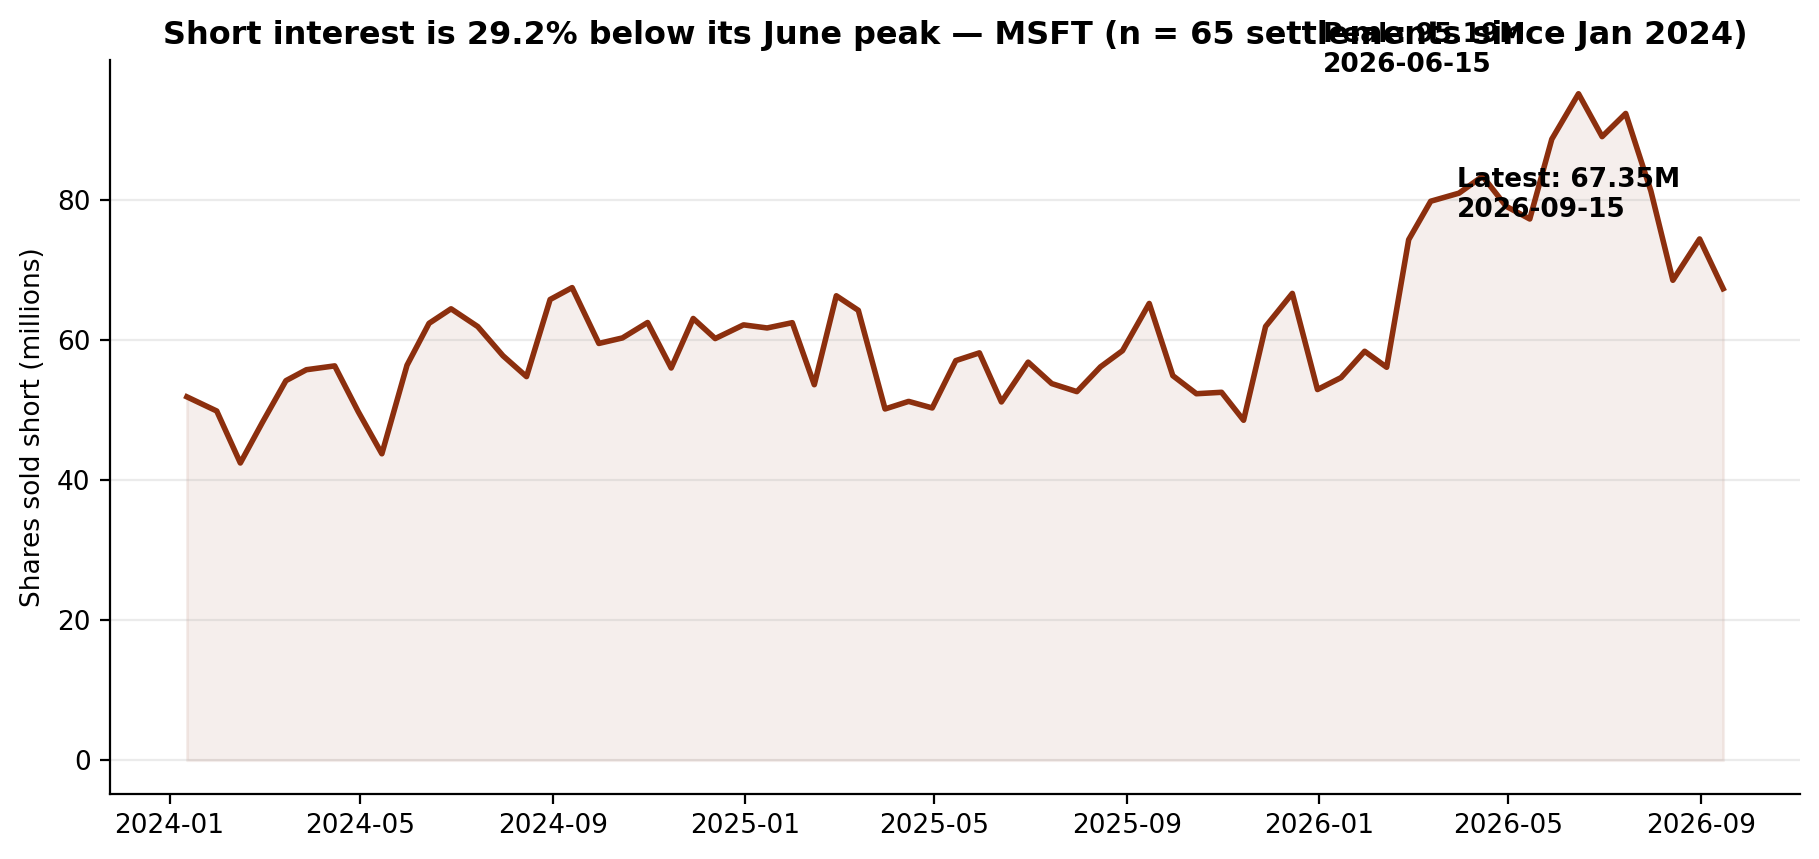
The recent settlements run 92,373,474 on July 15, then 81,311,791, 68,544,953, 74,451,155 and 67,346,414. The series began at 41,952,779 shares on January 15, 2021; its lowest reading is 31,028,035 shares on August 15, 2023.
The gap, stated plainly
The registers agree on presence and disagree on conviction. The tracked superinvestors hold Microsoft more broadly than any stock yet audited in this series — 37 of 83 managers, 39,373,656 shares — yet inside that breadth they split exactly: 15 increased, 15 decreased, four new, three unchanged, with 19.6% of the cohort's shares arriving as new positions in a single quarter, most of them one manager's. The full market added shares at 18.35% while adding filers at 1.75%. Insiders bought twice in the entire parsed record — $3,436,970.53, one of the two by an officer — against $254,355,475.21 of sales, all of them officer sales. Congress filed on both sides: 13 purchases, 17 sales, seven members. And the borrow, at 67,346,414 shares and 0.91% of the share count, is 29.2% below its June peak, in a stock that rose 38.7% from June 30 to October 2 in our file and sits 4.5% below its 252-session closing high of $542.07. One plausible reading is that the registers are describing two different time horizons — the 13F registers a position built at June prices near $373, the borrow and the insider record a register that has been lightening into a rise toward $517.53. The record supports each clause separately; it does not say which register is right.
What would change the picture
Nothing above is a recommendation. It is a record. These are the filings that would change the description:
- 1. The 2026Q3 13Fs (filing window closing mid-November 2026). Q3 contains the rebound — the price rose 38.7% from June 30 to October 2 in our file. Whether the four new positions, including Pershing Square's 6,206,730 shares, survived that rise, and whether the exact 15–15 split between increasers and decreasers breaks in either direction, is the whole lens: at 37 holders, breadth is no longer the question — direction is.
- 2. A third insider purchase — anywhere, at any size. Two purchases totalling $3,436,970.53 stand against 44 sales totalling $254,355,475.21 in the parsed record, with zero purchases in the most recent 90 days. A single further purchase would raise the all-time count from two to three; continued absence keeps the buy column where it has been for the entire record.
- 3. The next short-interest settlements after a falling borrow. The borrow stood at 67,346,414 shares on September 15, down 29.2% from the June 15 peak of 95,188,264. The next settlements show whether borrowers treated the June peak as a top or a pause: FINRA publishes every two weeks.
- 4. Congressional filings after September 10. The combined record shows 13 purchases and 17 sales by seven members of both parties, the most recent purchase dated September 10, 2026. Further filings in either direction extend one of the few two-sided congressional registers in this series; a quiet quarter would leave it balanced where it stands.
- 5. Any 13D, from anyone. The 5% register holds two 13G filings and nothing else — a passive Vanguard position of 555,988,240 shares (7.48%) and a 0-share row. A first 13D, or a new 13G filer above 5%, would create a register that does not currently exist.
Until one of those prints, the record describes a stock held by more of our tracked superinvestors than any audited before it — 37 of 83, split 15 increased against 15 decreased, with a fifth of the cohort's shares newly arrived — whose insiders have bought twice for $3,436,970.53 against $254,355,475.21 of sales, and whose borrow, at 67,346,414 shares, has fallen 29.2% from its June peak into a 38.7% price rise.
Related reading: One of 83: The Superinvestors Hold Just 5,380 AST SpaceMobile Shares. Short Interest Just Hit a Record. — Filing Tape #20; Eight of 83: Six Superinvestors Cut Fair Isaac as the Price Rose 11.9%. Its Insiders Have Never Bought a Share. — Filing Tape #19; Zero of 83: The Superinvestors Aren't in IREN — Filing Tape #1. Microsoft's own page: Microsoft (MSFT) on GetCoattail.
Methodology and data notes
- Superinvestor lens: 83 managers collected directly from SEC EDGAR Form 13F (managers_13f collection), positions as of June 30, 2026; Microsoft identified by CUSIP 594918104. Thirty-seven distinct managers hold a long position totalling 39,373,656 shares; all 37 reported rows are long (no put or call rows). Quarter-to-quarter cohort totals (38,154,922 shares across 38 pipeline rows at March 31; 39,373,656 across 37 pipeline rows at June 30) are from the site pipeline's holdings files on the same CUSIP basis in both quarters; the change is +3.19% ((39,373,656 / 38,154,922) − 1), and the pipeline's second-quarter share total agrees exactly with the EDGAR collection's long total (difference: 0 shares). The largest holder's share of the cohort is 12,836,229 / 39,373,656 = 32.6%; the top three holders' share is 54.3%; new positions total 7,711,484 / 39,373,656 = 19.6%. Direction counts across the 37 long holders: 4 new, 15 increased, 15 decreased, 3 unchanged. The "largest count in this series" comparison is against the holder counts in the titles of the 20 earlier audits in this series, the largest of which was Amazon at 35 of 83.
- Full-market lens: SEC Form 13F Data Sets full-market aggregation (the fixtures underlying our 2026Q1–Q2 market tables). Holders = distinct filers reporting the CUSIP; 6,210 of the 6,234 reported long positions. Reported-value caution: the aggregate value ($2,104,871,429,458 over 5,435,913,875 shares) implies ≈$387.22 per share against a June 30, 2026 close of $373.02 in our price file, a gap of 3.8%. The aggregate sums the VALUE of every information-table row — including put and call option rows — while the share count covers long common-stock rows only, so we headline filer and share counts and label dollar values "reported."
- Insider lens: full-parse Form 4 aggregation (agg_by_ticker), record as of October 2, 2026 (225 filings). Sale and purchase counts are transaction-code counts (S and P) in non-derivative rows; grants and exercises are not counted as purchases, and one filing can contain many transaction rows. Purchase transactions total two across the full record (8,842 shares, $3,436,970.53, two buyers), of which one is recorded as an officer purchase ($1,450,220.53). Sale transactions total 44 across the full record (526,832.31 shares, $254,355,475.21, seven sellers), all 44 recorded as officer sales. In the most recent year: two purchases, $3,436,970.53, two buyers; 27 sale transactions, $116,258,040.62, seven sellers. In the 90 days through October 2, 2026: zero purchases; 16 sale transactions, 143,009.35 shares, $71,420,550.98, four sellers. The site's insider aggregate (compiled as of October 9, 2026) matches the full-parse 90-day figures exactly.
- 13D/G lens: full-parse SC 13D/G aggregation and parsed filings (2 filings matching CUSIP 594918104, 2 reporting names), filings through April 30, 2026. Vanguard Capital Management's row (555,988,240 shares at 7.48% as of March 31, 2026) and The Vanguard Group's row (0 shares as of March 13, 2026) are reported as separate rows, as filed; they are not summed. The aggregation's totalSharesReported field sums overlapping reporters and successive amendments and is not used. Percentages are quoted exactly as reported in the respective filings.
- Congress lens: Senate PTR archive and House PTR archive as maintained on this site, combined record as of October 3, 2026 (7 members, 13 purchase transactions, 17 sale transactions, most recent purchase September 10, 2026, both parties). The House aggregate (as of October 3, 2026) records 7 members, 13 purchases and 16 sales; the Senate aggregate (as of October 1, 2026) records 0 purchases and 1 sale. Congressional disclosures report value ranges, so this lens records direction and counts only.
- Short interest lens: FINRA Equity Short Interest files (biweekly settlement dates), collected directly from FINRA's public distribution; the Microsoft series covers 137 settlements from January 15, 2021 to September 15, 2026. The maximum of the full collected series is 95,188,264 shares on June 15, 2026, so the latest reading of 67,346,414 shares on September 15, 2026 sits 29.2% below the peak ((67,346,414 / 95,188,264) − 1). FINRA publishes each settlement about two weeks after the fact. The share-count ratio uses the fundamentals file's share count of 7,425,545,491 — a period-end outstanding count (dei EntityCommonStockSharesOutstanding) as of July 23, 2026.
- Fundamentals note: our fundamentals collection carries Microsoft's fiscal-2026 revenue of $331,839,000,000, fiscal-2026 net income of $133,749,000,000 and fiscal-2026 assets of $758,376,000,000. The market value of about $3.93 trillion uses that file's October 6, 2026 price ($529.30) and reported share count.
- Prices: our own daily-close file for Microsoft through October 2, 2026 ($517.53 close, +7.0% year to date on that file; 252-session closing high $542.07 on October 28, 2025; 252-session closing low $352.83 on June 25, 2026; closes of $370.17 at March 31, 2026 and $373.02 at June 30, 2026, a second-quarter change of +0.8%; change from June 30 to October 2 of +38.7% ((517.53 / 373.02) − 1)). The drawdown from the 252-session closing high is −4.5% ((517.53 / 542.07) − 1), and the gain from the 252-session closing low is +46.7%.
- Market context sources: fiscal fourth-quarter revenue of $90.0 billion (up 18%), Azure and other cloud services growth of 43% in constant currency, full-year Azure revenue above $100 billion, and an AI annual run rate of $37 billion from third-quarter materials — earnings coverage, checked October 10, 2026, summarised in our own words; fiscal 2026 capital spending of $115.95 billion and free cash flow of $66.99 billion (down 6.46%) — financial coverage of the same results, checked October 10, 2026; Melius Research upgrade to Buy on October 5, 2026 with a $665 target, Evercore ISI Buy at $635, and a consensus average target of about $578.69 — analyst coverage, checked October 10, 2026; fiscal 2027 first-quarter earnings scheduled for October 28, 2026, and a $2,599 Surface Laptop Ultra on an Nvidia RTX chip — product and earnings-calendar coverage, checked October 10, 2026; social-media attention ranking (249 Reddit mentions in 24 hours, up 107.5%, Bullish sentiment, price shown $534) — AltIndex, checked October 10, 2026. Figures we could not confirm against two sources were left out.
- Microsoft is in the GetCoattail stock-page universe: Microsoft (MSFT) stock page. Series data: msft_lens_data.csv · msft_short_interest_series.csv. Earlier audits: AST SpaceMobile · Fair Isaac · IREN.
This article describes public filings as of the dates stated. It is not investment advice and makes no recommendation. Filings lag reality: 13F positions are as of June 30, 2026, and later trading is not yet public.
Revision history
- v1.0 — October 10, 2026: first publication.