GetCoattail Research — The Filing Tape #100. Strategy arrived in the trending lists on an index story: MSCI has adopted rules that could remove it from its global indexes, with a final list due November 11. The filings describe a register with almost no tracked long money in it at all: 1 of the 147 superinvestors we track holds the common stock long, at 50,203 shares, while a second tracked manager's put row covers 1,150,000 shares — 22.9 times the long total — its insiders recorded no purchase in the last 90 days, and short interest stands at 11.07% of the share count.
The Hype
Strategy drew attention this week on an index-eligibility story, not an earnings story. As reported by Reuters on October 16, 2026, MSCI adopted new rules on Thursday making non-operating companies ineligible for its Global Investable Market Indexes from the close of November 30, 2026, and Strategy sits on MSCI's list of potential deletions. MSCI will publish the final list of affected companies on November 11, 2026, as reported. Reuters also reported that the shares fell 2.7% in premarket trading on Friday, and that the company had previously warned an exclusion could see $2.8 billion of its stock liquidated — an outside figure from earlier coverage, kept separate from our files below. StockTwits' October 16 trending list carried Strategy in its main trending section the same day. Our own price file, which ends October 2, 2026, shows the setup before this headline: a second quarter down 30.3%, then a rebound of 84.1% off the June 30 close into October 2, leaving the last close 55.5% below its 252-session high.
The Tape
For Strategy — the one-hundredth Filing Tape audit — the tape shows a tracked cohort of exactly one long holder who trimmed, a put row far larger than that long position, a full market that added shares while its filer count fell, an insider record with no purchase in 90 days, a single congressional purchase, a passive-only 5% register, and a borrow above a tenth of the share count.
| Lens | As of | What the filings show | Direction vs prior period |
|---|---|---|---|
| Superinvestors (13F) | Jun 30, 2026 | 1 long holder of 147 tracked managers; 50,203 shares; top holder is 100.0% of the cohort | Verified holder -3.6% vs Q1; 1 DECREASED; 0 exits; plus 1 put row of 1,150,000 shares |
| All institutions (13F) | Jun 30, 2026 | 880 filers; 208,018,834 shares; reported value $31,705,833,707 | Filers -66 (-6.98%); shares +30.48% |
| Insiders (Form 4) | Oct 2, 2026 | 32 purchases in the full parsed record (133 filings); 277 sales | Last 90 days: 0 purchases, 17 sales |
| Congress | Oct 3, 2026 | 1 recorded purchase and 0 sales in the combined aggregate; no Senate row | Purchase only on record; last buy Jun 5, 2026 |
| 13D/G | May 14, 2026 | 19 parsed filings, all 13G family (4 SC 13G, 15 SC 13G/A); register maximum 10.1% (Capital International Investors) | Latest filing is also the maximum, as of Mar 31, 2026 |
| Short interest (FINRA) | Sep 15, 2026 | 30,741,182 shares; 11.07% of shares outstanding; 1.42 days to cover | Down 5.77% from the prior settlement; down 28.1% from the Jun 30, 2026 peak |
Lens 1 — the superinvestors: one long holder, and a put row 22.9 times larger. We track 149 large, mostly long-only managers whose 13F portfolios we collect directly from SEC EDGAR — 147 managers are in the collection: 144 at a June 30 period-end, and 3 early filers already at September 30. On the single common-stock CUSIP 594972408, the long count is 1 holder: Bill Miller - Miller Value Partners, with 50,203 shares worth $4,364,147 — 100.0% of the cohort's long total — at a 1.03% portfolio weight, labelled DECREASED. That holder verifies row by row against the first quarter: 52,058 shares at March 31 to 50,203 at June 30 (-1,855 shares, -3.6%), in a quarter the price fell 30.3%. No tracked manager exited, because only one held the name long to begin with, and no other tracked manager holds it long at June 30. The second row on this CUSIP is not a long position and is never counted as one: Sessa Capital reports a put row covering 1,150,000 shares worth $99,969,500, labelled INCREASED (+3621.7%), up from a put row covering 30,900 shares in the first quarter. The put row's share count is 22.9 times the entire long cohort's 50,203 shares, at the same implied price. Both rows imply exactly $86.93 per share, the June 30 close. 13F figures are as of June 30, 2026; funds have up to 45 days to file, so this is the complete second-quarter picture — and, as ever, a lagging one.
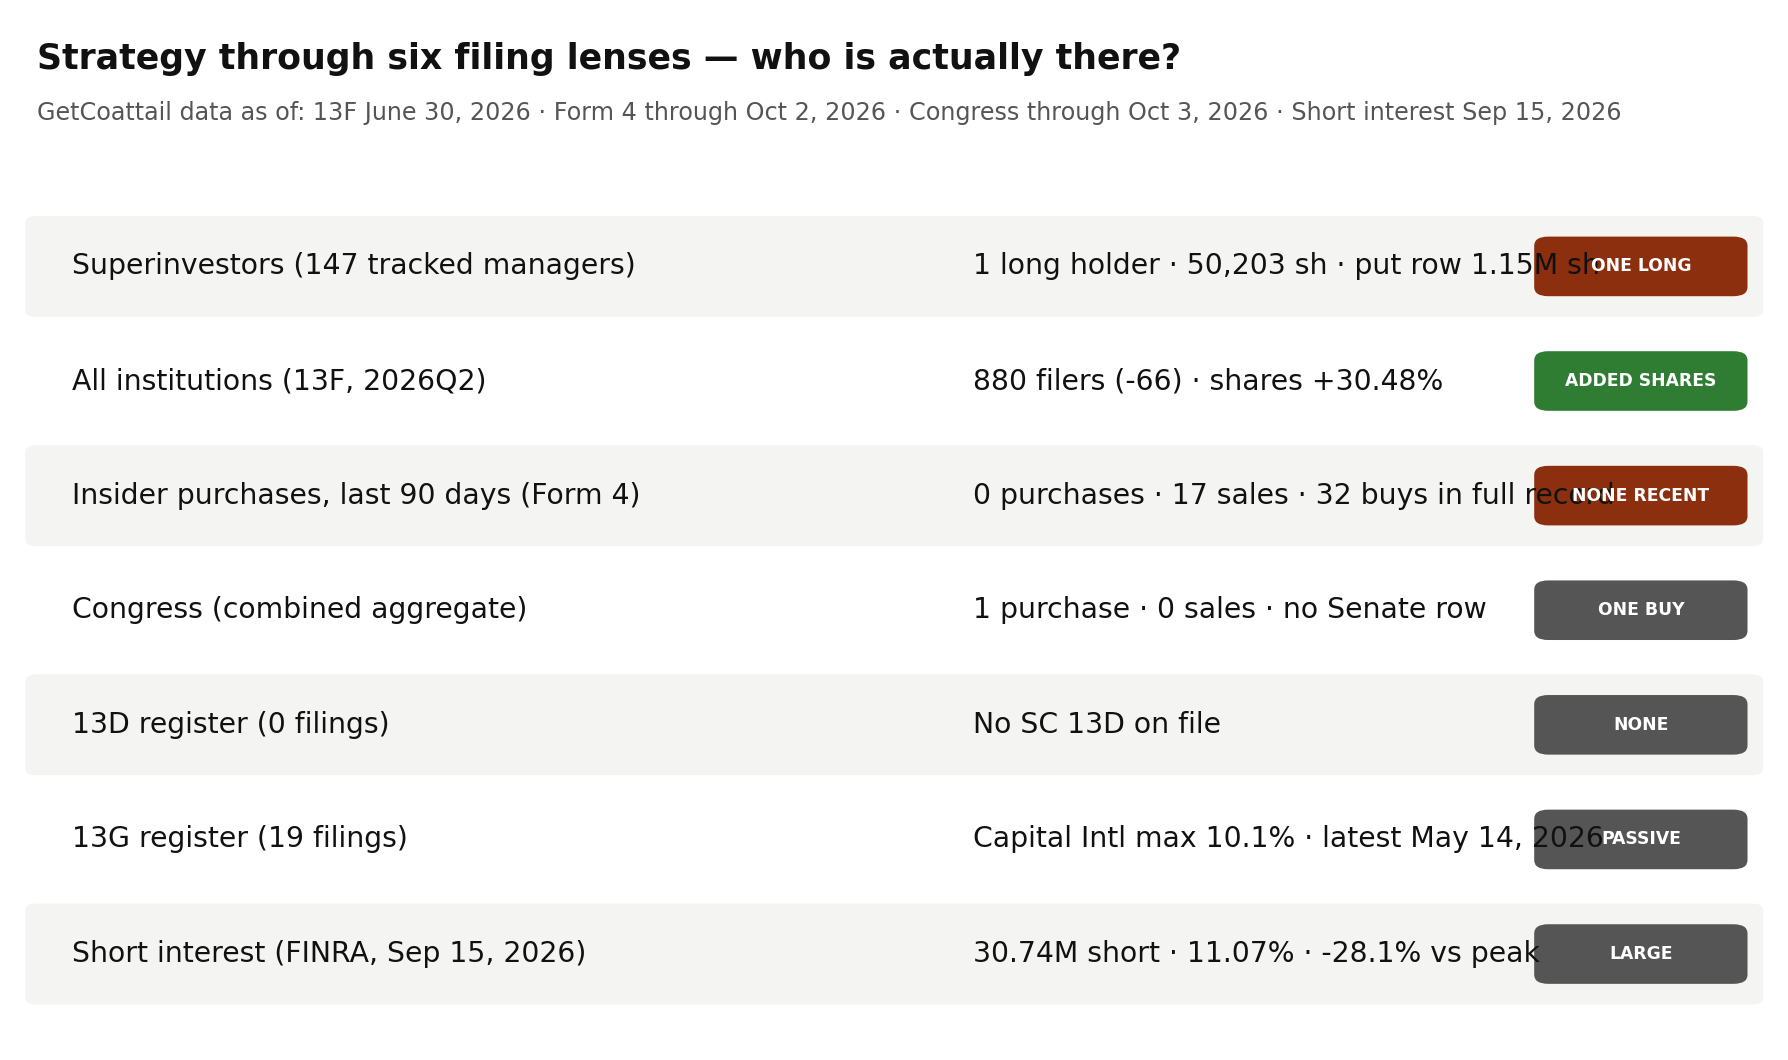
Lens 2 — institutions: fewer filers, 48.6 million more shares. At June 30, 2026, 880 institutions reported positions, down 66 from 946 at March 31 (-6.98%); 850 are long. Reported shares rose 30.48%, from 159,424,201 to 208,018,834, while reported value fell 16.73% to $31,705,833,707, labelled "reported" because the aggregate includes option rows (see methodology). That value implies $152.42 per share against a June 30 close of $86.93, a gap of +75.34% — printed here as found, and the reason this audit headlines filer and share counts rather than the reported value.
Lens 3 — insiders: no purchase in 90 days, against 17 sales. The parsed Form 4 record holds 133 filings through October 2, 2026, with 32 open-market purchase transactions across the record — 12 of them in the last year, by 5 buyers, totalling 44,567 shares for $4,565,359.79 — and none in the last 90 days. Sales number 277 across the record: 572,291 shares by 8 sellers. The last 90 days hold 0 purchases against 17 sales (16,506 shares for $1,922,308.27, by 2 sellers) across 8 filings, and the one-year window holds the same 12 purchases against 150 sales. The recent windows price cleanly: the 90-day sales imply $116.46 per share, inside that window's traded close range of $91.67 to $168.50, and the one-year sales and purchases imply $163.62 and $102.44, inside the one-year range. So the insider lens is not empty over its history — it is empty in the most recent quarter, which is the window closest to the current headline.
Lens 4 — Congress: one purchase, no sale, and no Senate row. The combined record (as of October 3, 2026) carries 1 recorded purchase transaction and 0 sales, by 1 member, with a last buy date of June 5, 2026, and the House aggregate carries the same single purchase. The Senate aggregate (as of October 1, 2026) carries no row at all. One transaction is the whole of this lens: it is a fact on the record, and it is too thin to read as a pattern.
Lens 5 — the 5% register: nineteen filings, all passive, headed by Capital International at 10.1%. Our full parse holds 19 SC 13D/G filings matching the site aggregate exactly — 4 SC 13G and 15 SC 13G/A filings, 15 of them amendments, across 16 reporter names, and no 13D filing at all. The register maximum is also its latest filing: Capital International Investors reports 31,642,100 shares at 10.1% as of March 31, 2026, filed May 14, 2026 as SC 13G/A. Before that, Vanguard Capital Management filed an SC 13G reporting 16,802,319 shares (5.34%) as of March 31, 2026, on April 30, 2026, while The Vanguard Group filed an SC 13G/A reporting 0 shares (0.0%) as of March 13, 2026 — a change of reporting entity inside one fund family, recorded exactly as filed.
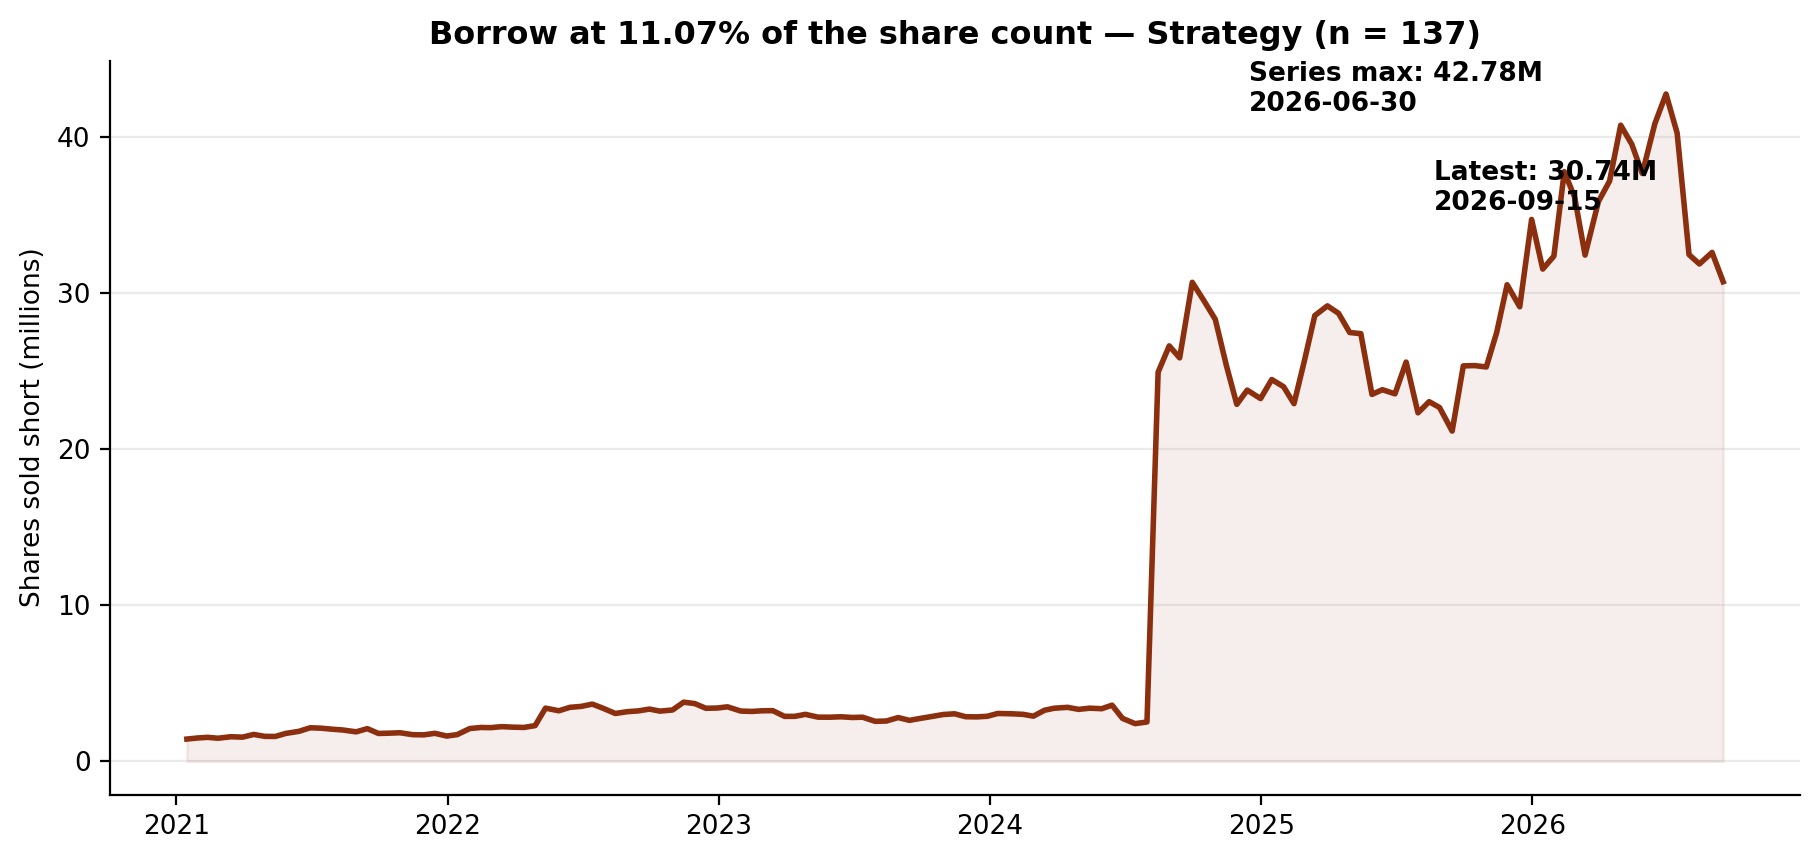
Lens 6 — short interest: 30,741,182 shares, 11.07% of the share count. This lens uses all 137 FINRA settlements for the symbol, every one a Strategy row, from January 15, 2021 to September 15, 2026. As of September 15, 2026, 30,741,182 shares were sold short, down 5.77% from the prior settlement (32,622,124 on August 31, 2026), at 1.42 days to cover. The series maximum is the June 30, 2026 settlement itself, 42,776,693 shares — so the latest sits 28.1% below the peak, after stepping 42,776,693 (June 30) to 40,275,607 (July 15) to 32,480,941 (July 31) to 31,879,835 (August 14), up to 32,622,124 (August 31), then down to 30,741,182 (September 15). Against 277,660,000 shares outstanding, the borrow is 11.07% of the share count — a level none of the recent audits in this series has printed.
The Gap
The narrative arriving this week is about passive money: a rule change that could, as reported, force index holders to sell, with a final list due November 11 and an effective date of November 30. The filings describe how little of the register that story currently touches in our tracked data. The superinvestor cohort — the long-only managers this series follows — holds 50,203 shares in total, from one manager who trimmed 3.6% in the second quarter. The only other tracked row on the name is a put covering 1,150,000 shares. The full market did add shares in the second quarter — 48,594,633 more, a rise of 30.48% — but it did so with 66 fewer filers, and its reported value fell even as its share count rose, because the price fell 30.3% in the same quarter. Insiders recorded no purchase in the last 90 days. Congress has one purchase on record. The 5% register is nineteen passive filings, the newest five months old. And the borrow, at 11.07% of the share count, is the one lens sized like the headline: large, and easing only slowly off its June 30 peak. One plausible reading is that the index question matters precisely because the register is built this way — broad, passive and borrowed, rather than held by the tracked long managers this series usually finds.
What Would Change the Picture
Nothing above is a recommendation. It is a record. These filings would change it:
- 1. MSCI's final list on November 11, 2026, as reported. Whether Strategy is named for deletion in the November review, effective from the close of November 30, 2026, is an outside event this audit cannot settle from filings — but the next 13F season will show, in filings, whether any tracked manager's row moved around it.
- 2. The 2026Q3 13Fs (filing window closing mid-November 2026). The long register is one manager: Bill Miller - Miller Value Partners, at 50,203 shares after a 3.6% trim. A second tracked long holder, at any size, would double this lens's breadth; an exit by the one holder would empty it.
- 3. The put row's next print. Sessa Capital's put row grew from 30,900 shares covered in the first quarter to 1,150,000 in the second. Whether that row grows, shrinks or disappears in the third-quarter filings is a filing fact, checkable on the same CUSIP.
- 4. A first insider purchase in a fresh 90-day window. The last 90 days hold 0 purchases against 17 sales, while the wider record holds 32 purchases. Any purchase in the next window would break the recent pattern without changing the longer one.
- 5. Short interest picking a direction. The borrow stands at 30,741,182 shares, down 28.1% from the June 30, 2026 peak of 42,776,693 and down 5.77% at the latest settlement, at 11.07% of the share count. A move back above the August 31, 2026 reading of 32,622,124 would break the easing; a sustained fall would extend it.
Related reading: Fifteen of 147: One Holder Is 41.4% of the Superinvestors' ServiceNow Stake. Its Insiders Have Bought Twice. — Filing Tape #99; Seven of 147: One Holder Is 69.0% of the Superinvestors' EchoStar Stake. Its Insiders Have Never Bought a Share. — Filing Tape #98. Strategy's own page: Strategy (MSTR) on GetCoattail.
Methodology and data notes
- As-of & limits: The lenses rest on different clocks, none live: 13F is a June 30, 2026 snapshot published up to 45 days later; Form 4 runs through October 2, 2026; Congress aggregates run through October 3, 2026 (Senate through October 1, 2026); 13D/G through May 14, 2026; short interest through September 15, 2026; the price file ends October 2, 2026. Three limits are specific to this audit. First, the roster expanded before the recent audits — from 85 managers (83 filing) to 149 (147 filing) — so "of 147" counts are not comparable to earlier pieces' "of 83" figures. Second, a 13F put row reports shares covered by put options, not shares held long or sold short by the filer in the common-stock sense; this audit reports it exactly as filed, separately from the long count, and draws no conclusion about the filer's net exposure, which a single information-table row cannot show. Third, this week's MSCI session postdates every lens here; it is known to this audit only from outside coverage, not from our own files.
- Superinvestor lens: 147 managers in the collection (of a 149-manager roster; 144 at a June 30, 2026 period-end and 3 early filers at September 30, 2026) collected directly from SEC EDGAR Form 13F (managers_13f collection, regenerated October 15, 2026 for the expanded roster); Strategy positions are counted on the single CUSIP 594972408 only. Long rows: exactly 1 — Bill Miller - Miller Value Partners, 50,203 shares worth $4,364,147, a 1.03% portfolio weight, labelled DECREASED (-3.6%), filed August 14, 2026 — which is 100.0% of the long cohort total. That holder verifies row by row against the first quarter under the rule used in the previous audits — its first-quarter row (52,058 shares) sits under the same filing-agent prefix as its second-quarter accession and its implied shares-change reproduces the EDGAR label at one decimal place — so the verified change is 52,058 to 50,203 shares (-1,855, -3.6%), with no unverified continuing holders. No tracked manager exited in the second quarter. Option rows: exactly 1 — Sessa Capital, a put row covering 1,150,000 shares worth $99,969,500, labelled INCREASED (+3621.7%), filed August 14, 2026; its first-quarter put row covered 30,900 shares worth $3,856,320. The put-to-long ratio is 1,150,000 / 50,203 = 22.9 on shares and $99,969,500 / $4,364,147 = 22.9 on value, because both rows imply the same $86.93 per share, the June 30, 2026 close. The pipeline register totals combine both rows (2 rows totalling 1,200,203 shares in the second quarter and 82,958 in the first) and are not used as cohort figures.
- Full-market lens: SEC Form 13F Data Sets full-market aggregation. The primary table is the full13f collection's by-ticker file (holders = distinct filers reporting the ticker's CUSIP; 850 reported long positions out of 880 filers). Strategy carries a single CUSIP in this aggregation (594972408), and the backfill fixtures' by-CUSIP row for it matches the by-ticker row on every field — holders, long holders, shares, reported value, prior holders and prior reported value — exactly. The by-ticker file's entered/exited fields (782 and 848, a net of -66 that matches the change in holder count) are gross flows, so this audit headlines the net change. Reported-value caution: the aggregate value ($31,705,833,707 over 208,018,834 shares) implies $152.42 per share against a June 30, 2026 close of $86.93 in our price file, a gap of +75.34% — printed here as found. The aggregate sums the VALUE of every information-table row — including put and call option rows — while the share count covers long common-stock rows only, so we headline filer and share counts and label dollar values "reported."
- Insider lens: full-parse Form 4 aggregation (agg_by_ticker), record as of October 2, 2026 (133 filings). Sale and purchase counts are transaction-code counts (S and P) in non-derivative rows; grants and exercises are not counted as purchases, and one filing can contain many transaction rows. Purchase transactions total 32 across the record — 0 in the 90-day window (July 5 to October 2, 2026), 12 in the one-year window (October 3, 2025 to October 2, 2026) and 32 in the full record, 21 of them officer purchase transactions by 10 buyers, totalling 343,318 shares for $31,613,913.61; the one-year window holds 12 purchases (44,567 shares, $4,565,359.79, 5 buyers, 7 officer purchases). Sale transactions total 277 across the record (572,291 shares, $158,256,489.45, 8 sellers, 171 officer sale transactions), of which the one-year window holds 150 (289,472 shares, $47,364,422.44, 6 sellers) and the 90-day window holds 17 (16,506 shares, $1,922,308.27, 2 sellers, 1 officer sale transaction) across 8 filings. The site's insider aggregate (compiled as of October 16, 2026, over its own 90-day window) matches the full parse's 90-day window on every field — 0 purchases, 17 sales, 0 buyers, 2 sellers and $1,922,308.27 of sale value. Window price checks on our price file: the 90-day sales imply $116.46 per share, inside that window's close range ($91.67 to $168.50); the one-year sales imply $163.62 and the one-year purchases $102.44, inside the one-year range ($82.31 to $359.69); the full-record sales imply $276.53, inside the full-period range ($13.663 to $473.83).
- 13D/G lens: full-parse SC 13D/G parsed filings (19 filings matching issuer CIK 1050446 on CUSIP 594972408: 4 SC 13G and 15 SC 13G/A, 15 of them amendments, no SC 13D), filings through May 14, 2026. The site aggregation carries this name under a ticker-keyed row; that row (19 filings, 0 D-filings, 19 G-filings, 15 amendments, 16 reporters, latest date May 14, 2026, maximum 10.1%, total reported 641,753,379.87 shares) matches the parsed filings on filings, form mix, amendments, latest date, maximum and the cross-date reported total. The rows cited are reported as filed, under the names exactly as they appear: Capital International Investors printing 31,642,100 shares at 10.1% as of March 31, 2026, filed May 14, 2026 as SC 13G/A (the register maximum and the latest filing); Vanguard Capital Management printing 16,802,319 shares at 5.34% as of March 31, 2026, filed April 30, 2026 as SC 13G; and The Vanguard Group printing 0 shares at 0.0% as of March 13, 2026, filed March 27, 2026 as SC 13G/A. The parsed coverage for this issuer holds these 19 filings; a 5% holder that has not filed in the covered window would not appear here.
- Congress lens: Senate PTR archive and House PTR archive as maintained on this site. The combined record (as of October 3, 2026) and the House aggregate (as of October 3, 2026) each record 1 purchase transaction and 0 sales, by 1 member, with a last buy date of June 5, 2026 for this name; the Senate aggregate (as of October 1, 2026) carries no row. The combined aggregate records the member's party as D; this audit reports the transaction counts exactly as aggregated.
- Short interest lens: FINRA Equity Short Interest files (biweekly settlement dates), collected directly from FINRA's public distribution. The published series covers all 137 settlements under the symbol, every one a Strategy, Inc. row, from January 15, 2021 (1,419,012 shares, the series minimum) to September 15, 2026. The latest reading is 30,741,182 shares on September 15, 2026, down 5.77% from the prior settlement (32,622,124 on August 31, 2026), at 1.42 days to cover. The series maximum is 42,776,693 shares on June 30, 2026, so the latest reading sits 28.1% below it. FINRA publishes each settlement about two weeks after the fact, so the October price action is not yet in this series. The share-count ratio (11.07%) uses the fundamentals file's shares-outstanding figure below.
- Fundamentals note: our fundamentals collection carries Strategy's revenue of $463,456,000 (labelled fiscal 2024 in the file), net income of -$3,848,152,000 and assets of $61,641,082,000 (each labelled fiscal 2025 in the file). The file is marked ok for this name, with no missing fields: shares outstanding of 277,660,000 (sourced in the file to the weighted-average basic share count as of December 31, 2025) and a file-computed market value of $45,688,953,847.35. The file does not flag the issuer as a foreign private issuer, and it carries SIC 6199, Finance Services. The file's price for the name is $164.55 as of October 6, 2026; our daily-close file ends October 2, 2026 at $160.01, and we keep the two files' figures separate rather than blending them.
- Prices: our own daily-close file for Strategy through October 2, 2026 ($160.01 close, +5.3% year to date on that file; the 252-session closing high is $359.69 on October 6, 2025, so the last close sits 55.5% below it; the 252-session closing low is $82.31 on June 26, 2026, so the last close sits 94.4% above it; closes of $124.80 at March 31, 2026 and $86.93 at June 30, 2026, a second-quarter change of -30.3%; change from June 30 to October 2 of +84.1%; change from the September 30, 2025 close of $322.21 of -50.3%; the December 31, 2025 close is $151.95). The series in our price file begins June 1, 2021 at $47.776 and holds 1,342 rows; the file's full-period close range is $13.663 to $473.83.
- Market context sources: Google Trends United States daily listing via the gtrends mirror (checked October 17, 2026, Korea time; its stock-related searches — "crwv" at 1,000+, "mrna stock" at 500+, "soxl stock" at 200+, "now stock" at 200+ and "qqqm" at 200+ — were all already covered or skipped in this series, which is why this audit follows the next source) and StockTwits' trending list as carried October 16, 2026, which carried Strategy in its main trending section. MSCI item as reported by Reuters on October 16, 2026: MSCI adopted rules making non-operating companies ineligible for its Global Investable Market Indexes from the close of November 30, 2026; Strategy is on its list of potential deletions; the final list is due November 11, 2026; the shares fell 2.7% in premarket trading on Friday, as reported; and the company had previously warned an exclusion could see $2.8 billion of its stock liquidated, as reported in that coverage. Figures we could not confirm were left out; the external items above are reported speech from those outlets, not GetCoattail measurements.
- Strategy is in the GetCoattail stock-page universe: Strategy (MSTR) stock page. Series data: mstr_lens_data.csv · mstr_short_interest_series.csv. Earlier audits: ServiceNow · EchoStar.
Past patterns are not a promise of future results. For education only — not investment advice.
This article describes public filings as of the dates stated. It is not investment advice and makes no recommendation. Filings lag reality: 13F positions are as of June 30, 2026, and later trading is not yet public.
Revision history
- v1.0 — October 17, 2026: first publication.