GetCoattail Research — The Filing Tape #99. ServiceNow arrived in the search and trending lists on a run of analyst target raises ahead of its October 28 earnings report, and the filings describe a register the tracked cohort was leaving: 15 of the 147 superinvestors we track hold the stock, one is 41.4% of the cohort, the verified holders cut 31.3% in Q2, its insiders have recorded two purchases against 166 sales, and short interest has fallen 53.7% off its June 30 peak.
The Hype
ServiceNow drew attention in the week before this audit on two tracks. In the Google Trends United States daily listing checked for this audit, "now stock" sat among the top stock searches, and StockTwits' October 16 trending list carried the name as well. The news track, as reported, was a cluster of analyst target raises ahead of the third-quarter report, scheduled for after the close on October 28, 2026: Citi lifted its target to $170, Evercore ISI to $175 and TD Cowen to $165 in mid-October reports, following earlier October raises from Stifel, to $160, and UBS, to $150. The same week, the company denied any interest in acquiring Decagon, as reported. Those are outside figures, kept separate from our files below — which show a second quarter down 5.0%, a year-to-date decline of 12.3% through October 2, and a 35.4% rebound off the June 30 close into October 2, all before the target raises landed.
The Tape
For ServiceNow — the ninety-ninth Filing Tape audit — the tape shows a tracked cohort that cut hard in Q2 while the full market added, an insider record with two purchases in it, a congressional record of sales only, a thin 5% register of three passive filings, and a borrow that has more than halved since June 30.
| Lens | As of | What the filings show | Direction vs prior period |
|---|---|---|---|
| Superinvestors (13F) | Jun 30, 2026 (14 managers) + Sep 30, 2026 (1 manager) | 15 holder rows of 147 tracked managers; June-period 14 hold 12,939,386 shares; top holder is 41.4% of the 15-row total | Verified continuing holders -31.3% vs Q1; June rows: 6 INCREASED, 5 DECREASED, 2 UNCHANGED, 1 NEW; 2 exits |
| All institutions (13F) | Jun 30, 2026 | 2,226 filers; 830,426,605 shares; reported value $88,187,904,055 | Filers +59 (+2.72%); shares +9.94% |
| Insiders (Form 4) | Oct 2, 2026 | 2 purchases in the full parsed record (255 filings); 166 sales | Last 90 days: 0 purchases, 4 sales |
| Congress | Oct 3, 2026 | 2 recorded sales and 0 purchases in the combined aggregate; no Senate row | Sales only on record |
| 13D/G | Apr 30, 2026 | 3 parsed filings, all 13G family (1 SC 13G, 2 SC 13G/A); register maximum 8.9% (BlackRock, Inc.) | Latest filing reports 7.49% as of Mar 31, 2026 |
| Short interest (FINRA) | Sep 15, 2026 | 28,766,356 shares; 2.78% of shares outstanding; 1.99 days to cover | Down 5.11% from the prior settlement; down 53.7% from the Jun 30, 2026 peak |
Lens 1 — the superinvestors: 15 holder rows, one at 41.4%, and a verified cut of 31.3%. We track 149 large, mostly long-only managers whose 13F portfolios we collect directly from SEC EDGAR — 147 managers are in the collection: 144 at a June 30 period-end, and 3 early filers already at September 30. The count in this audit is long positions on the single CUSIP 81762P102, with no option rows: 15 holder rows totalling 12,976,586 shares worth $1,308,798,807 — a total that mixes two period-ends, so this audit splits it wherever it matters. Fourteen holders sit at June 30, 2026, holding 12,939,386 shares worth $1,303,813,635; the fifteenth, Sarasin & Partners (37,200 shares, INCREASED +123.0%), is a September 30 early filer and is counted separately throughout. The June labels read six INCREASED, five DECREASED, two UNCHANGED and one NEW. Polen Capital Management is the largest holder: 5,370,172 shares worth $533,150,641 — 41.4% of the 15-row total and 41.5% of the June-only subtotal — at a 4.59% portfolio weight, labelled DECREASED (-26.1%). Next, Saturna Capital holds 1,626,465 shares — 12.5% of the 15-row total — labelled INCREASED (+41.3%), and Sustainable Growth Advisers holds 1,331,464 shares, INCREASED (+32.4%). Thirteen of the fourteen June continuing holders verify row by row against the first quarter, moving together from 18,462,301 shares at March 31 to 12,689,048 at June 30 (-5,773,253 shares, -31.3%) — in a quarter the price fell 5.0%. Two moves do most of that work: Edgewood Management fell from 4,221,426 shares to 6,191 (-99.9%), and Polen cut 1,899,281 shares. The one NEW June holder is Bristol (John W. Bristol & Co.), at 250,338 shares, and two tracked managers exited entirely: Winslow Capital Management (499,866 shares in the prior quarter) and Sands Capital Management (31,521 shares). Twelve of the fourteen June rows imply exactly $99.28 per share, the June 30 close; Saturna's row implies $111.09 and DJE Kapital's $98.75, printed as filed, and Sarasin's September row implies $134.01. 13F figures are as of June 30, 2026; funds have up to 45 days to file, so this is the complete second-quarter picture — and, as ever, a lagging one.
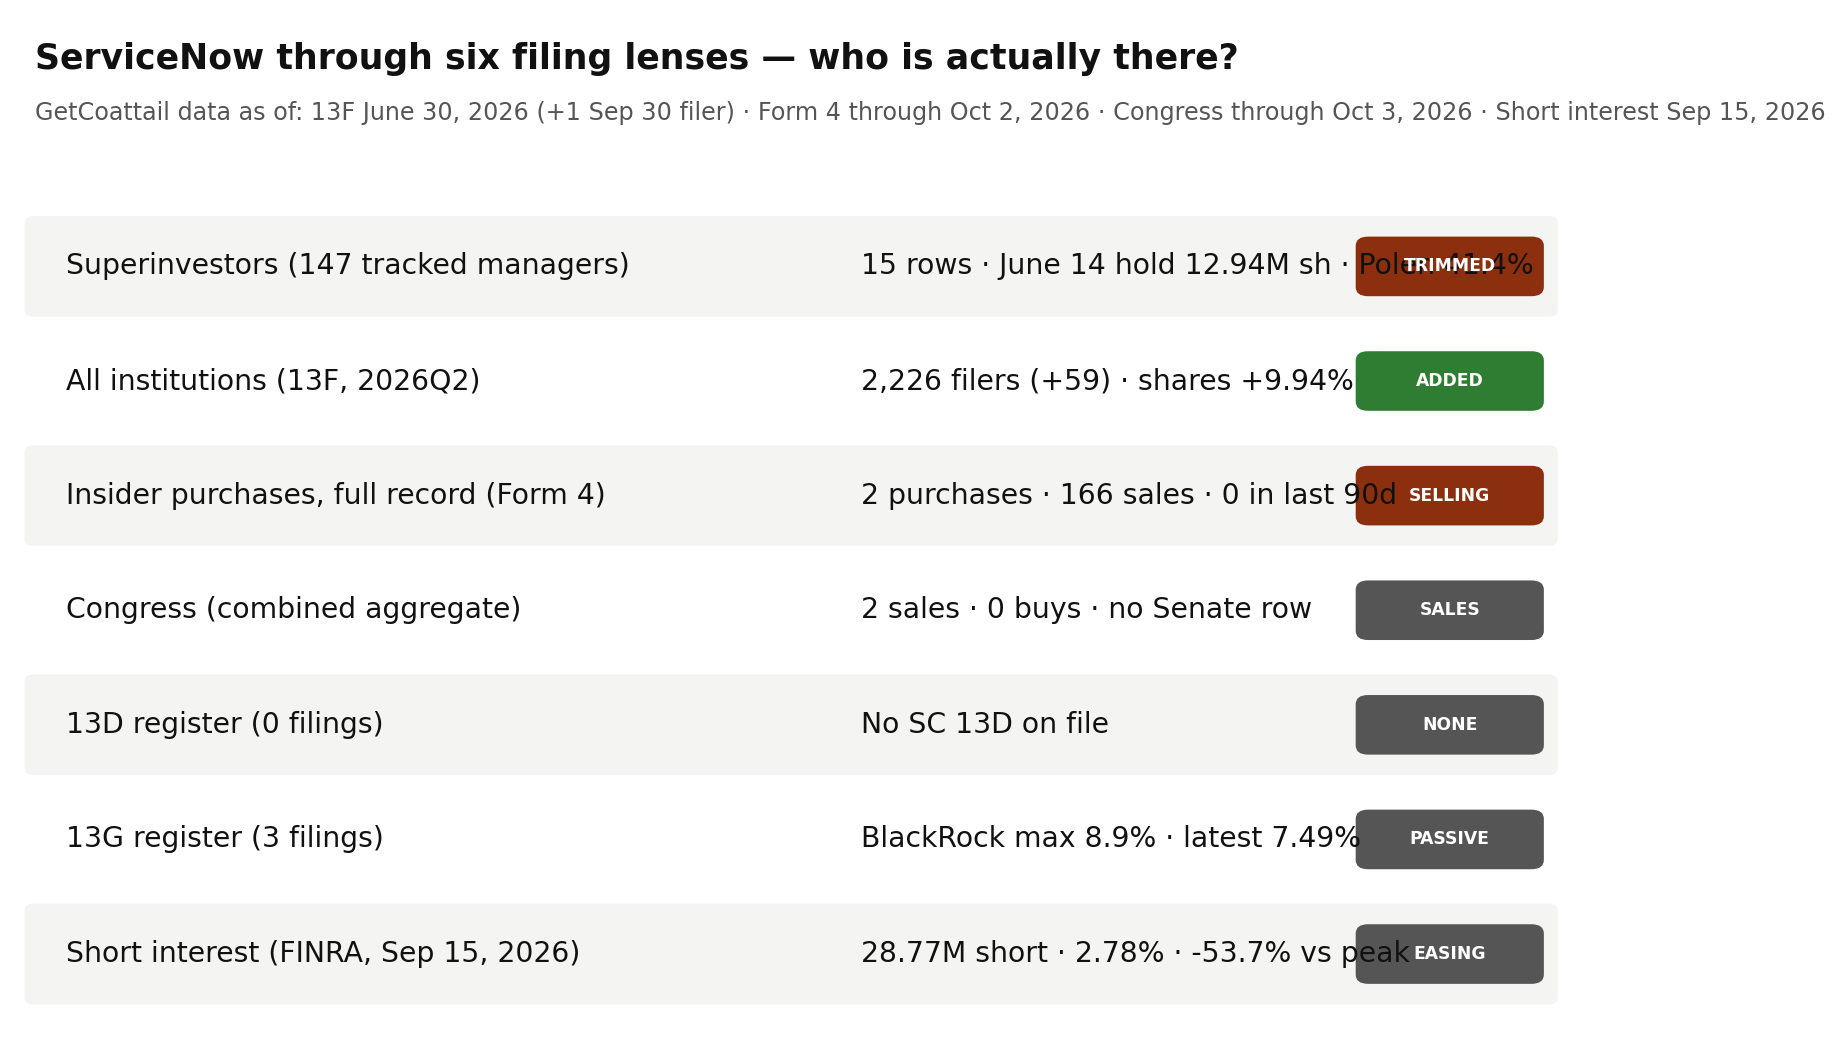
Lens 2 — institutions: 59 more filers, 75.1 million more shares. At June 30, 2026, 2,226 institutions reported positions, up 59 from 2,167 at March 31 (+2.72%); 2,213 are long. Reported shares rose 9.94%, from 755,331,517 to 830,426,605, while reported value rose 10.87% to $88,187,904,055, labelled "reported" because the aggregate includes option rows (see methodology). That value implies $106.20 per share against a June 30 close of $99.28, a gap of +6.97% — printed here as found.
Lens 3 — insiders: two purchases in the record, against 166 sales. The parsed Form 4 record holds 255 filings through October 2, 2026, with exactly 2 open-market purchase transactions in any window — both officer purchases, both by a single buyer, totalling 28,682 shares for $3,000,057.97, both inside the last year. Sales number 166 across the record: 127,902.42 shares by 17 sellers, 127 of them officer sales. The last 90 days hold 0 purchases against 4 sales (14,081 shares for $1,937,914.22, by 3 sellers) across 22 filings, and the one-year window holds the same 2 purchases against 29 sales. The recent windows price cleanly: the 90-day sales imply $137.63 per share, inside that window's traded close range of $91.94 to $147.99, and the one-year sales and purchases imply $145.83 and $104.60, inside the one-year range. The full-record sale total is cited as a count and a share count only: its as-filed dollar total spans older prints that predate the adjusted price series, so no full-record average price is used here (see methodology).
Lens 4 — Congress: two sales, no purchase, and no Senate row. The combined record (as of October 3, 2026) carries 2 recorded sale transactions and 0 purchases, and the House aggregate carries the same two sales. The Senate aggregate (as of October 1, 2026) carries no row at all. This audit counts the transactions the aggregates record; it does not turn them into a member count, because the aggregate's member field for this name prints zero alongside them.
Lens 5 — the 5% register: three filings, all passive, headed by BlackRock at 8.9%. Our full parse holds 3 SC 13D/G filings matching the site aggregate exactly — 1 SC 13G and 2 SC 13G/A filings, 2 of them amendments, across 3 reporter names, and no 13D filing at all. The register maximum is 8.9%: BlackRock, Inc. reports 18,250,532 shares as of December 31, 2024, filed February 5, 2025 as SC 13G/A. The latest filing is Vanguard Capital Management's SC 13G, reporting 78,361,628 shares (7.49%) as of March 31, 2026, filed April 30, 2026. Between those prints, The Vanguard Group filed an SC 13G/A reporting 0 shares (0.0%) as of March 13, 2026 — a change of reporting entity inside one fund family, recorded exactly as filed rather than read as an exit and an entry.
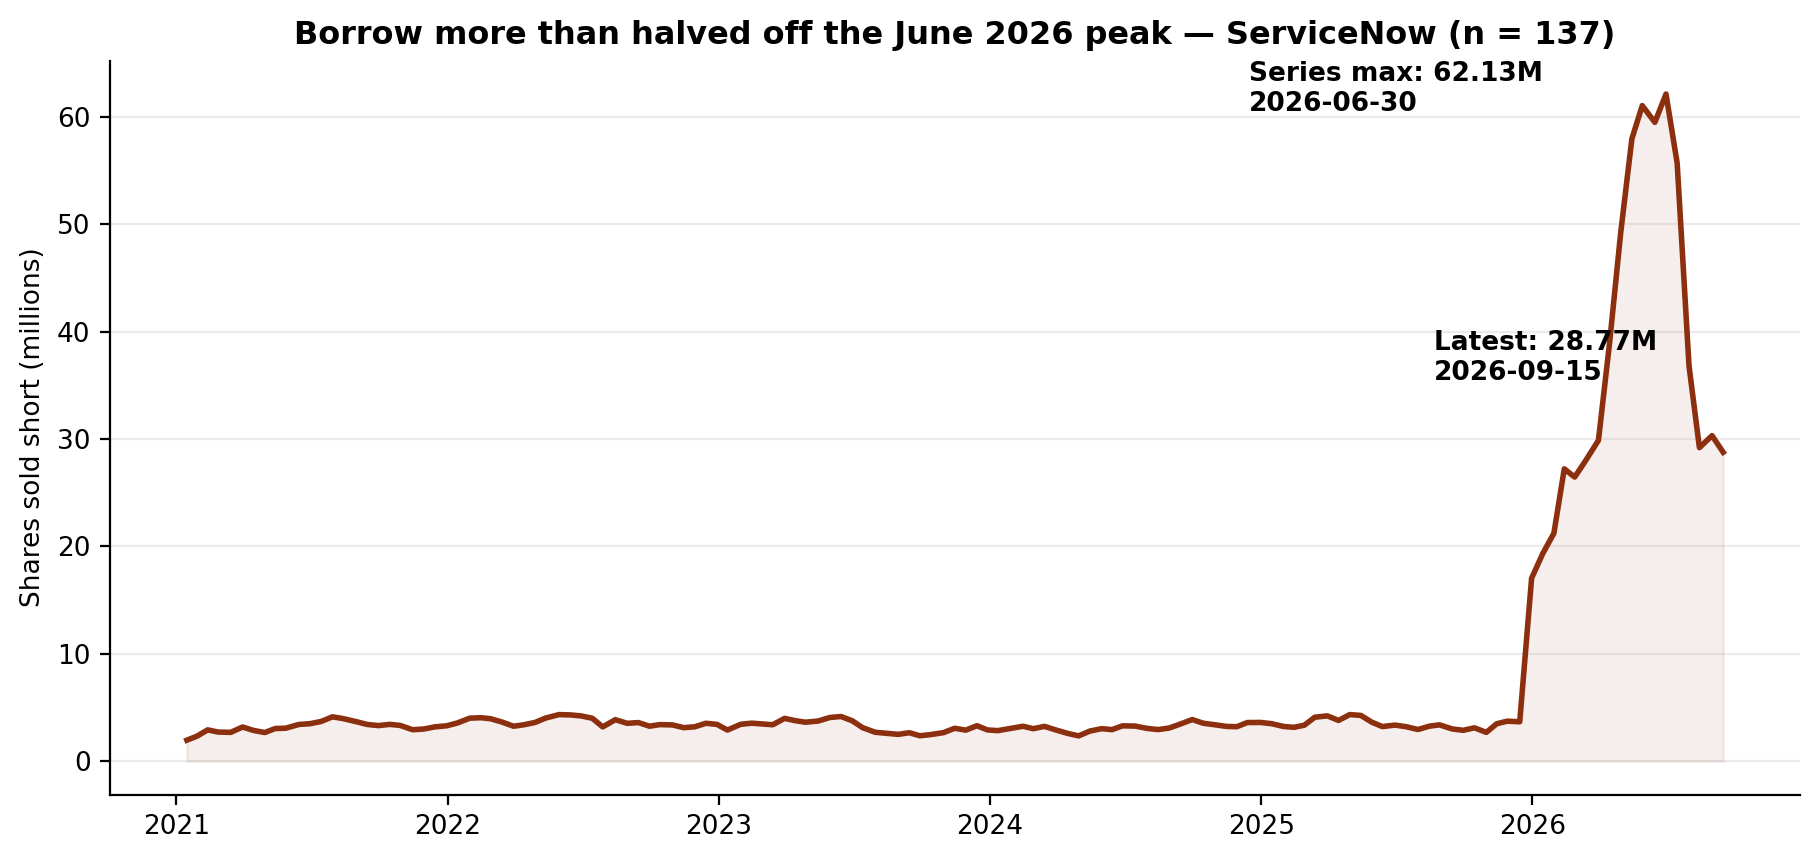
Lens 6 — short interest: 28,766,356 shares, down 53.7% from the June 30 peak. This lens uses all 137 FINRA settlements for the symbol, every one a ServiceNow row, from January 15, 2021 to September 15, 2026. As of September 15, 2026, 28,766,356 shares were sold short, down 5.11% from the prior settlement (30,315,334 on August 31, 2026), at 1.99 days to cover. The series maximum is the June 30, 2026 settlement itself, 62,126,642 shares — so the latest sits 53.7% below the peak, after stepping 62,126,642 (June 30) to 55,711,860 (July 15) to 36,794,698 (July 31) to 29,199,178 (August 14), up to 30,315,334 (August 31), then down to 28,766,356 (September 15). Against 1,034,000,000 shares outstanding, the borrow is 2.78% of the share count.
The Gap
The narrative arriving with this month's session is acceleration: a stack of target raises — $150 to $175 across five firms, as reported — into an October 28 earnings print, on a stock that had already rebounded 35.4% off its June 30 close by October 2. The filings, which mostly end before that rebound, describe positioning set by the preceding decline. The full market added: 59 more filers (+2.72%) holding 75,095,088 more shares (+9.94%). The tracked cohort did the opposite, on verified rows: 18,462,301 shares to 12,689,048 (-31.3%), with Polen at 41.4% of the cohort cutting 26.1% and Edgewood all but exiting. Insiders offer no counterweight: 2 purchases in 255 filings, both by one officer, against 166 sales — and none in the last 90 days. Congress recorded 2 sales and no purchase. The 5% register is three passive prints, the newest seven months old. The borrow is the one lens that has already turned: short interest peaked on June 30 at 62,126,642 shares and has fallen 53.7% since, to 2.78% of the share count. One plausible reading is that the target raises landed on a register the decline had already cleared — a broad market adding, a concentrated cohort trimming, insiders absent as buyers, and a borrow mostly unwound before the earnings date was close.
What Would Change the Picture
Nothing above is a recommendation. It is a record. These filings would change it:
- 1. The 2026Q3 13Fs (filing window closing mid-November 2026). Fourteen of the fifteen holder rows sit on a June 30 period-end; Sarasin's September 30 row (37,200 shares) is the season's first print. Whether Polen's 5,370,172-share position — 41.4% of the cohort after a 26.1% cut — is still there, and whether the verified 31.3% cut continues, decides whether the register still reads as concentrated and narrowing.
- 2. A purchase by a second insider, or any purchase in a fresh 90-day window. The record holds exactly 2 purchases, both by one officer, against 166 sales, and the last 90 days hold none. A purchase by anyone else, at any size, would widen this lens's buyer base beyond a single name for the first time in our record.
- 3. A first congressional purchase. The combined aggregate records 2 sales and 0 purchases, and the Senate aggregate holds no row. A first reported purchase by any member, in either chamber, would give this lens its first fact of that kind.
- 4. A fresh 5% print. The register's newest filing is dated April 30, 2026 (Vanguard Capital Management at 7.49% as of March 31, 2026), and its maximum — BlackRock at 8.9% — is dated December 31, 2024. A new filing that moves either figure, or a first 13D, would be this lens's first change of substance in months.
- 5. Short interest picking a direction. The borrow stands at 28,766,356 shares, down 53.7% from the June 30, 2026 peak of 62,126,642 and down 5.11% at the latest settlement. A move back above the August 31, 2026 reading of 30,315,334 would break the unwind; a fall below the August 14, 2026 reading of 29,199,178 sustained across settlements would extend it.
Related reading: Seven of 147: One Holder Is 69.0% of the Superinvestors' EchoStar Stake. Its Insiders Have Never Bought a Share. — Filing Tape #98; Twelve of 147: Viking's New Position Is 35.1% of the Superinvestors' Qualcomm Stake. Its Insiders Have Never Bought a Share. — Filing Tape #97. ServiceNow's own page: ServiceNow (NOW) on GetCoattail.
Methodology and data notes
- As-of & limits: The lenses rest on different clocks, none live: 13F is a June 30, 2026 snapshot published up to 45 days later (plus one September 30, 2026 early filer, separated wherever it appears); Form 4 runs through October 2, 2026; Congress aggregates run through October 3, 2026 (Senate through October 1, 2026); 13D/G through April 30, 2026; short interest through September 15, 2026; the price file ends October 2, 2026. Three limits are specific to this audit. First, the roster expanded before the recent audits — from 85 managers (83 filing) to 149 (147 filing) — so "of 147" counts are not comparable to earlier pieces' "of 83" figures. Second, the insider full-record dollar total is not price-comparable across the whole record (see the insider note below), so full-record insider activity is cited as transaction and share counts. Third, this month's session (through October 16, 2026) postdates every lens here; the session is known to this audit only from outside coverage, not from our own files.
- Superinvestor lens: 147 managers in the collection (of a 149-manager roster; 144 at a June 30, 2026 period-end and 3 early filers at September 30, 2026) collected directly from SEC EDGAR Form 13F (managers_13f collection, regenerated October 15, 2026 for the expanded roster); ServiceNow positions are counted on the single CUSIP 81762P102 only, long rows only, and there are no option rows for this name in the collection. Fifteen distinct managers hold long positions: fourteen at June 30, 2026 totalling 12,939,386 shares worth $1,303,813,635, plus Sarasin & Partners at September 30, 2026 with 37,200 shares worth $4,985,172 — a blended 12,976,586 shares worth $1,308,798,807 that this audit does not headline, because it mixes period-ends. The direction count on the June rows is six INCREASED, five DECREASED, two UNCHANGED and one NEW (Bristol (John W. Bristol & Co.), 250,338 shares); Sarasin's September row is labelled INCREASED. Polen Capital Management's share is 41.4% = 5,370,172 / 12,976,586 on the blended total and 41.5% = 5,370,172 / 12,939,386 on the June-only subtotal; Saturna Capital's share is 12.5% = 1,626,465 / 12,976,586. Thirteen June continuing holders verify row by row against the first quarter under the rule used in the previous audits — each continuing holder's first-quarter row accepted only when it sits under the same filing-agent prefix as the manager's second-quarter accession and its implied shares-change reproduces the EDGAR shares-change label at one decimal place — so the verified continuing total is 18,462,301 shares at March 31 moving to 12,689,048 at June 30 (-31.3%). First-quarter rows: Polen 7,269,453; Edgewood 4,221,426; Tiger Global 1,500,000; Saturna 1,151,313; SCGE 1,135,000; Akre 1,096,099; Sustainable Growth Advisers 1,005,271; Vulcan 533,817; Atalanta Sosnoff 440,571; Torray 54,854; Thornburg 29,835; DJE 21,285; Hillman 3,377. Sarasin & Partners does not verify under that rule, because its current collection row is the September filing, and it is excluded from the verified totals. Two tracked managers exited in the second quarter: Winslow Capital Management (499,866 shares, $52,260,990 prior value) and Sands Capital Management (31,521 shares, $3,295,521 prior value). Implied per-share values on the June rows: twelve rows imply exactly $99.28, the June 30, 2026 close; Saturna Capital's row implies $111.09 and DJE Kapital's $98.75, printed as filed; Sarasin's September row implies $134.01. The pipeline register totals are not identical to the collection totals for this name and are not used as cohort figures: the register carries 15 second-quarter rows totalling 12,956,071 shares (the 12,939,386 June cohort shares plus one 16,685-share row under a filing-agent accession that is not a June cohort row) and 16 first-quarter rows totalling 19,125,656 shares.
- Full-market lens: SEC Form 13F Data Sets full-market aggregation. The primary table is the full13f collection's by-ticker file (holders = distinct filers reporting the ticker's CUSIP; 2,213 reported long positions out of 2,226 filers). ServiceNow carries a single CUSIP in this aggregation (81762P102), and the backfill fixtures' by-CUSIP row for it matches the by-ticker row on every field — holders, long holders, shares, reported value, prior holders and prior reported value — exactly. The by-ticker file's entered/exited fields (1,663 and 1,604, a net of +59 that matches the change in holder count) are gross flows, so this audit headlines the net change. Reported-value caution: the aggregate value ($88,187,904,055 over 830,426,605 shares) implies $106.20 per share against a June 30, 2026 close of $99.28 in our price file, a gap of +6.97% — printed here as found. The aggregate sums the VALUE of every information-table row — including put and call option rows — while the share count covers long common-stock rows only, so we headline filer and share counts and label dollar values "reported."
- Insider lens: full-parse Form 4 aggregation (agg_by_ticker), record as of October 2, 2026 (255 filings). Sale and purchase counts are transaction-code counts (S and P) in non-derivative rows; grants and exercises are not counted as purchases, and one filing can contain many transaction rows. Purchase transactions total 2 across the record — 0 in the 90-day window (July 5 to October 2, 2026), 2 in the one-year window (October 3, 2025 to October 2, 2026) and 2 in the full record, all 2 of them officer purchase transactions by 1 buyer, totalling 28,682 shares for $3,000,057.97. Sale transactions total 166 across the record (127,902.42 shares, 17 sellers, 127 officer sale transactions), of which the one-year window holds 29 (63,494 shares, $9,259,061.71, 10 sellers) and the 90-day window holds 4 (14,081 shares, $1,937,914.22, 3 sellers, 2 officer sale transactions) across 22 filings. The site's insider aggregate (compiled as of October 16, 2026, over its own 90-day window) matches the full parse's 90-day window on every field — 0 purchases, 4 sales, 0 buyers, 3 sellers and $1,937,914.22 of sale value. Window price checks on our price file: the 90-day sales imply $137.63 per share, inside that window's close range ($91.94 to $147.99); the one-year sales imply $145.83 and the one-year purchases $104.60, inside the one-year range ($83.00 to $189.258). The full-record sale total as filed ($71,073,562.17 over 127,902.42 shares) implies $555.69 per share, above the price file's full-period close range ($68.352 to $234.078): the full-record aggregate spans prints from before the adjusted price series, so this audit cites the full record as transaction and share counts only and uses dollar figures only inside the 90-day and one-year windows, where they price inside their ranges.
- 13D/G lens: full-parse SC 13D/G parsed filings (3 filings matching issuer CIK 1373715 on CUSIP 81762P102: 1 SC 13G and 2 SC 13G/A, 2 of them amendments, no SC 13D), filings through April 30, 2026. The site aggregation carries this name under a ticker-keyed row; that row (3 filings, 0 D-filings, 3 G-filings, 2 amendments, 3 reporters, latest date April 30, 2026, maximum 8.9%, total reported 96,612,160 shares) matches the parsed filings on filings, form mix, amendments, latest date, maximum and the cross-date reported total. The rows are reported as filed, under the names exactly as they appear: BlackRock, Inc. printing 18,250,532 shares at 8.9% as of December 31, 2024, filed February 5, 2025 as SC 13G/A (the register maximum); The Vanguard Group printing 0 shares at 0.0% as of March 13, 2026, filed March 27, 2026 as SC 13G/A; and Vanguard Capital Management printing 78,361,628 shares at 7.49% as of March 31, 2026, filed April 30, 2026 as SC 13G (the latest filing). The parsed coverage for this issuer holds these 3 filings; a 5% holder that has not filed in the covered window would not appear here.
- Congress lens: Senate PTR archive and House PTR archive as maintained on this site. The combined record (as of October 3, 2026) and the House aggregate (as of October 3, 2026) each record 2 sale transactions and 0 purchases for this name; the Senate aggregate (as of October 1, 2026) carries no row. The combined aggregate's member-count field for this name prints 0 alongside the 2 recorded sales, so this audit reports the transaction counts exactly as aggregated and does not state a member count.
- Short interest lens: FINRA Equity Short Interest files (biweekly settlement dates), collected directly from FINRA's public distribution. The published series covers all 137 settlements under the symbol, every one a ServiceNow, Inc. row, from January 15, 2021 (1,958,404 shares, the series minimum) to September 15, 2026. The latest reading is 28,766,356 shares on September 15, 2026, down 5.11% from the prior settlement (30,315,334 on August 31, 2026), at 1.99 days to cover. The series maximum is 62,126,642 shares on June 30, 2026, so the latest reading sits 53.7% below it. FINRA publishes each settlement about two weeks after the fact, so the October price action is not yet in this series. The share-count ratio (2.78%) uses the fundamentals file's shares-outstanding figure below.
- Fundamentals note: our fundamentals collection carries ServiceNow's revenue of $13,278,000,000, net income of $1,748,000,000 and assets of $26,038,000,000, each labelled fiscal 2025 in the file. The file is marked ok for this name, with no missing fields: shares outstanding of 1,034,000,000 (sourced in the file to the shares-outstanding count as of June 30, 2026) and a file-computed market value of $142,660,981,262.21. The file does not flag the issuer as a foreign private issuer, and it carries SIC 7372, Services-Prepackaged Software. The file's price for the name is $137.97 as of October 6, 2026; our daily-close file ends October 2, 2026 at $134.38, and we keep the two files' figures separate rather than blending them.
- Prices: our own daily-close file for ServiceNow through October 2, 2026 ($134.38 close, -12.3% year to date on that file; the 252-session closing high is $189.258 on October 27, 2025, so the last close sits 29.0% below it; the 252-session closing low is $83.00 on April 10, 2026, so the last close sits 61.9% above it; closes of $104.55 at March 31, 2026 and $99.28 at June 30, 2026, a second-quarter change of -5.0%; change from June 30 to October 2 of +35.4%; change from the September 30, 2025 close of $184.056 of -27.0%; the December 31, 2025 close is $153.19). The series in our price file begins June 1, 2021 at $93.834 and holds 1,342 rows; the file's full-period close range is $68.352 to $234.078.
- Market context sources: Google Trends United States daily listing via the gtrends mirror (checked October 17, 2026, Korea time; "now stock" among the top stock searches at 200+ searches in that listing, behind "crwv" at 1,000+ and "mrna stock" at 500+ in the same listing) and StockTwits' trending list as carried October 16, 2026, which included ServiceNow among its other trending tickers. Analyst items as reported in October 2026 coverage: Citi raised its target to $170 (reported October 14, 2026), Evercore ISI to $175 (reported October 13, 2026), TD Cowen to $165 (reported October 15, 2026), Stifel to $160 (reported October 6, 2026) and UBS to $150 while keeping a Neutral rating (reported October 6, 2026); the company denied interest in acquiring Decagon on October 13, 2026, as reported; and the third-quarter report was scheduled for after the close on October 28, 2026, as reported. Figures we could not confirm were left out; the external items above are reported speech from those outlets, not GetCoattail measurements.
- ServiceNow is in the GetCoattail stock-page universe: ServiceNow (NOW) stock page. Series data: now_lens_data.csv · now_short_interest_series.csv. Earlier audits: EchoStar · Qualcomm.
Past patterns are not a promise of future results. For education only — not investment advice.
This article describes public filings as of the dates stated. It is not investment advice and makes no recommendation. Filings lag reality: 13F positions are as of June 30, 2026, and later trading is not yet public.
Revision history
- v1.0 — October 17, 2026: first publication.