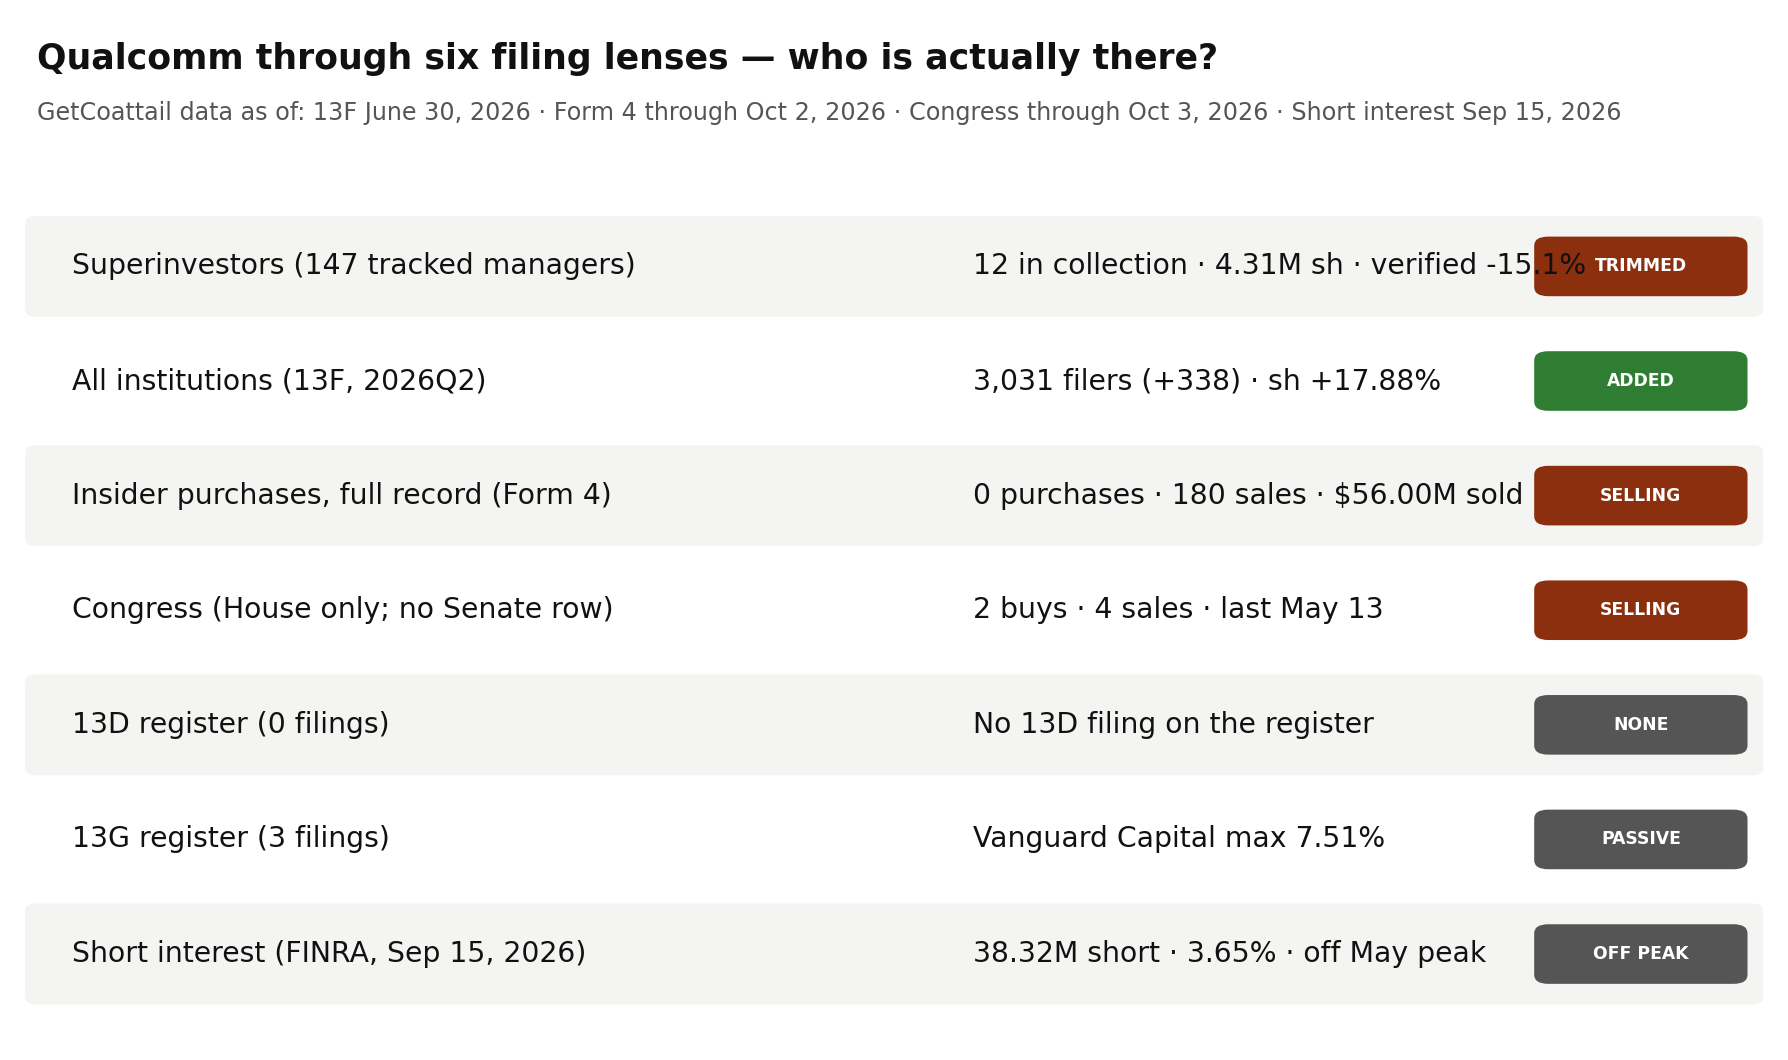
GetCoattail Research — The Filing Tape #97. Qualcomm spent the week in the chip selloff's decliner lists, and the filings describe a register reshaped by a rising quarter: 12 of the 147 superinvestors we track hold it, Viking's new position is 35.1% of the cohort, the verified holders cut 15.1% in Q2, its insiders recorded no purchase against 180 sales, and short interest is 80.0% above a year ago.
The Hype
Qualcomm drew attention this week as part of the semiconductor selloff, not as a solo story. Stocktwits' premarket account on October 16, carried by Asianet Newsable, placed Qualcomm in its Tech Radar list of names that continued to reel in the red, alongside Micron, SK Hynix and Broadcom, while Nvidia bucked the sector with a 0.5% premarket gain. A second Stocktwits account put Qualcomm, Broadcom and Nvidia in focus over a reported ByteDance–MediaTek AI-chip pact, describing a global chip rout, a seventh straight semiconductor-ETF decline and bearish retail sentiment on Qualcomm. The company added its own headline on October 16: a report that day said Qualcomm had renewed its global patent licenses with Transsion Holdings for 4G and 5G devices through 2031, following a broad patent license agreement with Huawei announced October 5. A Finnhub snapshot checked October 16 put the stock at $178.40, up 3.35% on the day, with a market value of about $188.36 billion and a 52-week range of $121.99 to $259.92 — kept separate from our price file below, which ends October 2 at $184.87. The selloff week landed after a second quarter in which the price rose 43.5%.
The Tape
For Qualcomm — the ninety-seventh Filing Tape audit — the tape shows a cohort built around one large new position, a full market that added 338 filers, an insider record with no purchase at all, a House-only congressional row, a 5% register with no 13D filing, and a borrow rebuilding since August.
| Lens | As of | What the filings show | Direction vs prior period |
|---|---|---|---|
| Superinvestors (13F) | Jun 30, 2026 | 12 holders in the collection; 4,308,620 shares; $795,994,580 | Verified continuing holders -15.1% vs Q1; 3 labelled INCREASED, 5 DECREASED, 1 UNCHANGED, 3 NEW in the collection; 1 manager exited in Q2 |
| All institutions (13F) | Jun 30, 2026 | 3,031 filers; 830,818,051 shares | Filers +338; shares +17.88% |
| Insiders (Form 4) | Oct 2, 2026 | 0 purchases in the full parsed record; 180 sales | Last 90 days: 0 purchases, 31 sales |
| Congress | Oct 3, 2026 | 2 purchases and 4 sales in the combined aggregate, all of it in the House; no Senate row | Last purchase May 13, 2026 |
| 13D/G | Aug 7, 2026 | 3 parsed filings (0 SC 13D-family, 3 SC 13G-family); register maximum 7.51% (Vanguard Capital Management) | Latest filing reports 5.0% as of Jun 30, 2026 |
| Short interest (FINRA) | Sep 15, 2026 | 38,316,643 shares; 3.65% of shares outstanding | Down 24.0% from the series peak on May 15, 2026; up 80.0% year over year |
Lens 1 — the superinvestors: 12 holders in the collection, one new position at 35.1%, and a verified core that cut. We track 149 large, mostly long-only managers whose 13F portfolios we collect directly from SEC EDGAR — 147 managers are in the collection: 144 at a June 30 period-end, and 3 early filers already at September 30. This name has a period mix among its holders, and this audit states it wherever the totals appear: 11 long holders are June 30, 2026 rows, totalling 4,048,031 shares worth $748,035,702, and the twelfth — David Katz - Matrix Asset Advisors, with 260,589 shares worth $47,958,878, labelled INCREASED (+6.8%) — is a September 30, 2026 early filing, filed October 13, 2026. Together the collection holds 4,308,620 shares worth $795,994,580 on the single CUSIP, with no option rows. Viking Global Investors is the largest holder: 1,514,185 shares worth $279,806,246 — 35.1% of the collection cohort, and 37.4% of the June 30 cohort alone — at a 0.80% portfolio weight, labelled NEW. Next, Coatue Management holds 1,387,312 shares worth $256,361,384 — 32.2% of the collection cohort — labelled UNCHANGED (0.0%), and Harry Burn - Sound Shore holds 547,812 shares labelled INCREASED (+29.0%). The collection labels read three INCREASED, five DECREASED, one UNCHANGED and three NEW — Viking, Maverick Capital (5,542 shares) and Axiom Investors (4,040 shares), 1,523,767 new shares between them; on June 30 rows alone, two INCREASED, five DECREASED, one UNCHANGED and three NEW. Eight of the nine continuing holders verify row by row against the first quarter, moving together from 2,971,967 shares at March 31 to 2,524,264 at June 30 (-447,703 shares, -15.1%) — in a quarter the price rose 43.5%. The ninth continuing holder, Katz, does not verify that way because its collection row is the September filing, so no cohort-wide first-quarter total is published in this audit. Among the verified eight, the largest cut was Mairs & Power Funds', from 478,055 shares to 179,832 (-62.4% on its label), and the largest increase was Sound Shore's, from 424,796 shares to 547,812. One tracked manager exited in the second quarter: Vitaliy Katsenelson - Investment Management Associates, which had held 100,185 shares at March 31. 13F figures are as of June 30, 2026 for the June filers; funds have up to 45 days to file, so this is the complete second-quarter picture — and, as ever, a lagging one.
Lens 2 — institutions: 338 more filers, 126.0 million more shares. At June 30, 2026, 3,031 institutions reported positions, up 338 from 2,693 at March 31 (+12.55%); 3,016 are long. Reported shares rose 17.88%, from 704,812,357 to 830,818,051 — a gain of 126,005,694 shares — while reported value rose 75.15% to $157,590,747,025, labelled "reported" because the aggregate includes option rows (see methodology).
Lens 3 — insiders: no purchase in the entire parsed record, against 180 sales — every sale an officer's. The parsed Form 4 record holds 132 filings through October 2, 2026, with 0 open-market purchase transactions in any window — not in the last 90 days, not in the last year, and not in the full record. Sales number 180 across the record: 332,659 shares for $55,995,150.31, by 7 sellers, and all 180 are officer sale transactions. The one-year window holds 121 of those sales (276,206 shares, $47,079,301.15), and the last 90 days hold 31 sales of 31,631 shares for $5,893,252.86, by 4 sellers — and no purchase.
Lens 4 — Congress: two purchases and four sales, all of it in the House. The combined record (as of October 3, 2026) carries a row with 2 purchases and 4 sales, one member, the last purchase dated May 13, 2026. The House aggregate carries the identical row. The Senate aggregate carries no row for this name at all, so the combined figure is a House figure, leaning to sales four to two.
Lens 5 — the 5% register: three filings, all passive, no 13D. Our full parse holds 3 SC 13D/G filings matching the site aggregate exactly — no SC 13D-family filing and three SC 13G-family filings (two SC 13G, one SC 13G/A), one of them an amendment, across three names. The register maximum is 7.51%: Vanguard Capital Management reports 80,227,136 shares as of March 31, 2026, filed April 30, 2026 as SC 13G. The latest filing is State Street Corporation's SC 13G, reporting 52,822,532 shares (5.0%) as of June 30, 2026, filed August 7, 2026. The third row is The Vanguard Group printing 0 shares (0.0%) as of March 13, 2026 — reported as filed, and not combined with the other Vanguard name.
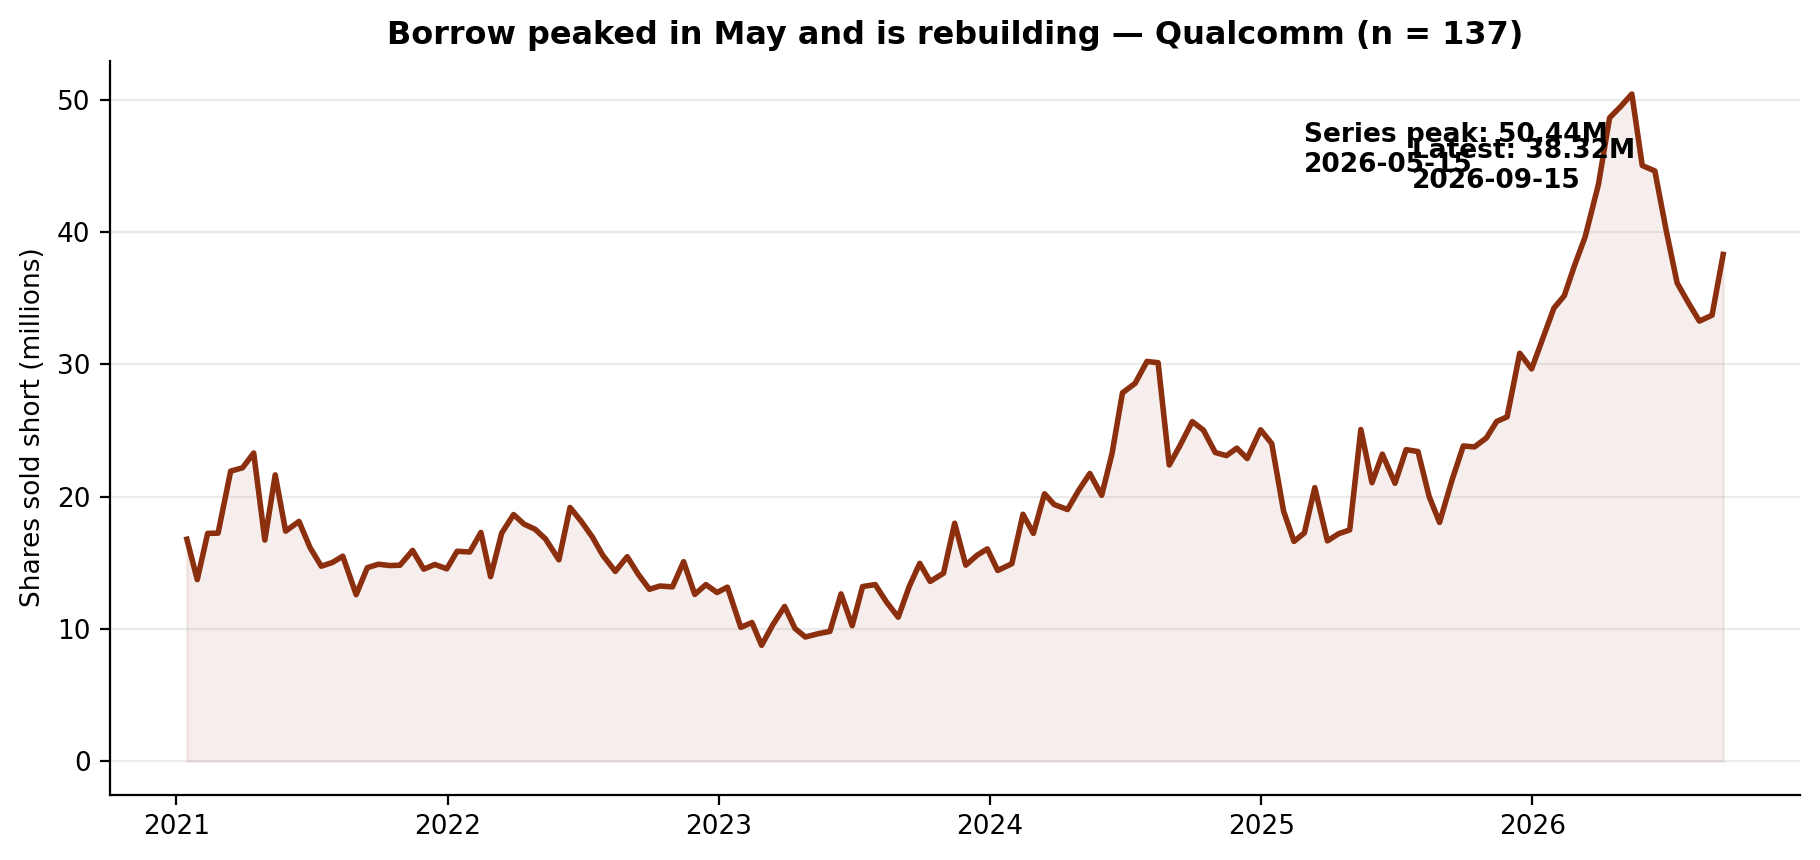
Lens 6 — short interest: 38,316,643 shares, off the May peak, rebuilt since August. The series covers all 137 FINRA settlements in the collection, from January 15, 2021 to September 15, 2026. As of September 15, 2026, 38,316,643 shares were sold short, up 13.6% from the prior settlement (33,718,025 on August 31, 2026), at 3.06 days to cover. The series maximum is 50,442,626 shares on May 15, 2026 (verified by a maximum query over the series), so the latest sits 24.0% below the peak — and 80.0% above the year-ago settlement (21,286,327 on September 15, 2025). Against 1,050,000,000 shares outstanding, the borrow is 3.65% of the share count.
The Gap
The narrative arriving with this week's session is sector-wide: a chip rout, bearish retail sentiment on this name in Stocktwits' account, and a licensing headline — on a stock our price file shows essentially flat since June 30 ($184.79 to $184.87), after a 43.5% second-quarter rise. The filings, which mostly end before that session, describe a register the rising quarter had already rearranged in opposite directions at different levels. The full market added: 338 more filers (+12.55%) holding 126,005,694 more shares (+17.88%). The tracked cohort's verified core did the opposite, cutting 15.1% (2,971,967 shares to 2,524,264) while one manager exited — and the cohort's headline total only holds up because Viking's new 1,514,185-share position, 35.1% of the collection cohort, entered in the same quarter. Insiders did not buy the rise: no purchase in 132 filings, against 180 sales worth $55,995,150.31, every one an officer sale. Congress leans the same way — two House purchases against four sales, no Senate row — and the 5% register holds no activist, its largest print at 7.51%. The borrow is the lens that has moved most since the quarter ended: short interest fell from its May 15, 2026 peak of 50,442,626 to 33,274,306 on August 14, then rebuilt over two settlements to 38,316,643, still 80.0% above a year ago. One plausible reading is that the week's selloff landed on a positioning picture set by the rise — a broad market adding, a tracked core trimming into a single large new holder, insiders absent as buyers throughout, and a borrow already rebuilding.
What Would Change the Picture
Nothing above is a recommendation. It is a record. These filings would change it:
- 1. The 2026Q3 13Fs (filing window closing mid-November 2026). Eleven of the twelve collection holders sit on a June 30 period-end, and one early third-quarter filing is already in — David Katz - Matrix Asset Advisors' September 30 filing carries 260,589 shares, labelled INCREASED (+6.8%) against its own prior quarter. Whether Viking's new 1,514,185-share position is still there, and whether the verified core's 15.1% cut continues, decides whether the register still reads as rotating.
- 2. A first insider purchase of any kind. The record holds 0 purchases in every window against 180 officer sales. A single open-market purchase, at any size, would be this lens's first fact of its kind in our record.
- 3. A Senate row, or a shift in the House balance. The combined aggregate rests on one House member's record — two purchases (last May 13, 2026) against four sales — and the Senate aggregate has no row. A first Senate-side transaction, or House buying that outweighs the sales, changes a lens that points one way.
- 4. A first 13D, or a materially different passive print. The register's 3 filings are all passive 13G-family prints, and its maximum — 7.51% — is dated March 31, 2026. A first activist-style 13D, or a materially different Vanguard or State Street print, would be this lens's first change of kind.
- 5. Short interest picking a direction. The borrow stands at 38,316,643 shares, down 24.0% from its May 15, 2026 peak of 50,442,626 but up 13.6% at the latest settlement and 80.0% year over year. A fall back below the August 14, 2026 reading of 33,274,306 would resume the unwind; a move back above the June 30, 2026 settlement of 40,203,445 would rebuild it toward the peak.
Related reading: Fifteen of 147: One Holder Is 47.3% of the Superinvestors' Intuit Stake. Its Insiders Have Bought Twice. — Filing Tape #96; Sixteen of 147: One Holder Is 93.1% of the Superinvestors' Coca-Cola Stake. Its Insiders Sold $87.9 Million in 90 Days. — Filing Tape #95. Qualcomm's own page: Qualcomm (QCOM) on GetCoattail.
Methodology and data notes
- As-of & limits: The lenses rest on different clocks, none live: 13F is a June 30, 2026 snapshot published up to 45 days later (with one September 30 early filing in this name, stated wherever it enters); Form 4 runs through October 2, 2026; Congress aggregates run through October 3, 2026; 13D/G through August 7, 2026; short interest through September 15, 2026; the price file ends October 2, 2026. Three limits are specific to this audit. First, the roster expanded before the recent audits — from 85 managers (83 filing) to 149 (147 filing) — so "of 147" counts are not comparable to earlier pieces' "of 83" figures. Second, this name's superinvestor picture mixes periods: 11 holders are June 30 rows and one, David Katz - Matrix Asset Advisors, is a September 30 early filer — the collection totals in this audit include that row, as stated wherever they appear, and the June-only totals are given alongside them. Third, this week's session (through October 15, 2026) postdates every lens here; the session is known to this audit only from outside coverage, not from our own files.
- Superinvestor lens: 147 managers in the collection (of a 149-manager roster; 144 at a June 30, 2026 period-end and 3 early filers at September 30, 2026) collected directly from SEC EDGAR Form 13F (managers_13f collection, regenerated October 15, 2026 for the expanded roster); Qualcomm positions identified by CUSIP 747525103. Twelve distinct managers hold long positions in the collection, totalling 4,308,620 shares; the collection carries no option row for this issuer. The direction count on the collection's labels, across the long rows, is three INCREASED, five DECREASED, one UNCHANGED and three NEW; on June 30 rows alone it is two INCREASED, five DECREASED, one UNCHANGED and three NEW. Viking Global Investors' share of the collection cohort is 35.1% = 1,514,185 / 4,308,620, and 37.4% = 1,514,185 / 4,048,031 of the June 30 cohort alone; Coatue Management's share of the collection cohort is 32.2% = 1,387,312 / 4,308,620. All eleven June 30 holders' reported values imply exactly $184.79 per share, the June 30, 2026 close in our price file; the September holder, Katz, implies $184.04 on its September filing, printed as filed and not used as a June price check, and the collection total implies $184.74. Quarter-to-quarter continuing totals are published in this audit only for the verified subset, following the rule used in the previous audits: each continuing holder's first-quarter row was accepted only when (a) it sits under the same filing-agent prefix as the manager's second-quarter accession — the pipeline files' accession prefixes identify filing agents, not managers, and several prefixes are shared — and (b) the row's implied shares-change reproduces the manager's EDGAR shares-change label at one decimal place. Eight of the nine continuing holders verify exactly that way (first-quarter rows including 498,613 shares for David Tepper - Appaloosa Management, 478,055 for Mairs & Power Funds and 424,796 for Harry Burn - Sound Shore), so the verified continuing total is 2,971,967 shares at March 31 moving to 2,524,264 at June 30 (-15.1%). Katz does not verify that way — its collection row is a September 30 filing, not a June row — so it is excluded from the verified subset and no cohort-wide first-quarter total is published. The pipeline register totals are not identical to the collection totals for this name, and are not used as cohort figures: the register carries 12 second-quarter rows totalling 4,291,923 shares, because it holds Katz's June 30 row of 243,892 shares where the collection holds Katz's September 30 row of 260,589 shares; the register's first-quarter total is 10 rows totalling 3,359,391 shares, which includes the exited manager's row.
- Full-market lens: SEC Form 13F Data Sets full-market aggregation. The primary table is the full13f collection's by-ticker file (holders = distinct filers reporting the ticker's CUSIP; 3,016 reported long positions out of 3,031 filers). Qualcomm carries a single CUSIP in this aggregation (747525103), and the backfill fixtures' by-CUSIP row for it matches the by-ticker row on every field — holders, long holders, shares, reported value, prior holders and prior reported value — exactly. The by-ticker file's entered/exited fields (2,053 and 1,715, a net of +338 that matches the change in holder count) are gross flows, so this audit headlines the net change. Reported-value caution: the aggregate value ($157,590,747,025 over 830,818,051 shares) implies $189.68 per share against a June 30, 2026 close of $184.79 in our price file, a gap of +2.65% — printed here as found. The aggregate sums the VALUE of every information-table row — including put and call option rows — while the share count covers long common-stock rows only, so we headline filer and share counts and label dollar values "reported."
- Insider lens: full-parse Form 4 aggregation (agg_by_ticker), record as of October 2, 2026 (132 filings). Sale and purchase counts are transaction-code counts (S and P) in non-derivative rows; grants and exercises are not counted as purchases, and one filing can contain many transaction rows. Purchase transactions total 0 across the record — 0 in the 90-day window (July 5 to October 2, 2026), 0 in the one-year window (October 3, 2025 to October 2, 2026) and 0 in the full record, with zero buyers and zero officer purchase transactions in every window. Sale transactions total 180 across the record (332,659 shares, $55,995,150.31, 7 sellers, all 180 of them officer sale transactions), 121 in the one-year window (276,206 shares, $47,079,301.15, 6 sellers) and 31 in the 90-day window (31,631 shares, $5,893,252.86, 4 sellers, all 31 of them officer sale transactions). The site's insider aggregate (compiled as of October 16, 2026, over its own 90-day window ending that day) reports 0 purchases, 19 sales, 0 buyers and 4 sellers with $0.00 of purchase value and $5,422,941.06 of sale value — not an exact match to the full parse's 90-day window, because the two windows end on different dates (October 16 against October 2) and the site window therefore drops the earliest July sales in the parse window; this audit cites the full parse throughout. The full-parse aggregate's sale totals imply $186.31 per share for the 90-day window, $170.45 for the one-year window and $168.33 for the full record, each inside the traded close range of its window on our price file ($147.61 to $201.97 for the 90-day window, $124.07 to $251.02 for the one-year window, $103.02 to $251.02 for the full record), so the totals are cited as figures in this article.
- 13D/G lens: full-parse SC 13D/G parsed filings (3 filings matching issuer CIK 804328 on CUSIP 747525103: two SC 13G and one SC 13G/A, the /A filing being an amendment; there is no SC 13D-family filing for this issuer in the parsed coverage), filings through August 7, 2026. The site aggregation carries this name under a ticker-keyed row; that row (3 filings, 0 D-filings, 3 G-filings, 1 amendment, 3 reporters, latest date August 7, 2026, maximum 7.51% and 133,049,668 reported shares) matches the parsed filings on filings, form mix, amendments, latest date, maximum and reported-share total. The parsed reporting-person rows sum to 133,049,668 shares, but that total sums reporting-person rows across different dates, so it is not used as a stake figure in the article. The rows are reported as filed, under the names exactly as they appear: The Vanguard Group printing 0 shares at 0.0% as of March 13, 2026, filed March 27, 2026 as SC 13G/A; Vanguard Capital Management printing 80,227,136 shares at 7.51% as of March 31, 2026, filed April 30, 2026 as SC 13G; and STATE STREET CORPORATION printing 52,822,532 shares at 5.0% as of June 30, 2026, filed August 7, 2026 as SC 13G. The two Vanguard names are separate reporting persons as filed and are not combined in this audit. The parsed coverage for this issuer holds these 3 filings; a 5% holder that has not filed in the covered window would not appear here.
- Congress lens: Senate PTR archive and House PTR archive as maintained on this site. The combined record (as of October 3, 2026) carries a Qualcomm row with 2 purchases and 4 sales (one member, party listed as R in the aggregate, last purchase May 13, 2026); the House aggregate (as of October 3, 2026) carries the identical row from the same member; and the Senate aggregate carries no row for this name. This audit therefore describes the combined figure as a House record, not as a two-chamber signal.
- Short interest lens: FINRA Equity Short Interest files (biweekly settlement dates), collected directly from FINRA's public distribution. The published series covers all 137 settlements in the collection, from January 15, 2021 (first settlement in the series, 16,784,019 shares) to September 15, 2026. The latest reading is 38,316,643 shares on September 15, 2026, up 13.6% from the prior settlement (33,718,025 on August 31, 2026). The series maximum is 50,442,626 shares on May 15, 2026 (verified by a maximum query over the series, not read off the latest row), so the latest reading sits 24.0% below the maximum. The year-ago settlement (September 15, 2025) printed 21,286,327 shares, so the latest reading sits 80.0% above a year ago. The June 30, 2026 settlement printed 40,203,445 shares, so the latest reading sits 4.7% below it. The series minimum is 8,761,368 shares on February 28, 2023. The files report each settlement as filed and do not restate earlier settlements; the largest step between consecutive settlements in the series is 1.434x, and every percentage comparison in this article is computed between settlements on or after September 15, 2025, so that step does not enter any of them. FINRA publishes each settlement about two weeks after the fact, so the October price action is not yet in this series. The share-count ratio (3.65%) uses the fundamentals file's shares-outstanding figure below.
- Fundamentals note: our fundamentals collection carries Qualcomm's revenue of $44,284,000,000, net income of $5,541,000,000 and assets of $50,143,000,000, each labelled fiscal 2025 in the file. The file is marked ok for this name, with no missing fields: shares outstanding of 1,050,000,000 (as of July 27, 2026 in the file, sourced in the file to the share count) and a file-computed market value of $190,081,498,718.26. The file does not flag the issuer as a foreign private issuer, and it carries SIC 3663, Radio & Tv Broadcasting & Communications Equipment. The file's price for the name is $181.03 as of October 6, 2026; our daily-close file ends October 2, 2026 at $184.87, and we keep the two files' figures separate rather than blending them.
- Prices: our own daily-close file for Qualcomm through October 2, 2026 ($184.87 close, +8.1% year to date on that file; the 252-session closing high is $251.02 on May 29, 2026, so the last close sits 26.4% below it; the 252-session closing low is $124.07 on April 7, 2026, so the last close sits 49.0% above it; closes of $128.78 at March 31, 2026 and $184.79 at June 30, 2026, a second-quarter change of +43.5%; change from June 30 to October 2 of +0.0%; change from the September 30, 2025 close of $166.36 of +11.1%). The series in our price file begins June 1, 2021 at $133.94 and holds 1,342 rows; the file's full-period close range is $103.02 to $251.02.
- Market context sources: Stocktwits' premarket account carried by Asianet Newsable (published October 16, 2026, checked October 16, 2026; its Tech Radar list, in order, was CoreWeave and Nebius, then Micron, SK Hynix, Broadcom and Qualcomm continuing to reel in the red, Nvidia bucking the sector with a 0.5% premarket gain, then Taiwan Semiconductor and Apple); Stocktwits' ByteDance/MediaTek account carried by Asianet Newsable (checked October 16, 2026; Qualcomm, Broadcom and Nvidia in focus as ByteDance reportedly closes in on a MediaTek pact for AI data-center chips; a global chip rout, the semiconductor ETF down for a seventh consecutive session and 1.7% overnight, bearish retail sentiment on Qualcomm, Qualcomm up 2.5% year to date in that account); ad-hoc-news' report of October 16, 2026 (checked October 16, 2026; Qualcomm renewed its global patent licenses with Transsion Holdings for 4G and 5G devices through 2031, as reported that day, and announced a broad patent license agreement with Huawei on October 5, 2026; market value $190.5 billion as of October 15 in that report's snapshot — a different snapshot from the Finnhub figure below, and neither is a GetCoattail measurement); and the Finnhub market snapshot for Qualcomm checked October 16, 2026 (price $178.40, up 3.35% on the day against a $172.62 previous close, market value about $188.36 billion, 52-week range $121.99 to $259.92, five-day return +0.72%, one-month return -3.48%, one-year return +8.73% — a third-party snapshot, not a GetCoattail measurement, and kept separate from our price file above). Figures we could not confirm were left out; the external items above are reported speech from those outlets, not GetCoattail measurements.
- Qualcomm is in the GetCoattail stock-page universe: Qualcomm (QCOM) stock page. Series data: qcom_lens_data.csv · qcom_short_interest_series.csv. Earlier audits: Intuit · Coca-Cola.
Past patterns are not a promise of future results. For education only — not investment advice.
This article describes public filings as of the dates stated. It is not investment advice and makes no recommendation. Filings lag reality: 13F positions are as of June 30, 2026, and later trading is not yet public.
Revision history
- v1.0 — October 16, 2026: first publication.