GetCoattail Research — The Filing Tape #198. Nasdaq, Inc. through six filing lenses, as of the latest filings. Past patterns are not a promise of future results. For education only — not investment advice.
The Hype
Nasdaq, Inc. (NDAQ) sits on TipRanks' "Trending Stocks by Analyst" list, ranked by recent analyst activity, with page values dated October 23, 2026. The names ranked ahead of it — Meta, Lam Research, Waste Connections, Spotify, United Rentals, Western Digital, Thermo Fisher, Procter & Gamble, Abbott, Tesla, Knight-Swift, Union Pacific, and Texas Instruments — are all already covered, making Nasdaq the first uncovered name. The page lists a Strong Buy consensus for it, a $116.40 price target (13.49% upside), and 7 Buy, 1 Hold, and 0 Sell ratings (row values dated October 23, 2026). No other news event is cited for Nasdaq: the attention claim rests on that listing plus the measured price tape.
The price tape behind the attention is a fall, then a rebound that the filing window only partly captures. NDAQ closed 2025 at $97.13, stood at $84.89 by March 31, 2026, then fell 7.2% in Q2 to $78.82 by June 30, recovered to $92.01 by September 30, and closed the price file on October 2 at $90.33 — 14.6% above its June 30 close but 7.0% below its 2025 year-end close. The daily refresh (cross-source) puts the October 23 close at $102.56 — 13.5% above the October 2 close, 30.1% above June 30, and 5.6% above the 2025 year-end close. While the price fell in Q2 and then rebounded, what did the tracked holders, the broad market, insiders, one member of Congress, and the passive register actually do?
The Tape
| Lens | As of | What the filings show | Direction vs prior period |
|---|---|---|---|
| Superinvestors (13F) | Jun 30, 2026 | 4 of 147 tracked managers hold; 9,587,896 shares ($755.72M reported). Oakmark is 84.4%. | Verified cohort shares +9.2%; 3 increases, 1 decrease; 0 new holders, 0 exits |
| All institutions (13F) | Jun 30, 2026 | 1,080 filers hold 469,614,822 shares ($36.24B reported). | Shares +15.73%; filers +2; reported value +8.29% |
| Insiders (Form 4) | Oct 2, 2026 | 0 buys, 10 sells in 90 days ($5.38M sold); 3 buys in the year ($21.68M, all non-officer). | No buys in 90 days; buys in the year are all non-officer |
| Congress | Oct 3, 2026 | 1 member traded both ways: 1 buy, 1 sell (House only). | Present lens, not empty; no Senate row |
| 13D/G | Aug 13, 2026 | 9 filings: 1 SC 13D/A, 2 SC 13G, 6 SC 13G/A; Vanguard max 10.39%. | One activist-form amendment; otherwise passive |
| Short interest | Sep 15, 2026 | 7,482,822 shares short, 1.34% of shares outstanding; 2.56 days to cover. | 20.7% below the Dec 2025 peak; +23.0% from prior settlement; −19.8% vs June; +28.7% year over year |
Chart: Nasdaq through six filing lenses — who is actually there?
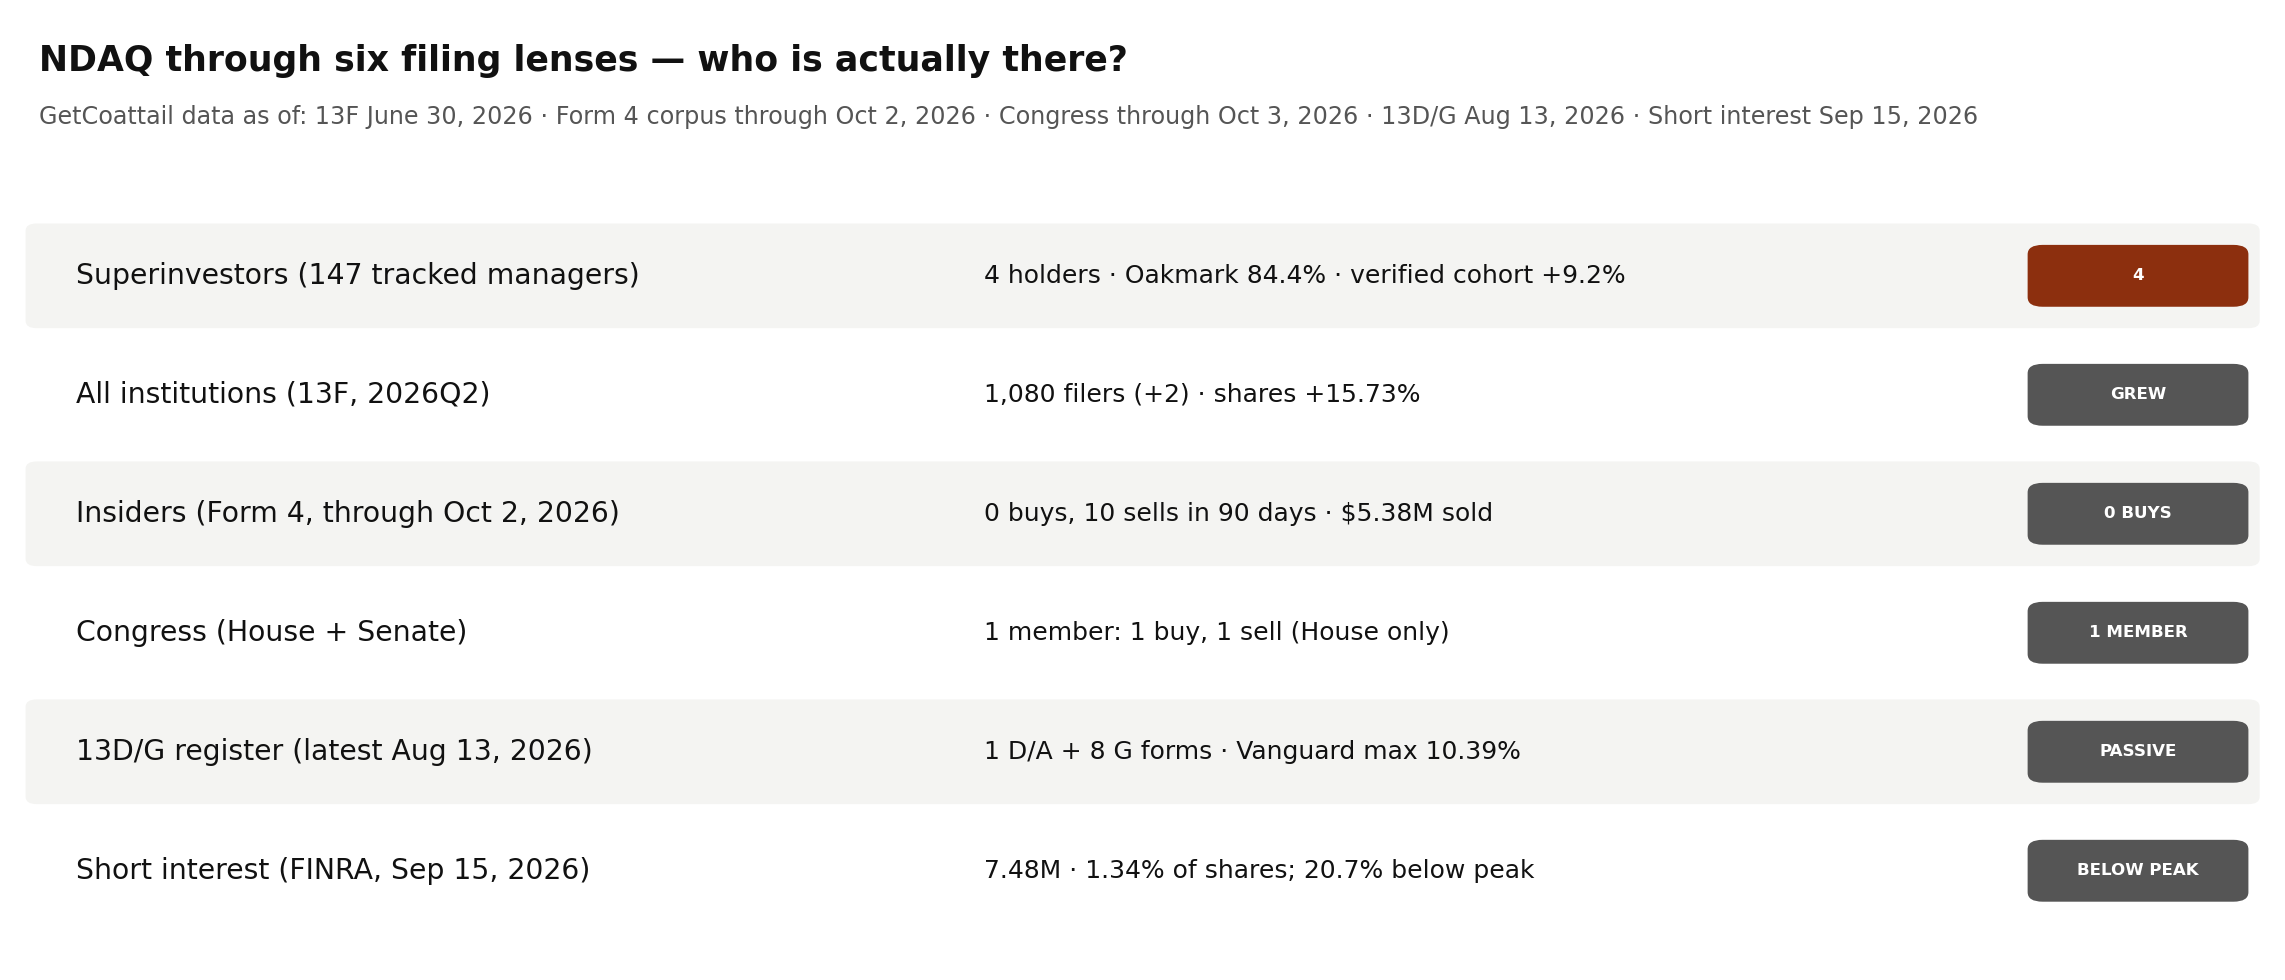
Superinvestors. The tracked register for Nasdaq is small, concentrated, and — unlike the price in Q2 — growing. Four of 147 tracked managers hold 9,587,896 common shares — $755,717,958 reported — and the largest holder is 84.4% of it. Bill Nygren's Oakmark Funds holds 8,092,686 shares at 0.85% of its portfolio, INCREASED +1.0% against a verified Q1 pair of 8,010,183 shares. Flossbach von Storch holds 891,940 shares at 0.32% of its portfolio, INCREASED +30.2% against a verified Q1 pair of 684,974 shares. Guinness Asset Management holds 563,280 shares at 0.75% of its portfolio, INCREASED +3019.3% against a verified Q1 pair of just 18,058 shares — a large percentage on a small base, not a data error: the share count rose by 545,222. Mirova US holds 39,990 shares at 0.03% of its portfolio, DECREASED −39.6% against a verified Q1 pair of 66,207 shares. All four labels recompute exactly. There are no new holders and no exits, and no September early filer holds NDAQ, so the June cohort is the whole tracked story. The verified continuing change reconciles under both pairing methods: the 4 holders held 8,779,422 shares in Q1, so the cohort grew 808,474 shares, or 9.2%, in Q2. Both pipeline registers reconcile exactly, residual zero in each quarter. The cohort's implied price matches the June 30 close exactly ($78.82). The cohort is 2.04% of the full market's reported Nasdaq shares — a small footprint that grew while the price fell.
All institutions. The broad market agrees with the tracked cohort here, on a much larger scale. Filers rose by just 2 to 1,080, of which 1,079 are long, while reported shares rose 15.73% (+63,828,170 shares to 469,614,822). Reported value rose 8.29% to $36.24 billion — shares up faster than value, because the June 30 close ($78.82) sits below the March 31 close ($84.89). Underneath, 955 filers entered and 953 exited, net +2. Excluding the tracked cohort, other institutions hold 460,026,926 shares — so the broad market's Q2 share growth (+63.83 million shares) dwarfs the tracked cohort's verified growth (+0.81 million shares), and the two moved in the same direction.
Insiders. This lens needs careful wording, because the 90-day window and the year window say different things. In the 90 days to October 2, 2026, insiders bought nothing and sold $5,383,819.99 worth of stock: 9 filings, 0 buys, 10 sells, 57,079 shares, 4 sellers, all officer sells. In the year to October 2, 2026: 68 filings, 3 buys, 28 sells, 268,782 shares bought for $21,675,476.36 against 924,961 shares sold for $86,944,358.14, by 2 buyers and 8 sellers, with 0 officer buys and 28 officer sells. Across the whole corpus, the same 3 buys appear, with 49 sells totalling 1,024,752 shares for $95,258,632.43. The scan for issuer CIK 1120193 (123 files, all NDAQ, January 14, 2025 to September 24, 2026) matches the aggregate exactly, and the site insider aggregate matches the 90-day window exactly. The article therefore never says insiders "never bought": zero buys in the 90 days, exactly 3 buys in the year, all non-officer — Investor AB, 200,000 shares at $79.1752 (filed February 13, 2026) and 56,782 shares at $85.98 (filed June 15, 2026), and Torgeby Johan, 12,000 shares at $79.86 (filed February 19, 2026). One seller dominates the recent window: Griggs PC Nelson accounts for 32,023 of the 57,079 shares sold in the 90 days (56.1%), across 4 transactions. Implied sell prices sit inside the price-file range in every window ($94.32 in the 90 days against a $84.39–$99.47 range; $94.00 in the year against a $76.85–$100.98 range), and the implied buy price ($80.64) sits inside the year range too.
Congress. This lens is small, not empty. One member traded NDAQ in both directions: 1 buy transaction and 1 sell transaction in the combined file, with the House row carrying the same counts and no Senate row. The member file names Delaney, April McClain (D), with 1 buy and 1 sell, a last transaction date of August 25, 2026, and amount bands of $1,001–$15,000 and $100,001–$250,000 (all as of October 3, 2026). The file does not say which band belongs to the buy and which to the sell, so this article does not assign them; the combined file's last buy date is April 24, 2026. Congress findings are member-disclosure aggregates, not Form 4 insider transactions, and are never added to insider totals.
13D/G. The control register is mostly passive, with one activist-form amendment and one below-threshold exit print. It holds 9 filings: 1 Schedule 13D/A, 2 Schedule 13G, and 6 Schedule 13G/A amendments, from 9 distinct reporter names. The largest reported percentage is 10.39% for The Vanguard Group (59,648,406 shares, event September 30, 2025, filed October 6, 2025). The latest filing, August 13, 2026, is Wellington entities at 5.4% (30,332,304 shares, event June 30, 2026); one day earlier, Massachusetts Financial Services filed at 4.1% (23,259,540 shares, event June 30, 2026). The single activist-form filing is an amendment, not a new activist stake: Argus Seller, LP and Thoma Bravo UGP, LLC at 4.44% (25,474,207 shares, event May 7, 2025, filed May 9, 2025). Vanguard's March 2026 filing reports 0.0 shares at 0.0% (event March 13, 2026, filed March 27, 2026) — a below-threshold print, quoted as reported, not as a holding. The aggregate matches the parsed set exactly.
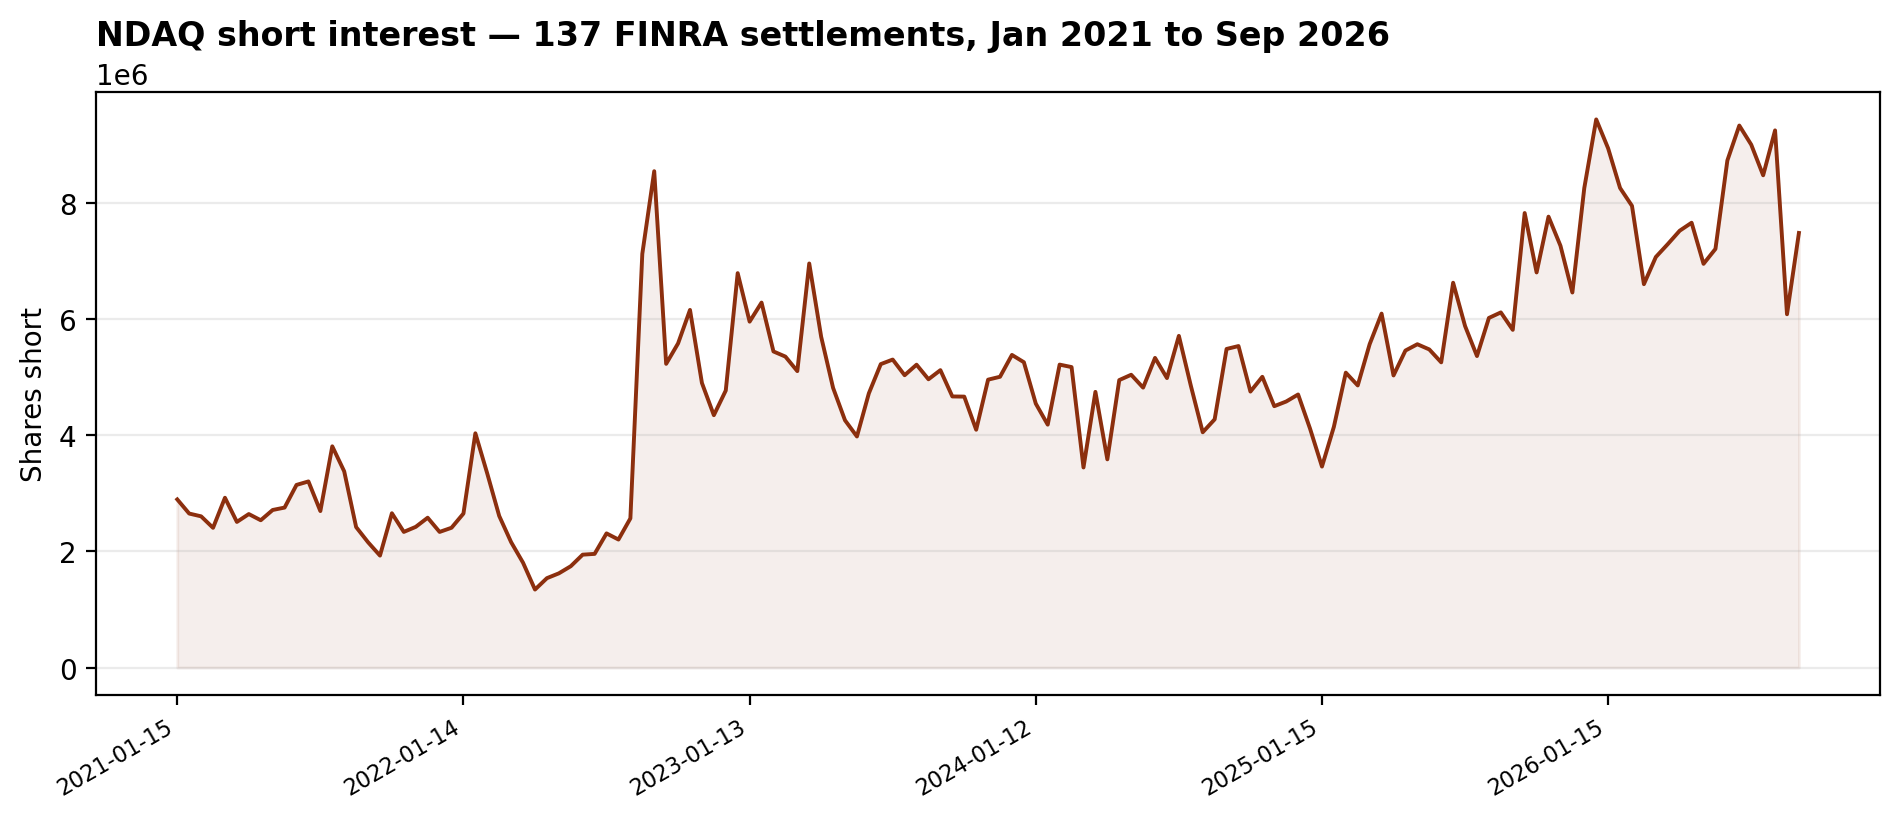
Short interest. The bear trade is small and easing from its peak, with a sharp dip and a partial rebound. FINRA short interest stood at 7,482,822 shares at September 15, 2026, with 2.56 days to cover and 1.34% of the 558,977,372 shares outstanding (a point-in-time count as of July 16, 2026). That latest settlement is 20.7% below the series peak of 9,437,576 (December 31, 2025), 23.0% above the prior settlement (6,083,576 at August 31), 19.8% below June 30 (9,331,915), and 28.7% above the year-ago figure (5,814,815 at September 15, 2025). The last six settlements read: 9,331,915 (June 30), 9,002,697 (July 15), 8,475,420 (July 31), 9,248,434 (August 14), 6,083,576 (August 31), 7,482,822 (September 15) — down from June with a sharp August 31 dip and a partial rebound. The series low is 1,343,666 (April 14, 2022). One step needs a flag, not a story: the largest step, 2.773× from August 15 to August 31, 2022, carries a stock-split flag matching the 3-for-1 split on August 29, 2022, so it is a mechanical share-count step, not a trading step. One row carries a revision flag (May 31, 2023).
Chart: NDAQ short interest — 137 FINRA settlements, January 2021 to September 2026.
Fundamentals context. Shares outstanding are 558,977,372 (July 16, 2026); FY2025 revenue $8,262,000,000, net income $1,788,000,000, assets $31,053,000,000. Recorded market capitalisation $51,576,840,238 uses the record's own price_close ($92.27, October 6, 2026), not the October 23 close.
The Gap
The attention and the filing tape mostly agree here — and that is the interesting part, because the price path inside the window does not. A trending listing with a Strong Buy consensus and 7 Buy ratings puts Nasdaq in front of readers while the Q2 price fell 7.2% — yet the tracked cohort added 9.2% in that quarter and the broad market added 15.73% in shares. The gap is between the price and the tape in Q2, not between the tape's lenses: both added while the price fell, insiders sold in the 90 days without buying while 3 non-officer buys sit in the year window, one member of Congress traded both ways, the control register holds one activist-form amendment among passive filings, and short interest eased from its peak. Then the price caught up: +14.6% from June 30 to October 2, and +30.1% to the October 23 fresh close — after the filings' window, so the filings cannot explain it. In short: the tape added through the dip; the rebound came later, outside the tape's window.
What Would Change the Picture
Nothing above is a recommendation. It is a record. What would change it:
- 1. Q3 13F season (filings due by November 16, 2026). Watch whether Oakmark holds or trims its 8,092,686 shares after a 1.0% add, whether Guinness's 563,280 shares survive after a 3019.3% build from 18,058, whether Mirova's remaining 39,990 shares exit after a 39.6% cut, and whether the cohort's 9.2% Q2 growth extends, holds, or reverses.
- 2. A first officer buy in the Form 4 corpus after October 2, 2026 would break a run of zero officer buys in every window; continued selling at the 90-day pace ($5.38 million) would extend the recent pattern.
- 3. A second congressional trader, or a Senate row for NDAQ would widen a lens that currently holds a single House member trading both ways.
- 4. A new Schedule 13D filing, a new passive reporter above 5%, or a new Schedule 13G/A moving Wellington above or below 5.4% would change a control register that currently holds one activist-form amendment among passive filings.
- 5. Short-interest direction. A fall back toward the August 31 level of 6,083,576 — or a rise back toward the December 2025 peak of 9,437,576 — would each tell a different story about the bear position that dipped sharply and partly rebounded.
As-of & Limits
| Lens | As of | Limit or note |
|---|---|---|
| Superinvestors (13F) | Jun 30, 2026 | 13F figures are as of June 30, 2026, the quarter-end. Funds have up to 45 days after quarter-end to file, so this is the most recent complete picture — and it is always a lagging one. Common stock only (CUSIP 631103108); no option rows, no second class in the tracked file. All Q1→Q2 changes verify exactly under both pairing methods. Both pipeline registers reconcile with residual zero. Guinness's +3019.3% is a verified build from an 18,058-share Q1 base. Mirova's −39.6% is a verified pair on the shared series filer CIK 1172661, chosen by CUSIP-overlap pairing. No September early filer holds NDAQ. |
| All institutions (13F) | Jun 30, 2026 | Reported value includes option rows by definition; implied price ($77.17) is not a price check. Value rose less than shares because the June close sits below the March close. |
| Insiders (Form 4) | Oct 2, 2026 | Zero buys in the 90 days to October 2, 2026; exactly 3 buys totalling 268,782 shares in the year, all non-officer (Investor AB twice, Torgeby Johan once). Officer buy transactions are 0 in every window. The scan (123 files, issuer CIK 1120193) matches the aggregate exactly. |
| Congress | Oct 3, 2026 | Present lens: 1 member (Delaney, April McClain, D), 1 buy and 1 sell, last transaction date August 25, 2026, combined last buy April 24, 2026. The member file does not attribute the two amount bands to the buy or the sell, so they are quoted unassigned. No Senate row. Congress findings are member-disclosure aggregates, not Form 4 insider transactions, and are never added to insider totals. |
| 13D/G | Aug 13, 2026 | Mostly passive register: 1 SC 13D/A, 2 SC 13G, 6 SC 13G/A. Filing percentages are as reported in each filing; denominators differ by filing date and are not recomputed. Jointly-reported positions are counted once per reporting entity in parsed totals, so no cross-date total is quoted as a holding. Vanguard's 0.0-share March 2026 print is quoted as reported. |
| Short interest | Sep 15, 2026 | Shares-outstanding count is a point-in-time count as of July 16, 2026. The largest step (2.773×, August 2022) carries a stock-split flag matching the 3-for-1 split — read the level and the drift, not that step. |
| Prices | Oct 23, 2026 (fresh close) | Price file ends Oct 2, 2026; the Oct 23 close ($102.56) and moves derived from it are cross-source (chart_stats) and labelled as such. The price file's splits field records a 3-for-1 split on August 29, 2022, and its rows show no break at the split. The chart_stats 52-week-high field ($104.21) is a different window from the price file's 252-day high ($100.98) and is quoted as its own field. |
| Fundamentals | FY2025 | Recorded market capitalisation uses the record's own price_close ($92.27 as of Oct 6, 2026), not the Oct 23 close, and is quoted only as the record's figure. Shares outstanding are a point-in-time count as of July 16, 2026. |
| Hype source | Oct 26, 2026 (TipRanks trending list) | Listing only (trending by analyst activity, page values dated October 23, 2026; NDAQ row values dated October 23, 2026); no other news event is cited for Nasdaq in this article. Price moves are measured from the price file and chart_stats. |
Methodology & disclaimer: 13F holdings are long common shares unless stated; reported values include option rows for the all-institutions lens by definition. Short interest is FINRA twice-monthly settlements. Trading costs and taxes are not reflected in any figure. Past patterns are not a promise of future results. For education only — not investment advice.
This article describes filings and market data for education. It is not investment advice. Data: SEC EDGAR 13F (as of June 30, 2026, filed within 45 days), Form 4 corpus checked through October 2, 2026 (123 parsed files for issuer CIK 1120193), House/Senate disclosures through October 3, 2026, SC 13D/G parsed register through August 13, 2026, FINRA short interest at September 15, 2026 settlement. 13F covers long positions of $100M+ managers only and is always a lagging picture. Trading costs and taxes are not reflected.
Related research: Two of 147: Both Superinvestors Cut Knight-Swift 41.0% in the Quarter It Rose 35.2% · Twenty-Two of 147: Dodge & Cox Raised Its Thermo Fisher Stake 11,767.4% in Q2 — While Insiders Sold $61.6 Million in 90 Days · Track the tape on Nasdaq's stock page and the 13F filing season hub.
Revision history: v1.0 — October 26, 2026. Initial publication. Signals and lens aggregates: ndaq_lens_data.csv. Short-interest series: ndaq_short_interest_series.csv.
Past patterns are not a promise of future results. For education only — not investment advice.